ALWAYS CONSULT YOUR INVESTMENT PROFESSIONAL BEFORE MAKING ANY INVESTMENT DECISION

March 23, 2022 | Inventory of New Houses Piles Up to Highest since 2008. Sales & Prices Drop. Stocks of Homebuilders Swoon

Wolf Richter


The inventory of new single-family houses for sale rose to 407,000 houses in February (seasonally adjusted), the largest unsold inventory since August 2008, up by 40% from a year ago. This represents 6.3 months of supply at the current rate of sales, according to data from the Census Bureau today.
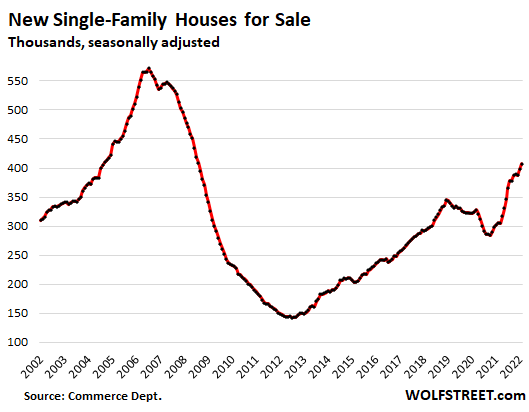
A problematic mix. Homebuilders are facing historic spikes in costs, and they’re hobbled by shortages of materials, supplies, and labor that have been stalling construction projects and impeded the completion of projects. Potential buyers are hobbled by surging mortgage rates and prices that last year spiked into the sky. This is turning in to a problematic mix.
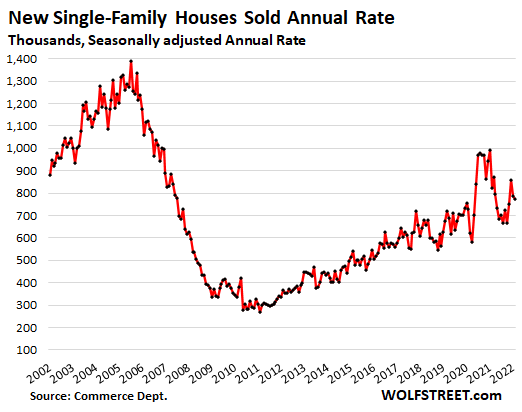
Sales of new houses in February fell to a seasonally adjusted annual rate of 772,000 houses, down 6% year-over-year. Sales remain far below the boom years of 2002-2006.
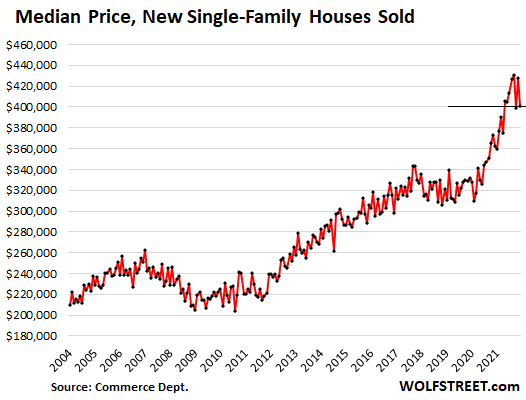
The median price of single-family houses sold, having apparently hit some kind of ceiling last year, fell to $400,600 in February, down about 7% from the peak in November 2021 ($430,300), having now bounced up and down in the same range since July 2021 ($406,000).
This whittled down the year-over-year gain to 10.7%, from the year-over-year gains of 20% to 24% that had raged last year through November.
Note the ridiculous price spike from June 2020 through July 2021, and how prices might have bumped into some sort of ceiling late last year:
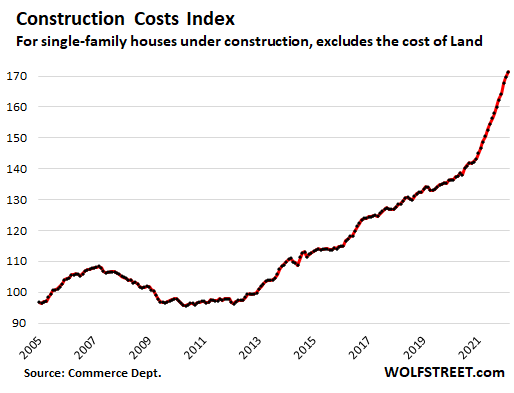
Construction costs of single-family houses – excluding the cost of land and other non-construction costs – spiked by 17% year-over-year, the third month in a row of 17% spikes, according to separate data from the Census Bureau today. These were the worst cost spikes in the data that go back to 1964, amid all kinds of shortages and delays, and with everyone being able to pass on higher prices.
This chart shows the year-over-year increases in the construction cost index of new single-family houses:
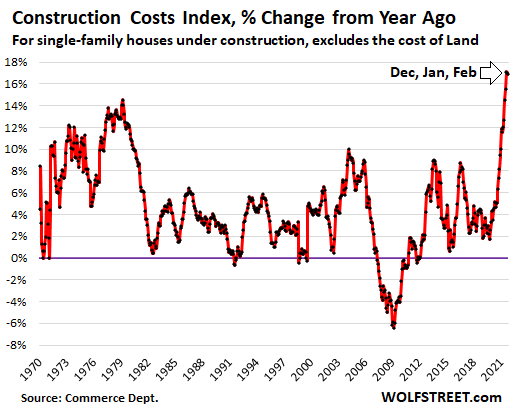
The chart below shows the actual index, with index values. Since June 2020, the index has spiked by 24%. Note what happened during the Housing Bust: Between April 2007 and February 2012, the construction cost index fell by 11%:
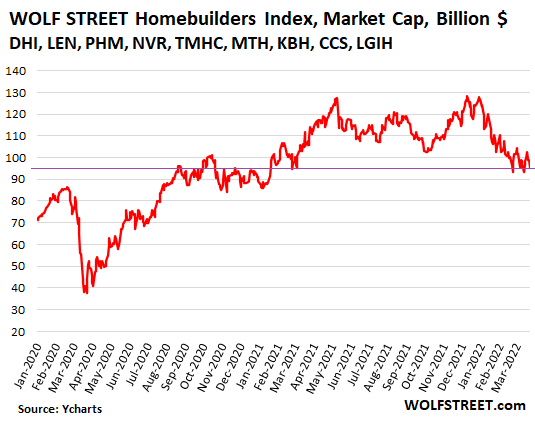
Homebuilder stocks swooned upon the news. Their stock price moves by early afternoon today:
- R. Horton [DHI]: -4.3%
- Lennar [LEN]: -3.6%
- PulteGroup [PHM]: -3.2%
- NVR [NVR]: -1.5%
- Taylor Morrison [TMHC]: -4.7%
- Meritage Homes [MTH]: -4.4%
- KB Home [KBH]: -4.5%
- Century Communities [CCS]: -4.7%
- LGI Homes [LGIH]: -7.8%
But sentiment about the homebuilders has been souring since December last year. The WOLF STREET Homebuilders Index, based on the combined market cap of the above nine homebuilders, fell 4% as of early afternoon today, is down 26% from the 52-week high last December, and is back where it had first been in August 2020:
STAY INFORMED! Receive our Weekly Recap of thought provoking articles, podcasts, and radio delivered to your inbox for FREE! Sign up here for the HoweStreet.com Weekly Recap.
Wolf Richter March 23rd, 2022
Posted In: Wolf Street