


Recent inflation readings and the market action year to date remind of past cycles. Recall that inflation is a lagging economic indicator.
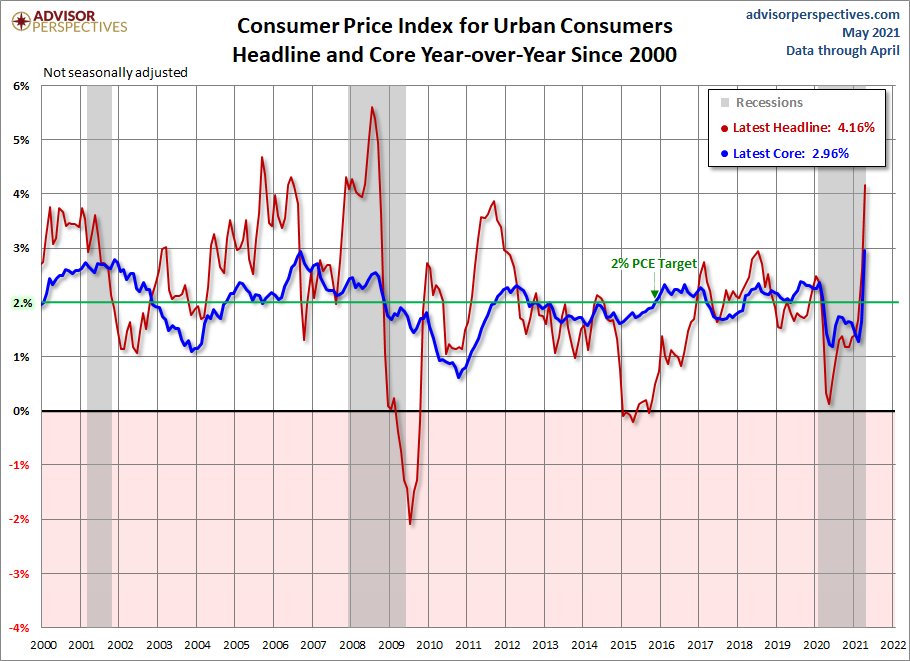
In the 2008 cycle, inflation and commodity prices topped in the second quarter on expectations of insatiable Chinese commodity demand, ditto in 2011 as the post-GFC recovery ran out of steam, 2006 as the US housing bubble burst, and 2000 when Y2K-driven tech spending finally exhausted (see CPI chart below since 2000, courtesy of advisorpersepectives.com).
Although some short-term supply bottlenecks and financial speculation might drive commodity prices and inflation expectations further from here, a few big-picture facts are worth noting.
First, higher prices naturally work to incentivize supply more than demand and therein lie the seeds of mean reversion.
Second, before the pandemic, services account for 67% of personal consumption expenditures in the US (Canada is similar) and goods about 33%.
As the pandemic shut down some services over the past year, the consumption of goods accelerated above the mean as households used government support and low-interest rates to buy a record amount of things. With some 80% of the economy already open today, pent-up demand is now, more than ever, on the services side. Services use a lot fewer commodities than goods production.
The consensus expects consumer spending to keep accelerating because some households have higher savings now than before the pandemic, but household debt to after-tax income ratios suggest another probability.
Before the inflationary cycle of the 1970s, household debt to income ratios averaged about 60% as mortgage and bond rates moved toward 20%. Then in the early 80s, inflation and interest rates finally began to fall, and households surfed that wave all the way down with a borrowing and spending spree that drove US household debt to a record 135% of household income by 2007. Having worked down over the past 14 years to 88% today, American households still have further work in rebuilding their balance sheets toward the long-term mean of 60% on this financial strength and stability metric. Canadian households are, unfortunately, much further behind in the process, with an average debt to income ratio of 171% in the third quarter of 2020 (down from 181% in the fourth quarter of 2019). While the personal savings rate (which includes debt repayments) has risen on government subsidies and payment deferrals over the past year, a sustained period of this is required.
While balance sheet rebuilding is best for households, it’s hard on consumption-dependent economies. GDP growth was mostly driven by household spending in 2020: 67.6% for the US and 56.5% for Canada. Developing and emerging economies are much less driven by domestic consumption, i.e., they depend on exports for western consumption for most economic growth. Chinese consumption, for example, drives just 43% of its economic growth, and that’s higher than most developing economies, where average household incomes are lower.
Aging populations will slow global growth dependent on debt-fuelled consumption in all major economies wanting fewer goods and more savings, along with technologies that allow us to do more while spending less.
But there’s another more imminent reason to suspect inflationary pressures will be short-lived. What’s inflated most in the past decade is asset prices. If history has shown us anything, it’s that extreme asset inflation is always transitory.
Extreme asset prices eventually collapse of their own weight and pull the spending impulse out from underneath highly levered economies (read Robert Frank’s excellent book The High Beta Rich (2011) for a reminder of how and why), and all the central banks and governments in the world are not able to prevent it. Case in point, just the relatively minor sell-off in the S&P 500 over the past couple of weeks evaporated some $950 billion in market value off the balance sheets of asset owners–a little over half of the stimulus spending pledged in the entire American Rescue Plan Act of 2021. This one stat offers a sense of the deflationary powers that a full bear market cycle has in store.