ALWAYS CONSULT YOUR INVESTMENT PROFESSIONAL BEFORE MAKING ANY INVESTMENT DECISION

November 1, 2023 | The Most Splendid Housing Bubbles in America, October Update: 10 of the 20 Metros Down from their Peaks Last Year, 6 Metros Set New Highs

Wolf Richter


We like the S&P CoreLogic Case-Shiller Home Price Index because it’s based on the “sales-pairs method” comparing the sales price of the same house over time, thereby eliminating the issues associated with median price indices (see “Methodology” toward the end of the article). And we like it because it shows the 20 metros it covers in all their individual glory. But we grumble because it lags months behind: Today’s index for “August” is a three-month moving average of home prices whose sales were entered into public records in June, July, and August. That’s the time frame we’re looking at here today.
By contrast, the National Association of Realtors already released its national median-price index for deals that closed in September – an actual national metric, and not just covering 20 cities: It fell for the third month in a row and is down 4.7% from its peak last year (June 2022), making 2023 the first year since the Housing Bust that the seasonal peak in June was below the peak in the prior year.
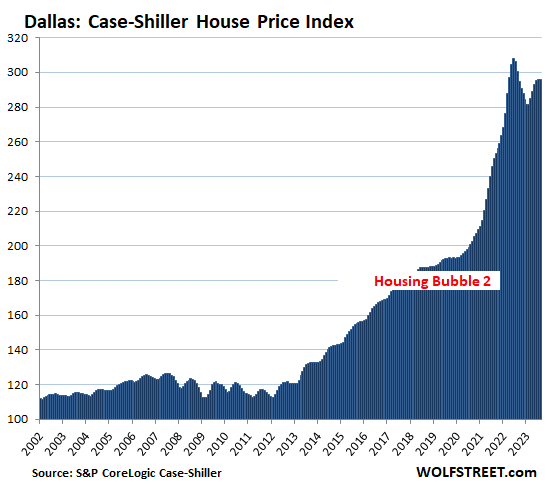
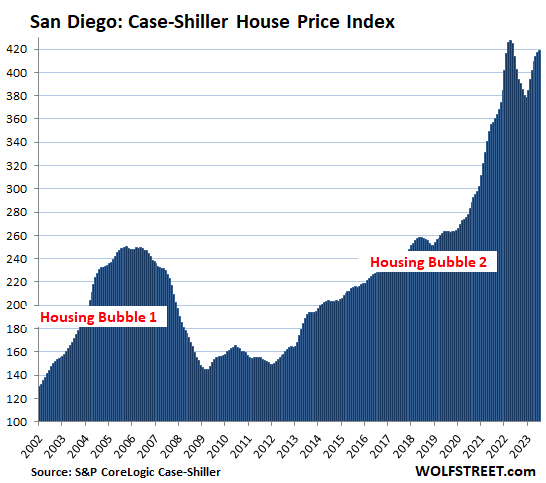
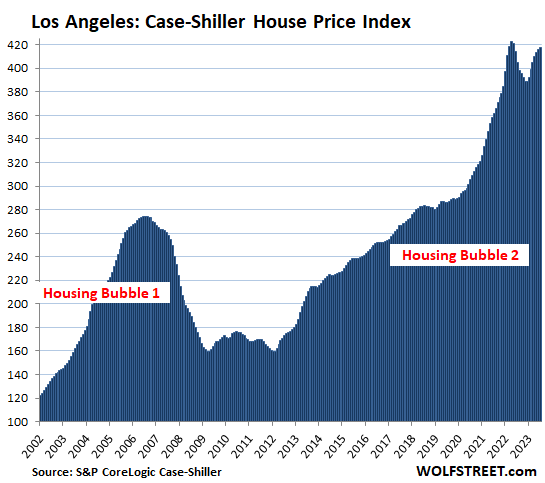
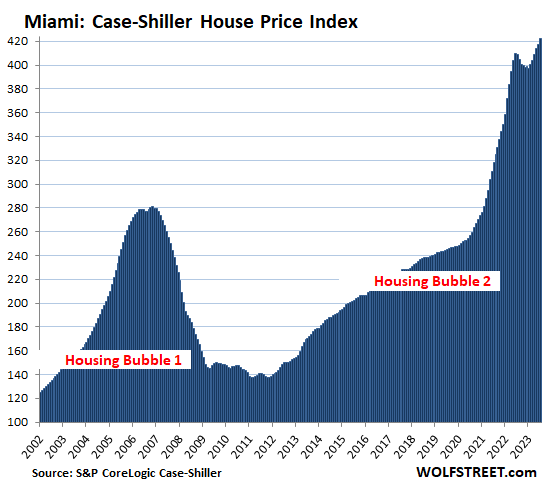
It’s Home-Price Inflation. By measuring how many dollars it takes to buy the same home over time, the Case-Shiller index is a measure of home price inflation. The indices were set at 100 for the year 2000. So today’s index values of 422 for Miami, 419 for San Diego, and 417 for Los Angeles are up respectively by 322%, 319%, and 317% since 2000. Miami is thereby the #1 Most Splendid Housing Bubble in terms of home price inflation since 2000, followed by San Diego and Los Angeles. To be included in this list of the Most Splendid Housing Bubbles, the metro must have experienced a home price inflation since 2000 of at least 180%. Dallas made the cutoff with 195%.
By comparison, Consumer-Price Inflation, which tracks price changes of goods and services that are consumed by, uh, consumers, was 82% over the same period since January 2000, according to the Consumer Price index (my discussion of CPI is here).
So here we go with the numbers from the S&P CoreLogic Case-Shiller Home Price Index…
Prices are below their 2022 peaks in 10 of the 20 metros in the index (% from peak):
- San Francisco Bay Area: -11.2%
- Seattle: -9.9%
- Las Vegas: -6.2%
- Phoenix: -6.1%
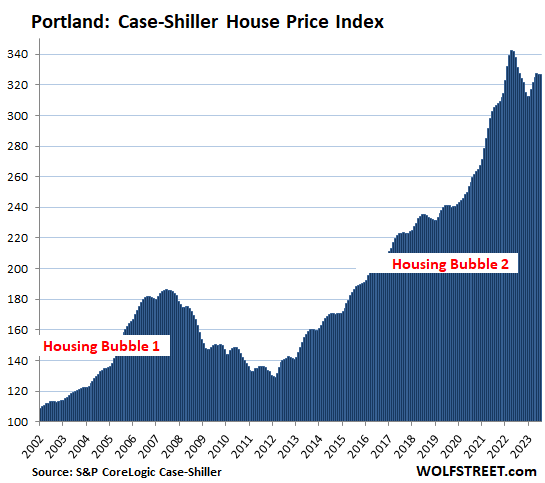
- Portland: -4.6%
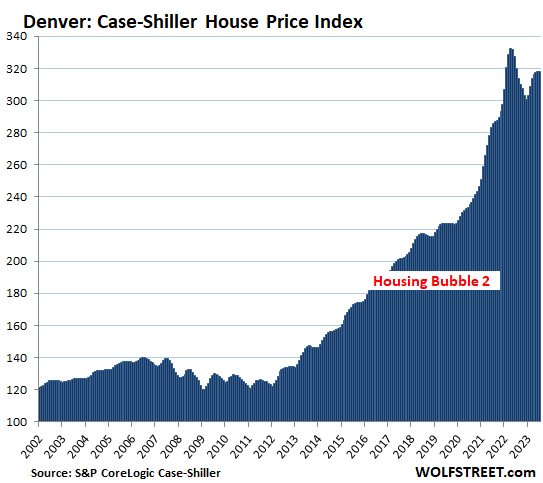
- Denver: -4.3%
- Dallas: -4.0%
- San Diego: -2.0%
- Los Angeles: -1.3%
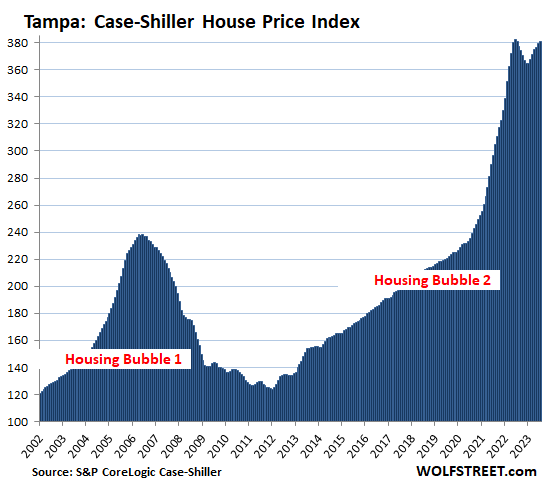
- Tampa: -0.4%
Prices set new highs in 6 of the 20 metros in the index (% year-over-year):
- New York: +5.0%
- Detroit: +4.8%
- Atlanta: +3.4%
- Miami: +3.3%
- Charlotte: +3.0%
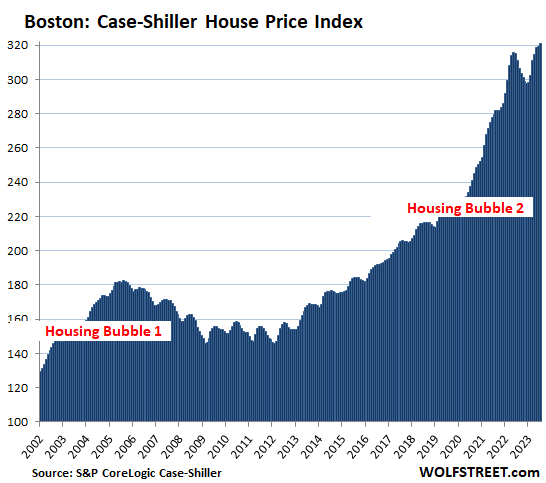
- Boston: +3.1%
The most splendid housing bubbles by metro.
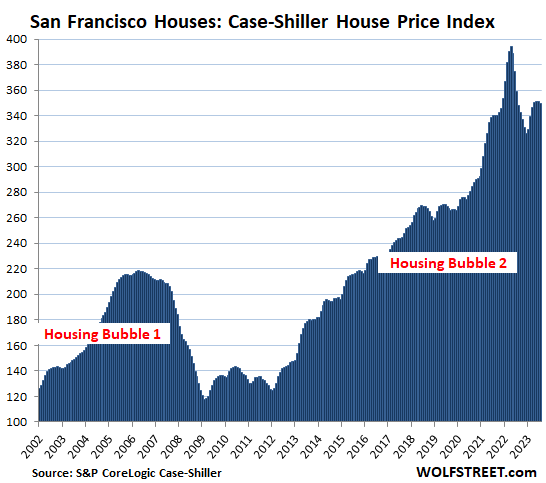
San Francisco Bay Area:
- Month to month: -0.5%
- Year over year: -2.5%, the 10th month of year-over-year declines
- From the peak in May 2022: -11.2%.
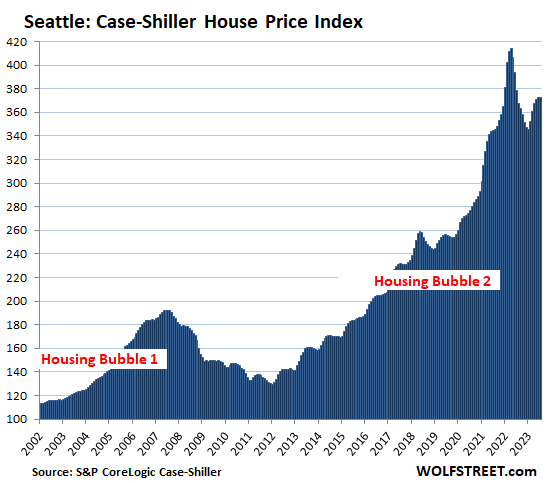
Seattle metro:
- Month to month: +0.2%.
- Year over year: -1.5%.
- From the peak in May 2022: -9.9%.
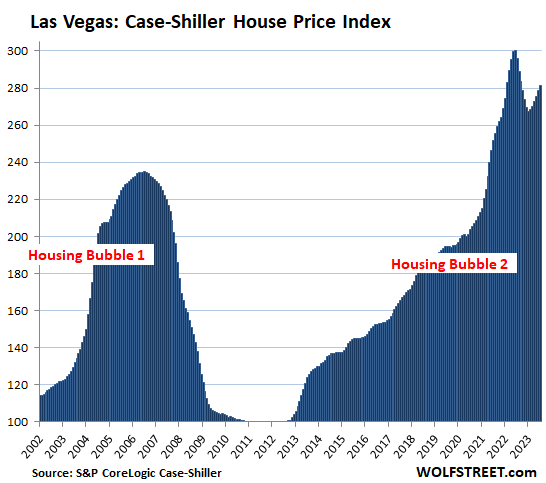
Las Vegas metro:
- Month to month: +1.1%.
- Year over year: -4.9%.
- From the peak in July 2022: -6.2%.
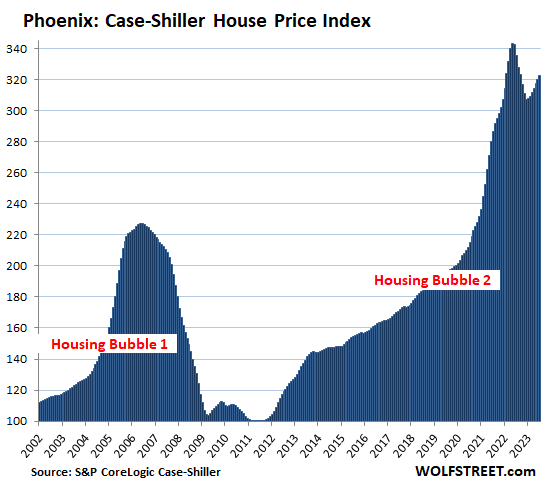
Phoenix metro:
- Month to month: +0.7%.
- Year over year: -3.9%.
- From the peak in June 2022: -6.1%.
Denver metro:
- Month to month: -0.1%.
- Year over year: -0.6%.
- From the peak in May 2022: -4.3%.
Portland metro:
- Month to month: -0.1%.
- Year over year: -1.5%.
- From the peak in May 2022: -4.6%.
Dallas metro:
- Month to month: -0.2%.
- Year over year: -1.7%.
- From the peak in June 2022: -4.0%.
San Diego metro:
- Month to month: +0.6%.
- Year over year: +4.1%.
- From the peak in May 2022: -2.0%.
Los Angeles metro:
- Month to month: +0.5%.
- Year over year: +3.2%.
- From the peak in May 2022: -1.3%.
Tampa metro:
- Month to month: +0.4%.
- Year over year: no change.
- From peak in July 2022: -0.4%
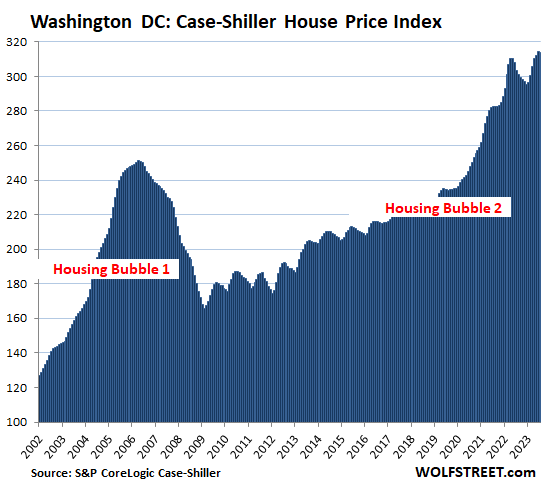
Washington D.C. metro:
- Month to month: -0.1%.
- Year over year: +3.4%.
- From high in July 2023: -0.1%
Boston metro:
- Month to month: +0.6%.
- Year over year: +3.1%.
- Set new high.
Miami metro:
- Month to month: +1.2%
- Year over year: +3.3%.
- Set new high.
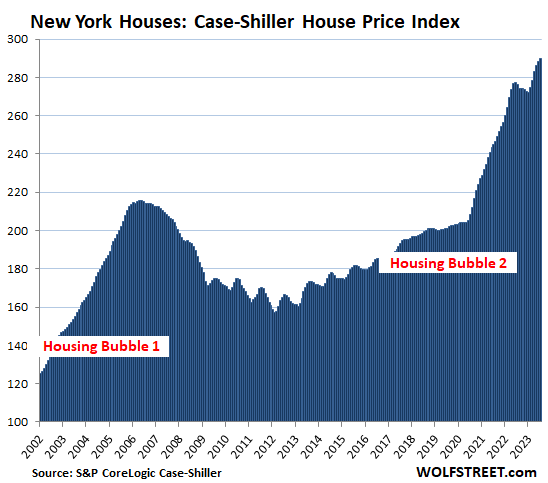
New York metro:
- Month to month: +0.5%.
- Year over year: +5.0%.
- Set new high.
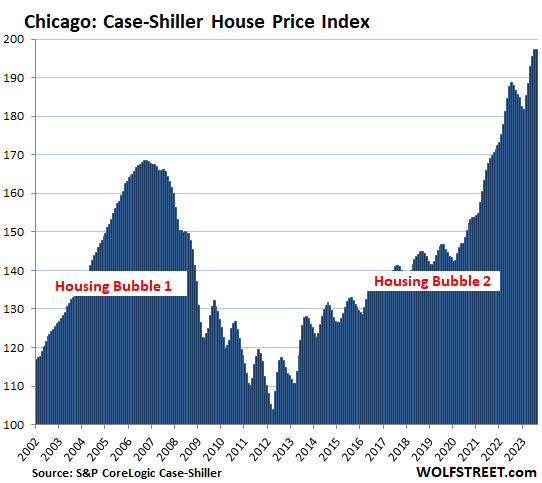
The remaining 6 of the 20 markets in the Case-Shiller index (Chicago, Charlotte, Minneapolis, Atlanta, Detroit, and Cleveland) had far less house price inflation since 2000, and don’t qualify for this list of the Most Splendid Housing Bubbles. But in 2022 and 2023, these metros were the ones with the biggest home price increases in percentage terms even as prices have fallen or flattened out in the expensive markets.
Methodology. The Case-Shiller Index uses the “sales pairs” method, comparing sales in the current month to when the same houses sold previously. The price changes are weighted based on how long ago the prior sale occurred, and adjustments are made for home improvements and other factors. This “sales pairs” method makes the Case-Shiller index a more reliable indicator than median price indices, but it lags months behind (37-page methodology).
The Chicago metro doesn’t qualify for this list, with an index value of 197, which is up by “only” 97% from 2000, and 93 points below the lowest-ranked metro of the Most Splendid Housing Bubbles, New York (index value = 290). But here it is anyway:
- Month to month: unchanged at high set in prior month
- Year over year: +5.0%.
STAY INFORMED! Receive our Weekly Recap of thought provoking articles, podcasts, and radio delivered to your inbox for FREE! Sign up here for the HoweStreet.com Weekly Recap.
Wolf Richter November 1st, 2023
Posted In: Wolf Street