ALWAYS CONSULT YOUR INVESTMENT PROFESSIONAL BEFORE MAKING ANY INVESTMENT DECISION

May 1, 2024 | The Most Splendid Housing Bubbles in America amid the Now-Fizzled Rate-Cut Mania & Erstwhile Plunge in Mortgage Rates

Wolf Richter


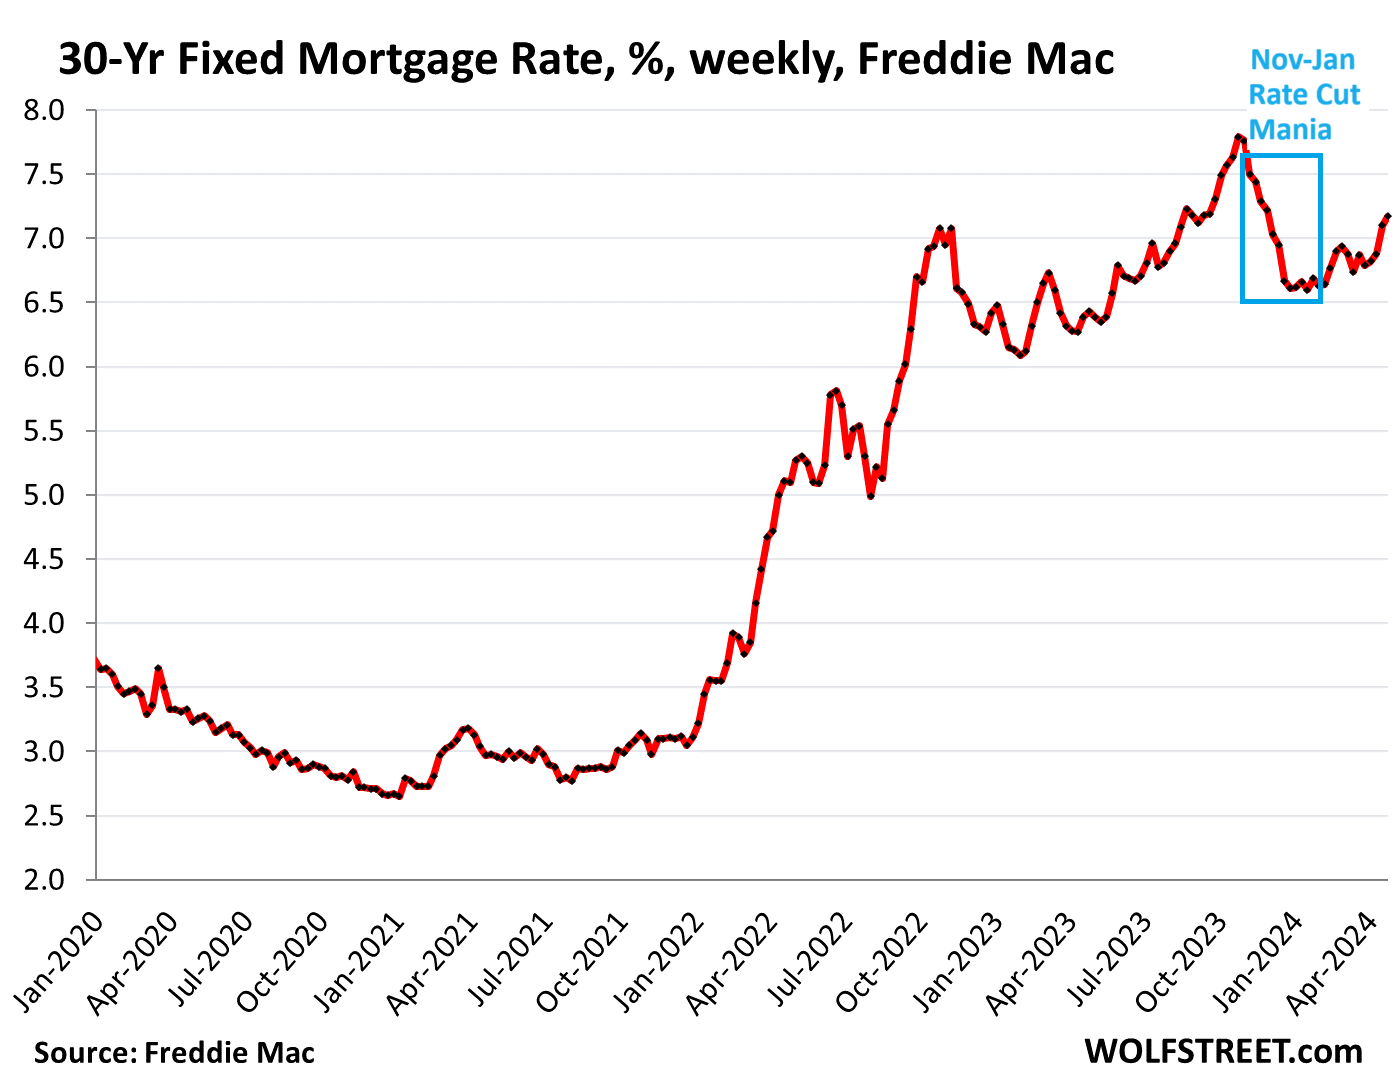
The brief and now bygone era of Rate-Cut Mania. Today’s S&P CoreLogic Case-Shiller Home Price Index, dubbed “February,” is a three-month moving average of home prices whose sales were entered into public records in December, January, and February. Today’s data therefore reflects Rate-Cut Mania that lasted from the beginning of November until February 13, when the Consumer Price Index showed with brutal frankness that inflation was rearing its ugly head again.
During Rate-Cut Mania, the average 30-year fixed mortgage rate plunged from 7.8% at the end of October to the 6.6% range through February 13. That’s when the CPI report ended Rate-Cut Mania, and mortgage rates began to rise again, as Fed heads fanned out to explain with that patience of the exasperated that the six rate cuts markets were seeing for 2024 were delusional. And inflation has gotten worse every month since then. Rate-cut hopes for 2024 got dialed back bit by bit, and by now, a no-rate-cuts-in-2024 scenario has cropped up.
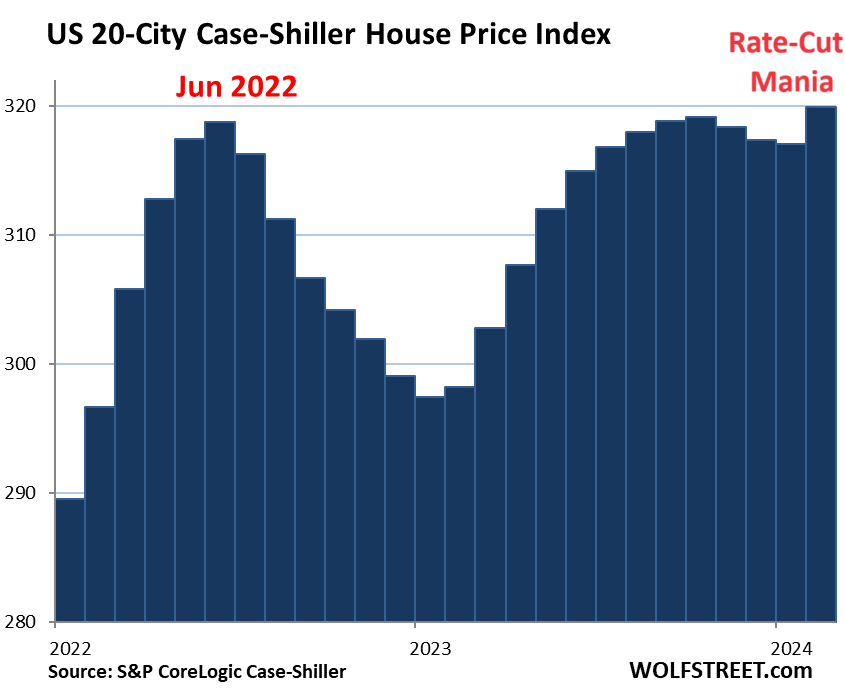
The daily measure of 30-year fixed mortgage rates by Mortgage News Daily rose to 7.51% today. The weekly measure by Freddie Mac last week rose to 7.17%. What the Case-Shiller Home Price Index reported today occurred in the blue box:
0.4% higher than in June 2022. Today’s Case-Shiller Home Price Index for the 20 metros it covers jumped by 0.9% in the December-through-February period from the November-through-January period, eking out a new high, by being 0.4% higher than in June 2022. In the year-over-year comparison to the trough a year ago, the index rose 7.3%:
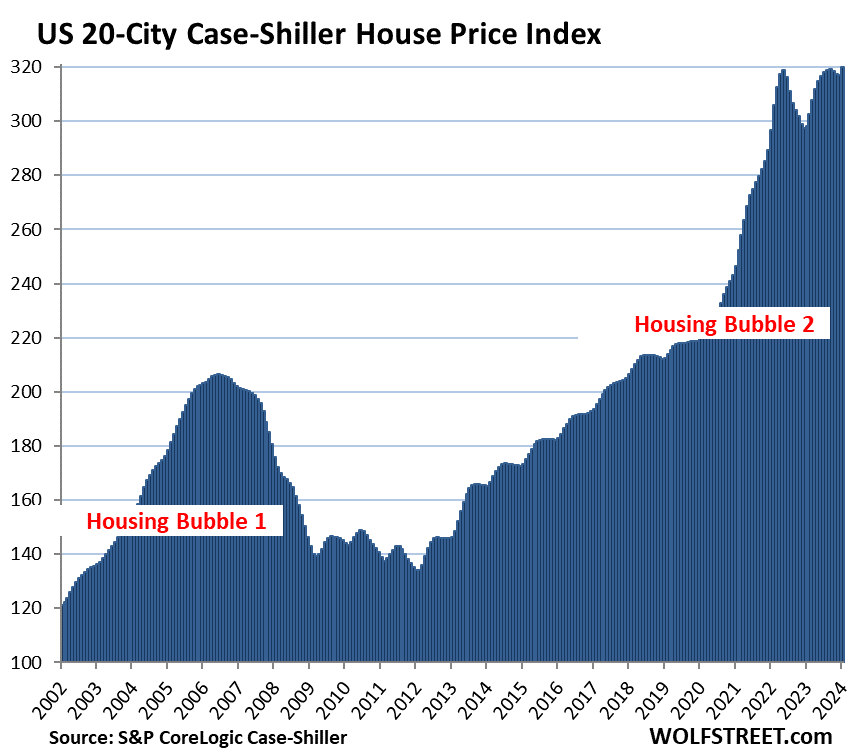
The long view of the 20-Cities Index depicts the mind-blowing surge through June 2022, the bizarre non-seasonal double top that has never occurred in the history of the index, with the first top in June 2022 and the second top in October 2023, and now this Rate-Cut Mania thingy:
Prices were below their 2022 peaks in 7 metros, of the 20 in the Case-Shiller index. Two metros that had been on this list surpassed their 2022 high by a hair and thereby came off this below-2022-peak list: San Diego, 0.1% higher than May 2022; and Los Angeles, 0.7% higher than May 2022.
The list shows the 7 metros, of the 20 in the index, that were below their respective peak in 2022 (month of peak):
- San Francisco Bay Area: -12% (May 2022)
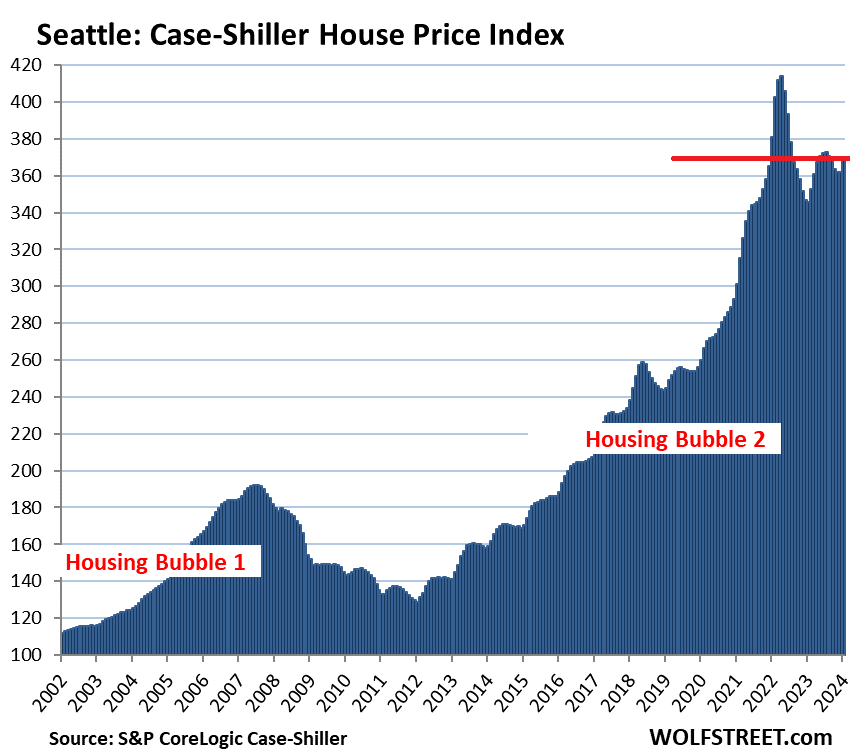
- Seattle: -10.6% (May 2022)
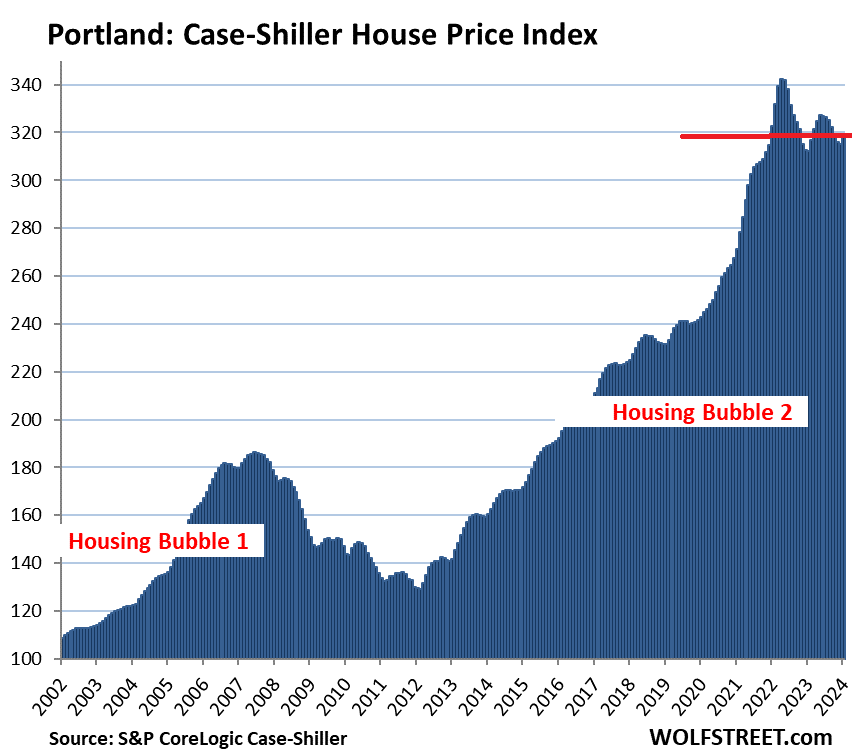
- Portland: -6.8% (May 2022)
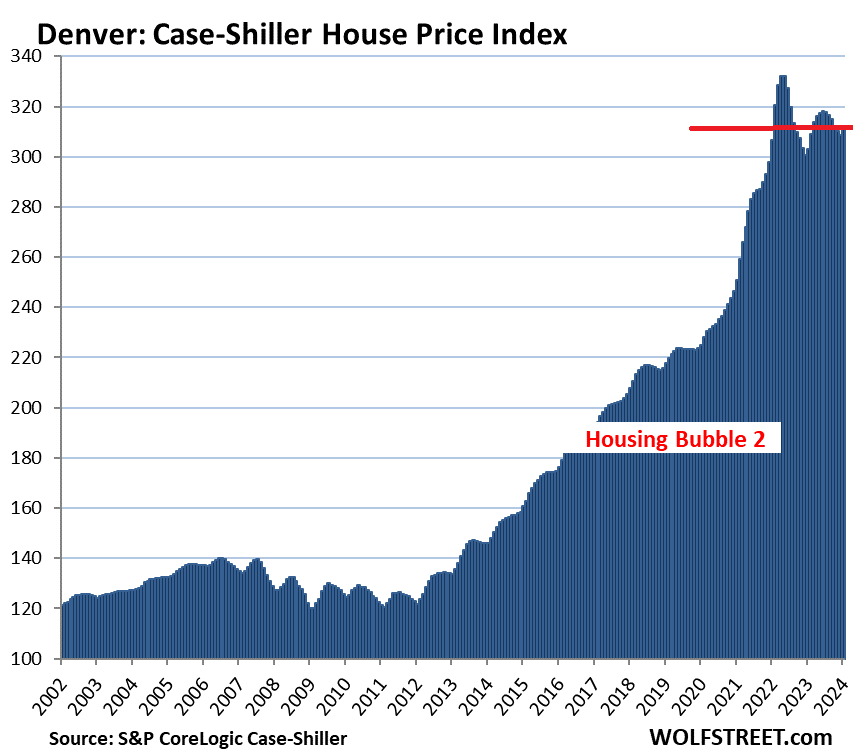
- Denver: -6.3% (May 2022)
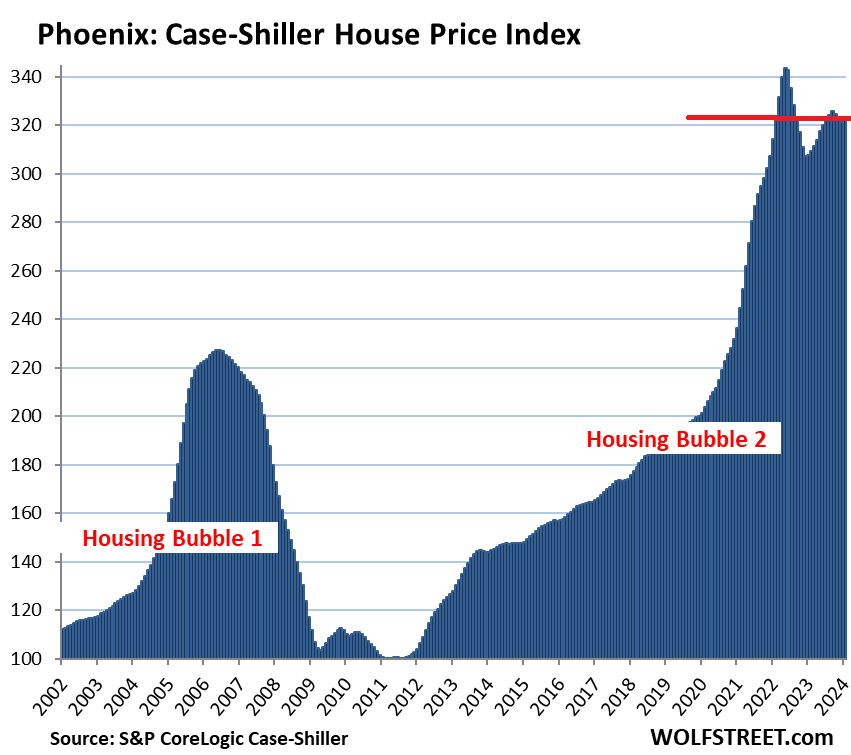
- Phoenix: -6.0% (June 2022)
- Dallas: -5.3% (June 2022)
- Las Vegas: -4.5% (July 2022)
Month-to-month: The only two metros, of the 20 in the index, that had a month-to-month decline were Tampa and Cleveland. Miami was about flat for the month.
The remaining cities had month-to-month increases, some of them big ones. The biggest month-to-month increase occurred in Seattle (+2.3%), which left it 10.6% below its May 2022 peak.
The most splendid housing bubbles by metro.
San Francisco Bay Area single family houses: the San Francisco metro in the Case-Shiller Index covers a five-county portion of the nine-county Bay Area (San Francisco, San Mateo, Contra Costa, Alameda, and Marin).
- Month to month: +1.7%
- Year over year: +5.7%. From two years ago: -5.5%
- From the peak in May 2022: -12.0%.

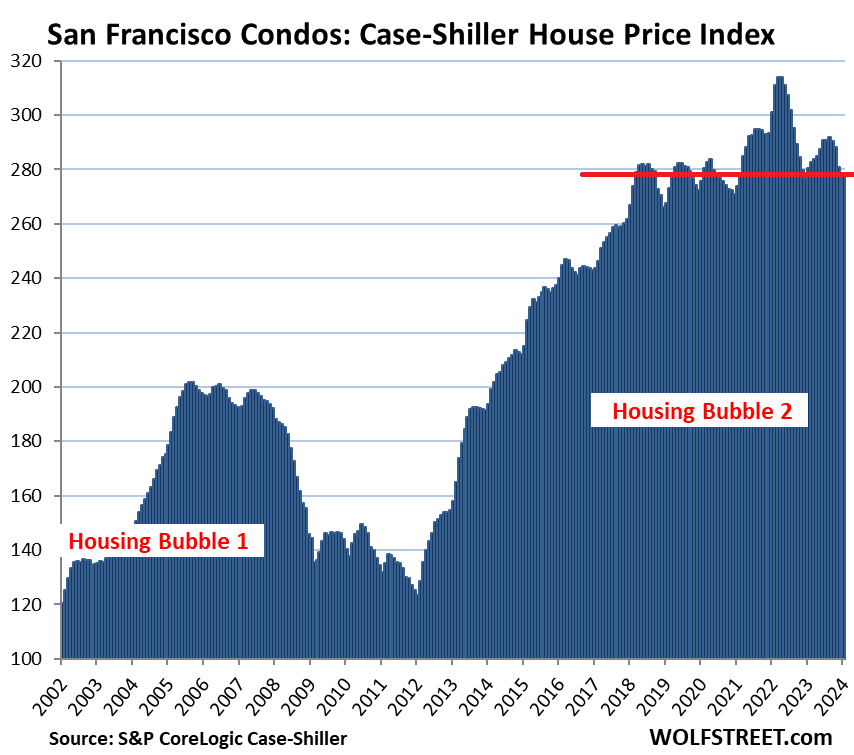
San Francisco Bay Area condos: Condos are a big part of the market in the Bay Area. In San Francisco itself, they dominate the market (data for a five-county portion of the Bay Area).
- Month to month: +0.2%.
- Year over year: -1.0%. From 2 years ago: -7.8%.
- From the peak in May 2022: -11.5%.
- Back to April 2018.
Seattle metro:
- Month to month: +2.3%.
- Year over year: +7.1%. From two years ago: -2.9%.
- From the peak in May 2022: -10.6%.
Portland metro:
- Month to month: +1.2%.
- Year over year: +2.2%. From two years ago: -1.2%
- From the peak in May 2022: -6.8%.
Las Vegas metro:
- Month to month: +0.6%.
- Year over year: +7.3%.
- From the peak in July 2022: -4.4%.

Denver metro:
- Month to month: +0.9%.
- Year over year: +2.7%.
- From the peak in May 2022: -6.3%.
Phoenix metro:
- Month to month: +0.5%.
- Year over year: +4.9%.
- From the peak in June 2022: -6.0%.
Dallas metro:
- Month to month: +0.6%.
- Year over year: +3.5%.
- From the peak in June 2022: -5.3%.

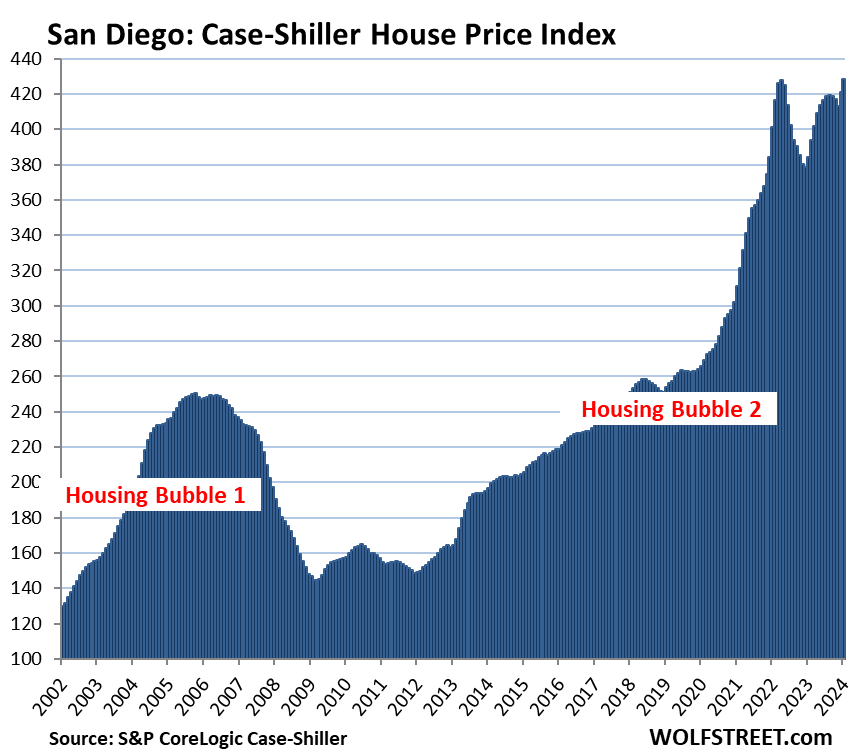
San Diego metro:
- Month to month: +1.7%.
- Year over year: +11.4%.
- Now 0.1% above the prior high in May 2022.

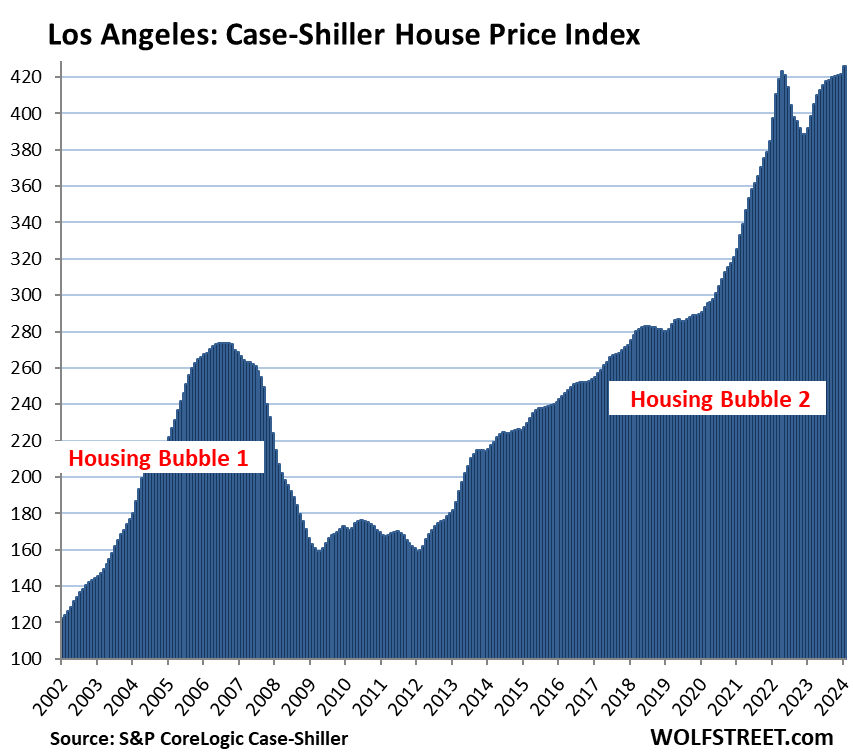
Los Angeles metro
- Month to month: +1.1%.
- Year over year: +8.7%.
- Now 0.7% above the prior high in May 2022.
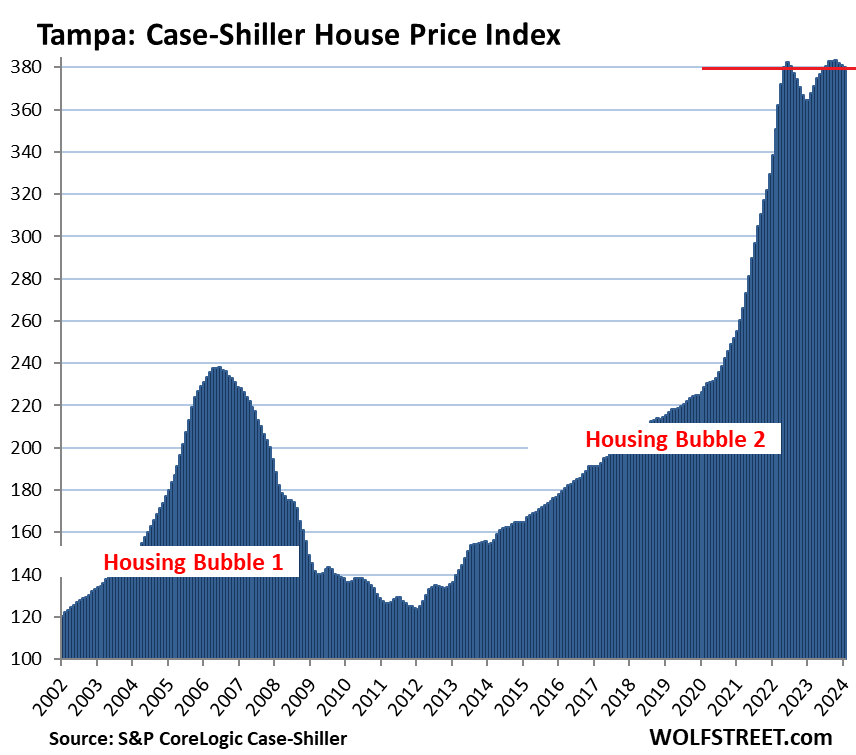
Tampa metro:
- Month to month: -0.3%, back to May 2022.
- Year over year: +4.3%.
- From high in November 2023: -0.8%.

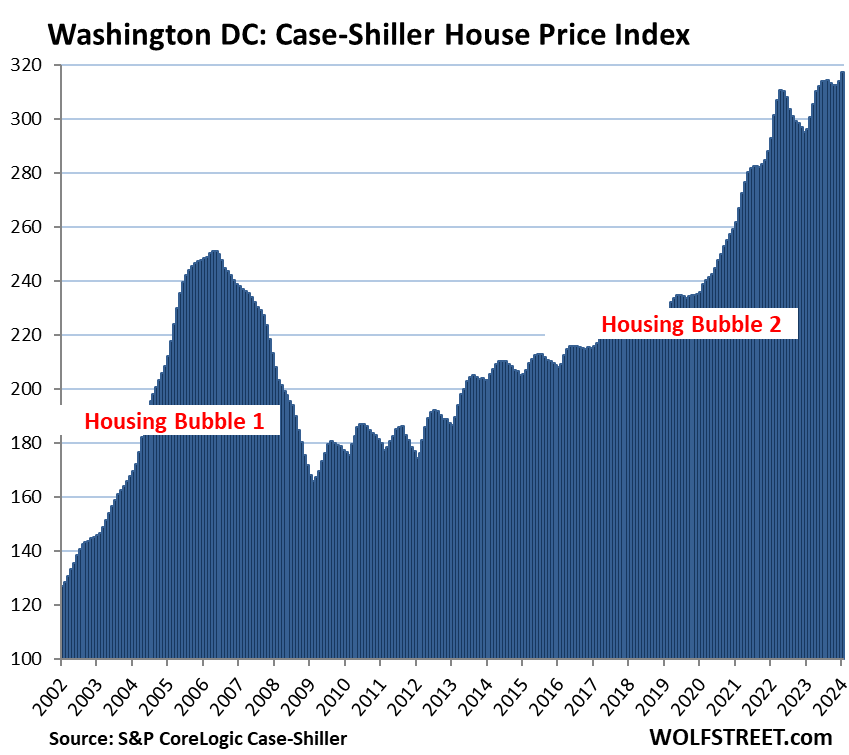
Washington D.C. metro:
- Month to month: +1.1%.
- Year over year: +7.1%.
- Set new high.
Boston metro:
- Month to month: +1.0%.
- Year over year: +8.0%.
- From high in October 2023: -0.5%.

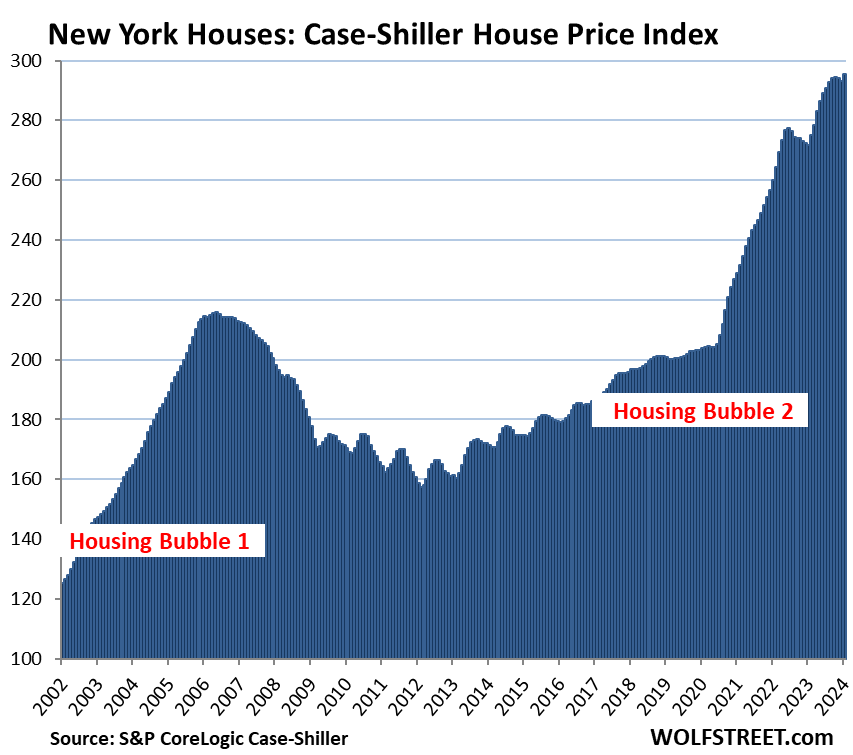
New York metro:
- Month to month: 0.8%.
- Year over year: +8.7%.
- Set new high.
Miami metro:
- Month to month: +0.1%, essentially unchanged for three months.
- Year over year: +8.0%.
- A hair below the high set in December 2023.
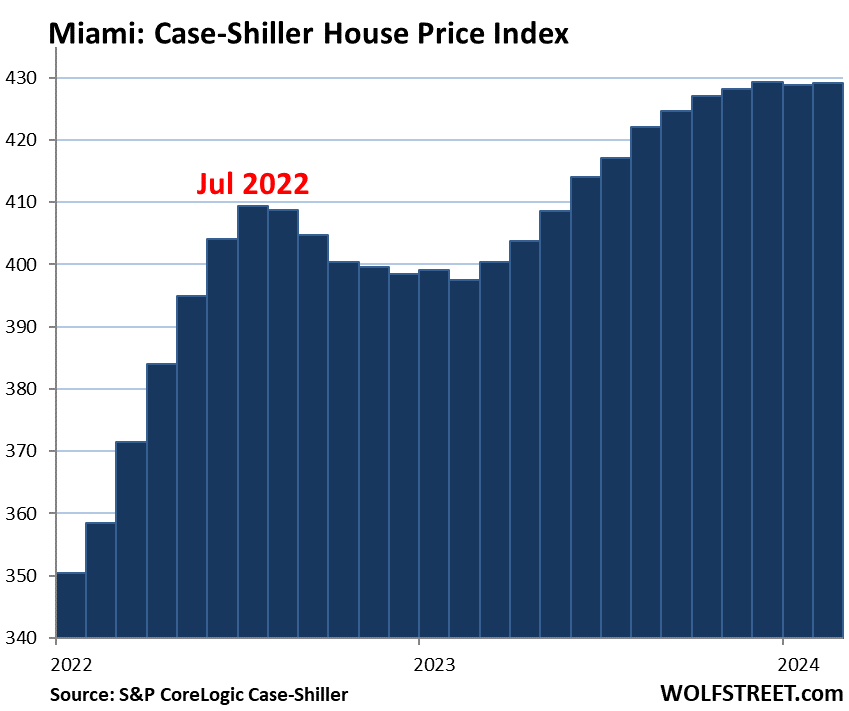

To qualify for the Most Splendid Housing Bubbles, the metro must have experienced home-price inflation since 2000 of at least 180%. The indices were set at 100 for the year 2000. Today’s index value for Miami of 429 is up 329% since 2000, making Miami the most splendid housing bubble on this list, a hair ahead of San Diego and Los Angeles.
The remaining 6 of the 20 metros in the Case-Shiller index (Chicago, Charlotte, Minneapolis, Atlanta, Detroit, and Cleveland) had less home-price inflation than 180% since 2000, despite the price spikes in recent years.
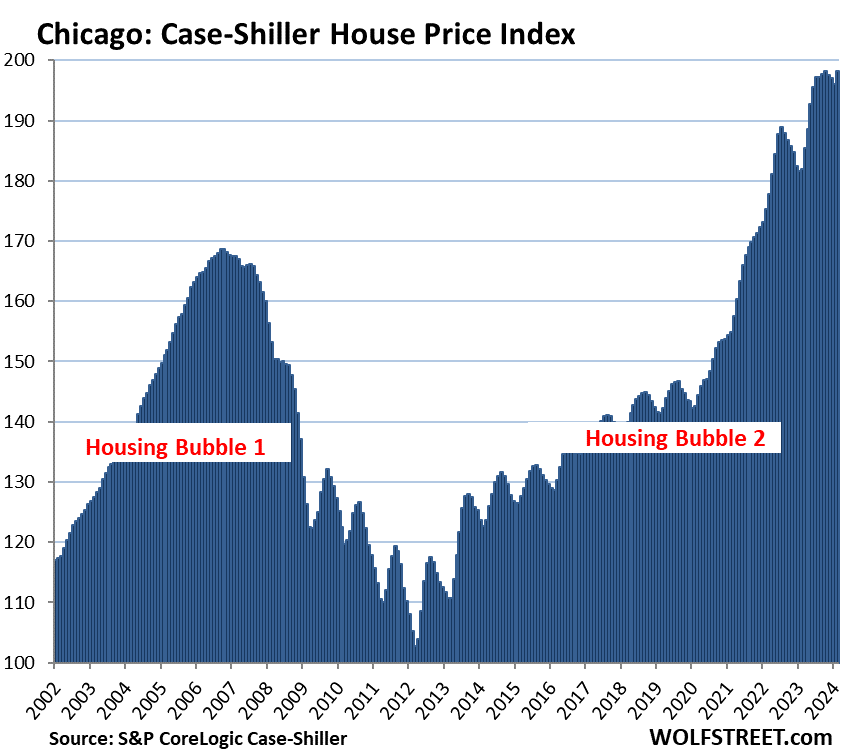
Chicago, with an index value of 198 is up by 98% from 2000, and therefore far from qualifying for this list of the Most Splendid Housing Bubbles. But since March 2020, house prices spiked by 37% into the blue sky, and so here is Chicago anyway:
- Month to month: +1.0%
- Year over year: +8.9%.
- Down a hair from the high in October 2023.
Methodology. The Case-Shiller Index uses the “sales pairs” method, comparing sales in the current month to when the same houses were sold previously. The price changes are weighted based on how long ago the prior sale occurred, and adjustments are made for home improvements and other factors. This “sales pairs” method makes the Case-Shiller index a more reliable indicator than median price indices (37-page methodology).
Home-Price Inflation. By measuring how many dollars it takes to buy the same house over time via the “sales pairs” method, the Case-Shiller index is a measure of home-price inflation. Miami had 329% home price inflation since 2000, while the Consumer Price Index, which tracks price changes of consumer goods and services, rose 85% over the same period.
STAY INFORMED! Receive our Weekly Recap of thought provoking articles, podcasts, and radio delivered to your inbox for FREE! Sign up here for the HoweStreet.com Weekly Recap.
Wolf Richter May 1st, 2024
Posted In: Wolf Street
Next: Jerome Powell on Stagflation »