ALWAYS CONSULT YOUR INVESTMENT PROFESSIONAL BEFORE MAKING ANY INVESTMENT DECISION

December 20, 2023 | Here Come the New Listings of Existing Homes, Prices Drop Further, Demand Remains at Collapsed Levels

Wolf Richter


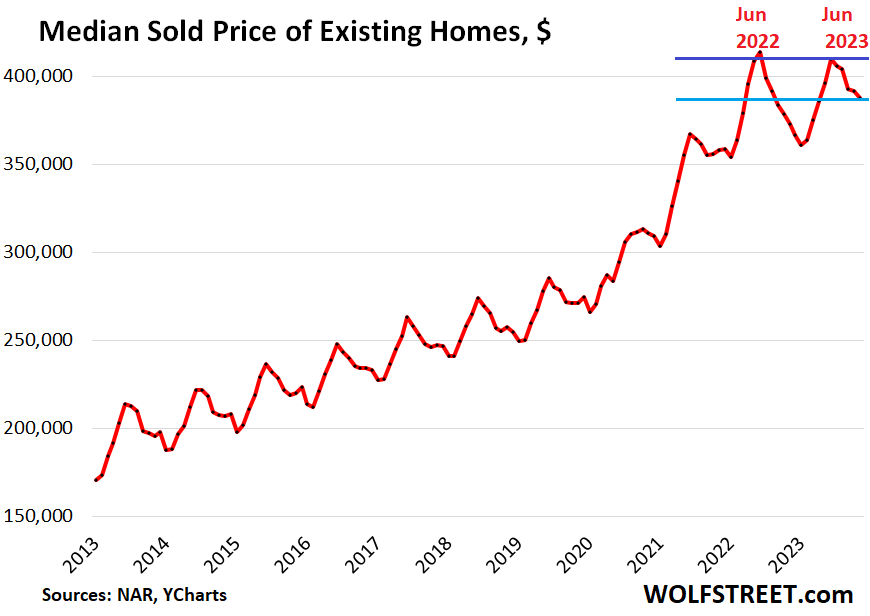
The national median price of existing single-family houses, condos, and co-ops whose sales closed in November dropped to $387,600, down by 6.3% from the peak in June 2022, according to data from the National Association of Realtors (NAR) today.
2023 is the first year since the Housing Bust when the seasonal high in June was below the all-time high a year earlier. In other words, June 2023 was the first “lower high” since the Housing Bust (purple line in the chart) and prices have dropped further since June along seasonal patterns (historic data via YCharts):
Prices of new houses, sold by homebuilders, have already dropped 18% from the peak a year ago, as builders aggressively target the new reality with lower prices, smaller houses, “de-amenitizing” spec houses (cheaper appliances, countertops, etc.), and big mortgage-rate buydowns, thereby successfully competing with homeowners selling their existing homes (which we discussed here).
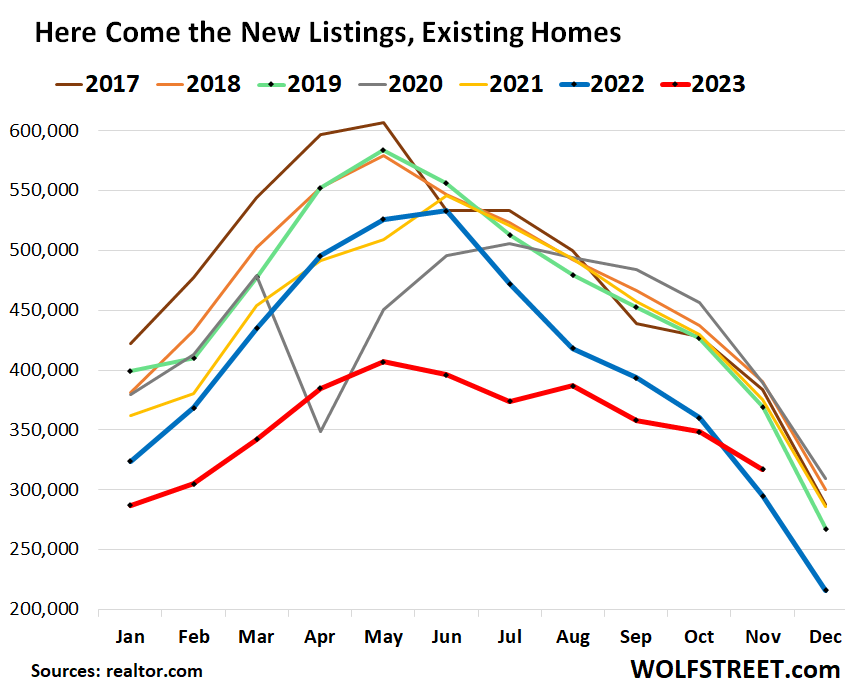
The New Listings are coming out of the woodwork.
New listings of existing homes normally drop after the spring selling season and plunge going into the holidays.
But in November, new listings fell by only 22,000 to a total of 316,900; while a year ago, they plunged by 65,280 over the same period. Between 2017 and 2022, they dropped on average by 56,000 over the same period, according to data from Realtor.com. They’d also risen in August, when they normally drop. And in the other months of the second half, they barely dipped, when they normally drop sharply.
So in November, new listings (red line) were higher year-over-year for the first time since May 2022 (blue line). This is a good sign for inventory of vacant homes that is now slowly starting to come out of the woodwork.
When an existing homeowner buys another home because of a move or trying to upgrade or downgrade, they also have a then vacant home that they moved out of. Normally they would sell the vacant home. So they take one home off the market (the one they bought) and they put one home on the market (the one they’re trying to sell). So this creates one new listing and one sale, and the impact on inventory overall = +1 -1 = 0.
First-time buyers change the equation, taking one home off the market without putting another home on the market.
And other situations change the equation the other way, putting a home on the market without taking a home off the market such as: new home construction, or when a homeowner moves into a rental, moves into a long-term care facility, dies, moves overseas, etc.
But during the pandemic-era price spike, many homeowners decided to hang on to their newly vacant homes to benefit from the price spike all the way to the top. But the price spike ended in 2022. So we’ve seen vacant homes show up on the rental market, only to be withdrawn, and we’ve seen them show up in the vacation rental market, as homeowners attempt to cover their mortgage payments and other carrying costs, but landlording and vacation rentals are not always easy. And now we’re seeing some of these vacant homes show up as new listings.
Active listings rose to 754,800 homes, the highest since August 2020, squeaking by last year’s high. During normal seasonal patterns before the pandemic, active listings would fall in October and November. Slowly but surely.
Active listings are inventory minus homes listed as “sale pending” (data via realtor.com):
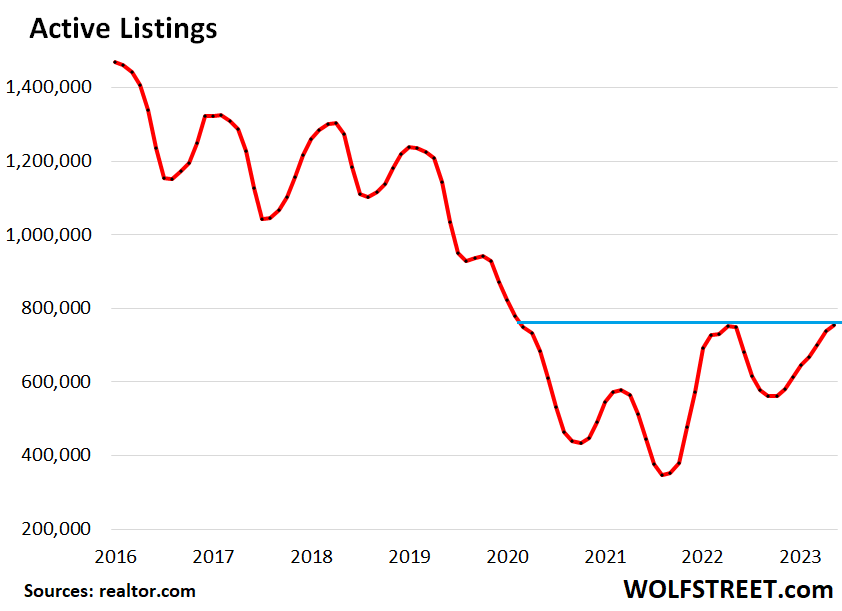
Inventory for sale, at 1.13 million homes, was up 1% year-over-year, and the first year-over-year increase since April.
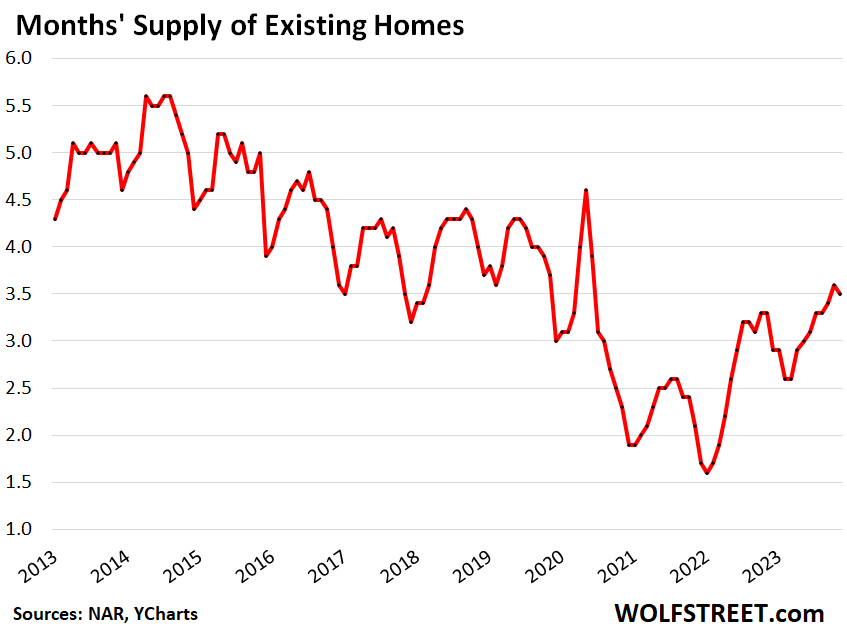
Months’ supply dipped to 3.5 months from 3.6 months in October. Both are the highest since June 2020. Supply in 2017 through 2019 ranged between 3.0 and 4.3 months (historic data via YCharts).
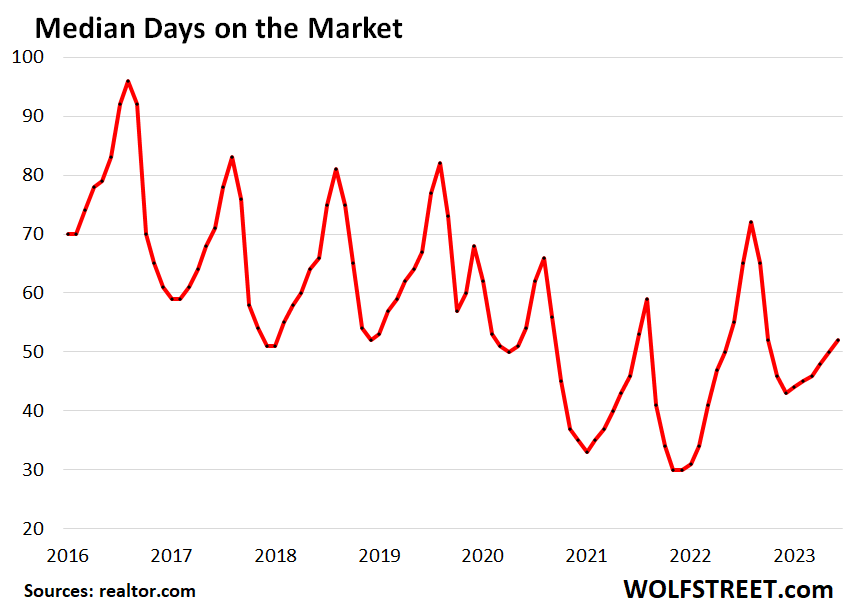
Median days on the market rose to 52 days in November before the homes were either sold or pulled off the market, the highest since March, according to data from realtor.com. This metric reflects in part how quickly sellers pull their listings back off the market when they don’t get the hoped-for response:
Demand remains at collapsed levels.
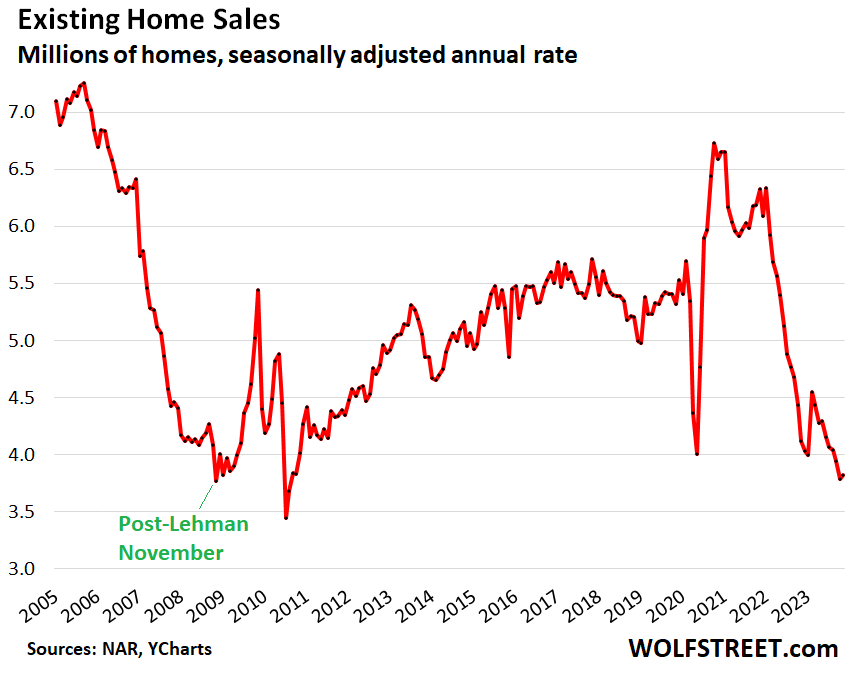
Sales of existing homes ticked up a smidge to a seasonally adjusted annual rate of 3.82 million in November from the collapsed levels in October, which had been the lowest since the worst three months of the Housing Bust in November in 2008 (matched it) and July and August 2010.
Sales compared to prior Novembers (historic data via YCharts):
- From 2022: -7.3%.
- From 2021: -39.7%.
- From 2019: -28.2%.
- From 2018: -26.7%.
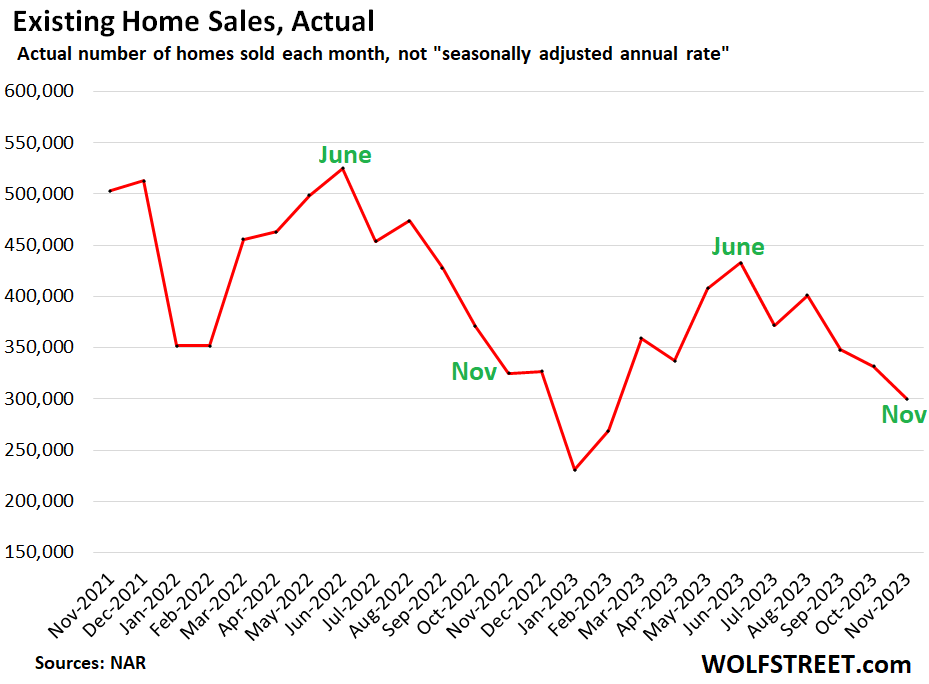
Actual sales – not the seasonally adjusted annual rate – fell further, to 300,000 homes.
Seasonally, January and February mark the low months of the year in terms of closed sales. Sales that closed in those two months reflect the lull in activity over the holidays. June is usually when closed sales peak, reflecting the end of “spring selling season” in the prior months. During the second half of the year closed sales decline (data via NAR):
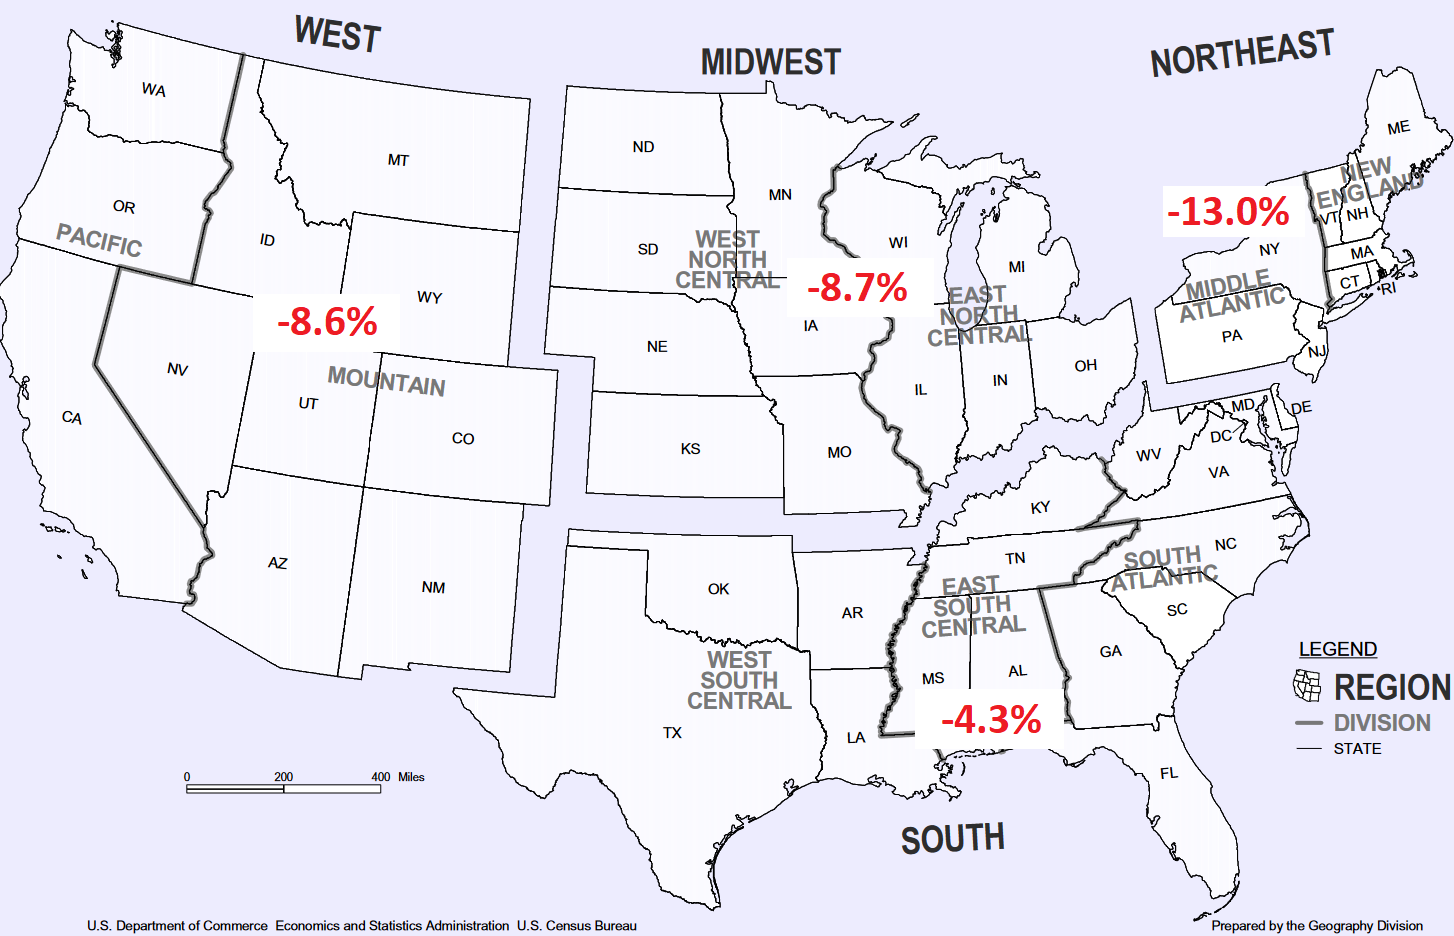
Sales changes by region, % change year-over-year, from the beaten-down levels last year:
STAY INFORMED! Receive our Weekly Recap of thought provoking articles, podcasts, and radio delivered to your inbox for FREE! Sign up here for the HoweStreet.com Weekly Recap.
Wolf Richter December 20th, 2023
Posted In: Wolf Street
Next: Going Down »