ALWAYS CONSULT YOUR INVESTMENT PROFESSIONAL BEFORE MAKING ANY INVESTMENT DECISION

August 23, 2023 | Home Sales Plunge Further as Demand Vanished at these Prices. Even Cash Buyers Pull Back. Supply Keeps Rising

Wolf Richter


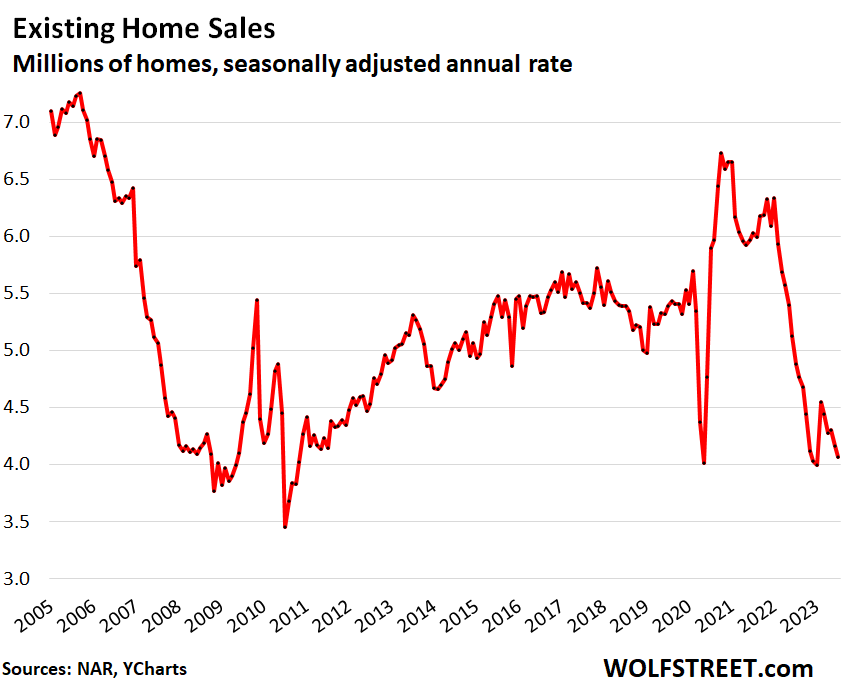
Sales of previously owned homes (houses, condos, and co-ops) fell further, by 2.2% in July from June, to a deep-dismal seasonally adjusted annual rate of sales of 4.07 million, the lowest since January, which had matched the March 2020 lockdown low, which had been the lowest since the Housing Bust in 2010, even as the median price fell, as days on the market rose, and as supply rose to match the highs in 2022, and beyond that to the most supply since June 2020, according to the National Association of Realtors today.
Year-over-year, the seasonally adjusted annual rate of sales fell by 16.6%. Compared to the Julys in prior years:
- July 2021: -32.5%.
- July 2019: -24.5%.
- July 2018: -24.5%.
What we’re seeing is that demand has vanished, and supply has vanished in equal measure because the homeowners who have a 3% mortgage are not buying a new home, and so they have vanished as buyers; and are therefore not putting their current home on the market, and so have they vanished as sellers. I estimated that the entire housing market – buyers and sellers – shrank by 20% because these homeowners vanished as buyers and sellers at the same time. In other words, there is less churn and increasing supply from other sources (historic data via YCharts).
This drop in demand is further documented by the plunge in mortgage applications, indicating that closed sales for August, when reported a month from now, will look even worse than those in July, reported today.
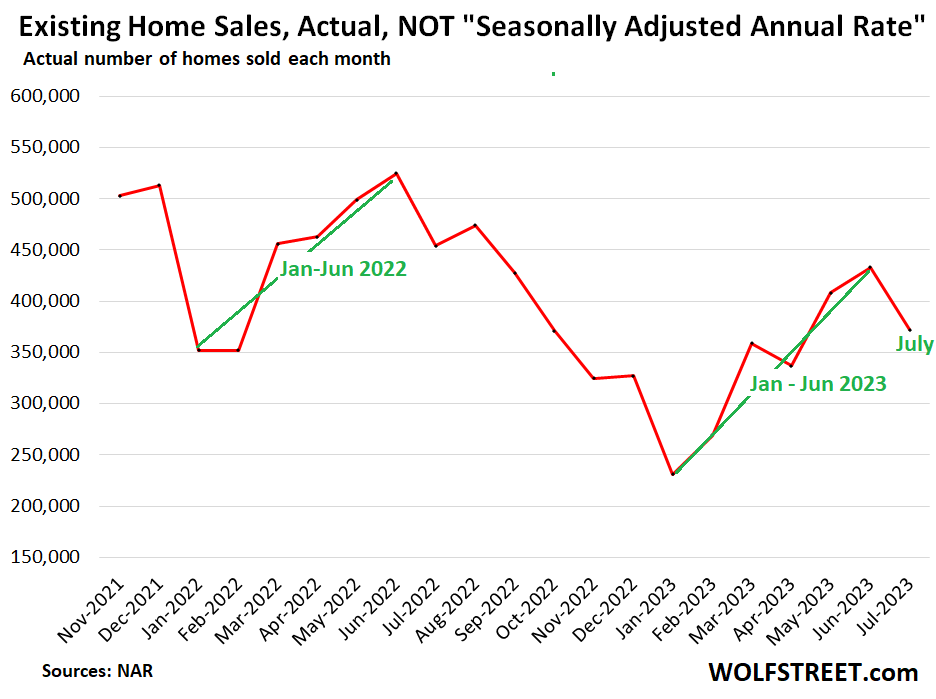
Actual sales in July – not seasonally adjusted annual rate – fell 18.1% year-over-year to 372,000 homes. The seasonal patterns are clear, the “spring selling season,” marked in green is over (data via NAR):
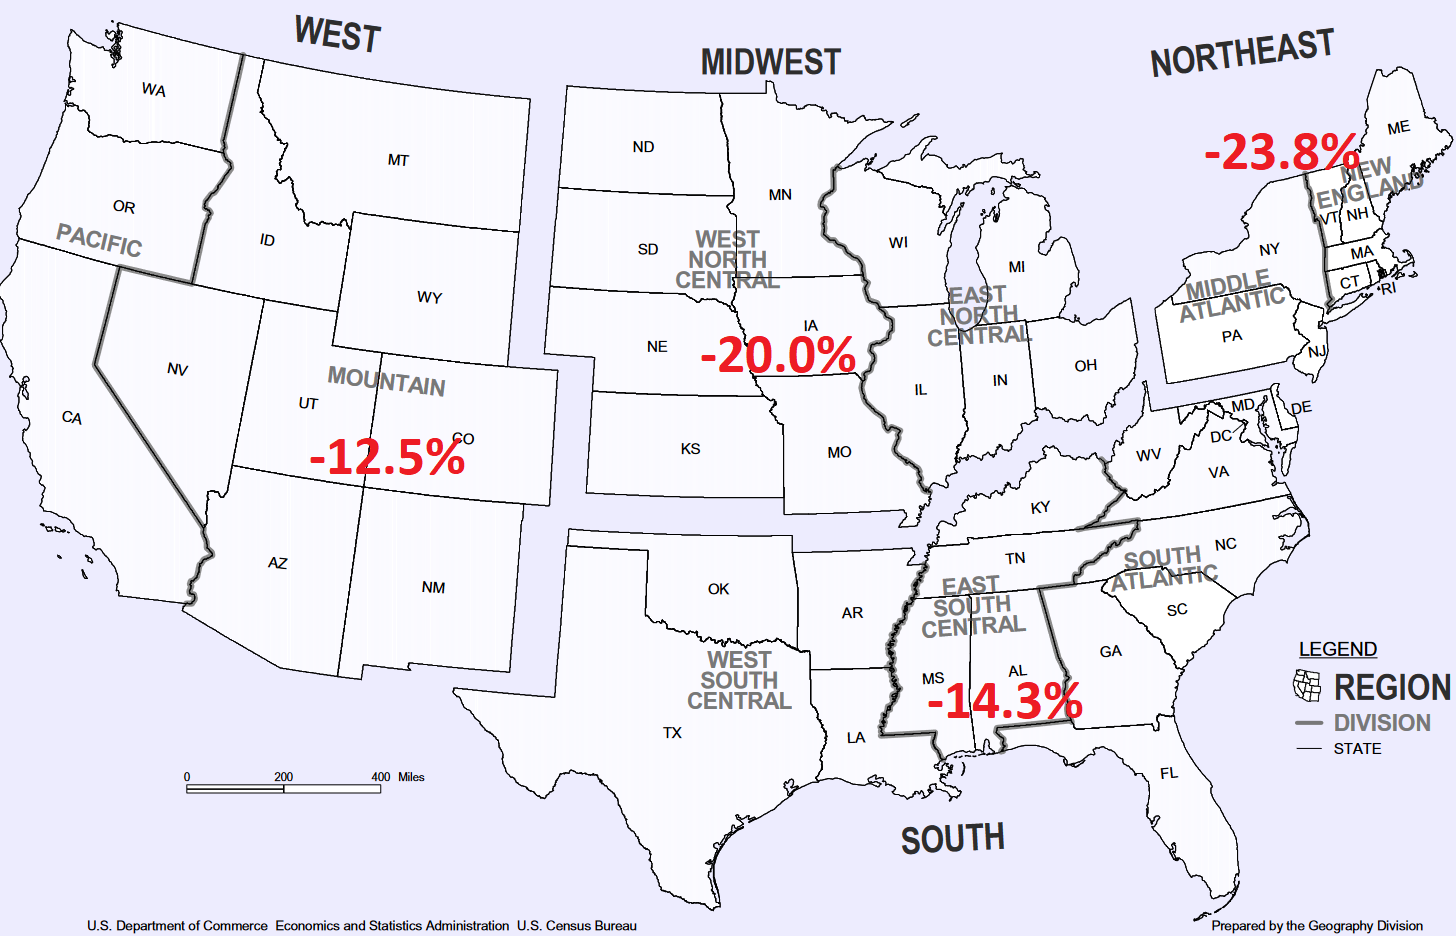
By region, year-over-year sales plunged in all regions:
Cash buyers and Investors pulled back too: All-cash sales – often investors and second home buyers – dropped by 11.2% year-over-year to 96,700 homes in July, or a share of 25% of total sales.
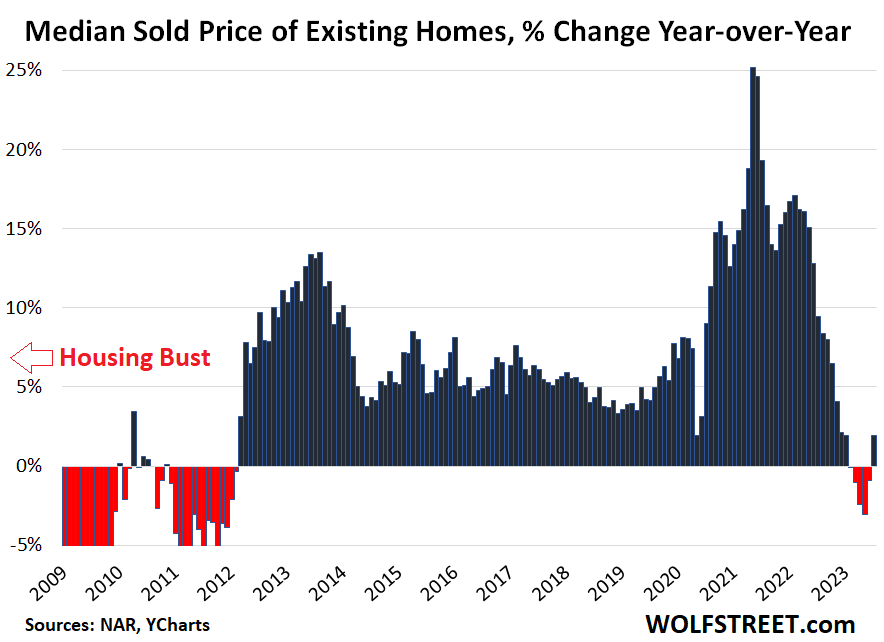
The median price fell to $406,700 in July and was down by 1.7% from the peak in June 2022.
The data today reflect sales that closed in July and were agreed to in prior weeks end months. The data reported a month ago of sales that closed in June and were made weeks earlier reflected the final hurrah of “spring selling season,” a phenomenon that occurs every year when prices and sales always rise, even during Housing Bust 1. Now spring selling season is over. Prices will decline in the second half into January, and it’s just a question of how much (historic data via YCharts):
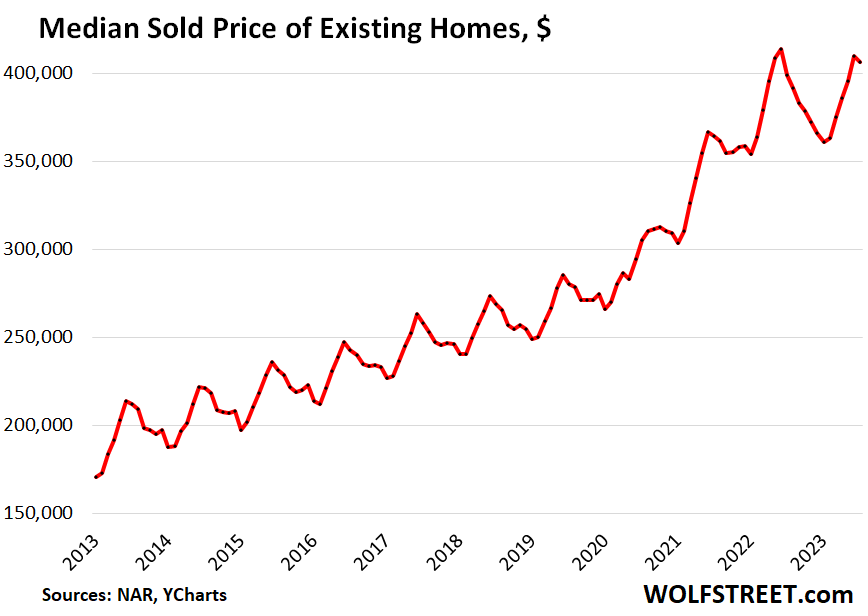
A year ago, in July 2022, the median price had plunged by 3.6% from June 2022, a huge plunge after a series of huge spikes. In July 2023, the month-to-month drop was much smaller, -0.8%, and so year-over-year, the median price was up by 1.9%, though fell further from the peak in June in 2022 (-1.7%):
For your amusement, note the year-over-year price increases during the Housing Bust. Year-over-year percentage changes do that sort of thing:
Days on the market lengthened year-over-year, by both measures:
- Homes spent 45 days on the market in July before they either sold or were pulled off the market, up from 34 days in July 2022, according to realtor.com.
- Homes that sold, but not including homes that were pulled off the market, spent 20 days on the market in July, up from 14 days in July last year, according to NAR.
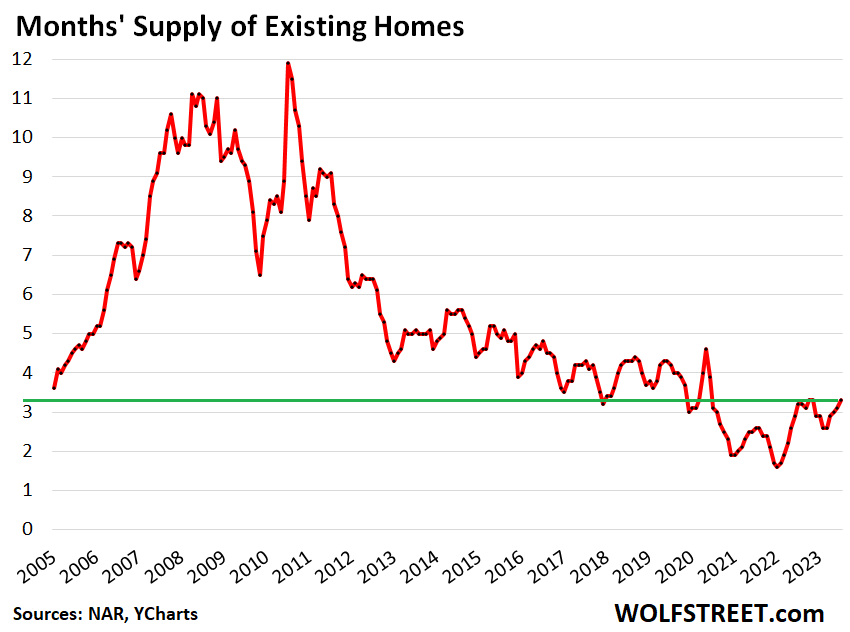
Inventory for sale rose to 1.11 million homes in July, the highest since November 2022.
Supply rose to 3.3 months, matching the highs in 2022 (October and November also 3.3 months) and beyond that, the most supply since June 2020.
Supply in 2017 through 2019 ranged between 3.0 and 4.3 months (historic data via YCharts).
STAY INFORMED! Receive our Weekly Recap of thought provoking articles, podcasts, and radio delivered to your inbox for FREE! Sign up here for the HoweStreet.com Weekly Recap.
Wolf Richter August 23rd, 2023
Posted In: Wolf Street
Next: Society for 2032 »