ALWAYS CONSULT YOUR INVESTMENT PROFESSIONAL BEFORE MAKING ANY INVESTMENT DECISION

October 29, 2023 | Our #1 Bellwether Defies October Curse

Rick Ackerman


Although my technical forecasts have generally been accurate, occasional guesses about when the sky would fall have consistently underimagined the height of bullish folly. Since yet another October looks likely to pass without a stock-market crash, perhaps it’s a good time to look at the chart of Apple, an institutional proxy that is incapable of misleading us. Nearly every portfolio manager on the planet owns the stock, and for good reason. It has been the easiest ticket to wealth since farmers in Quincy, FL, acting on the advice of a local banker, started accumulating Coca-Cola shares in the 1920s.
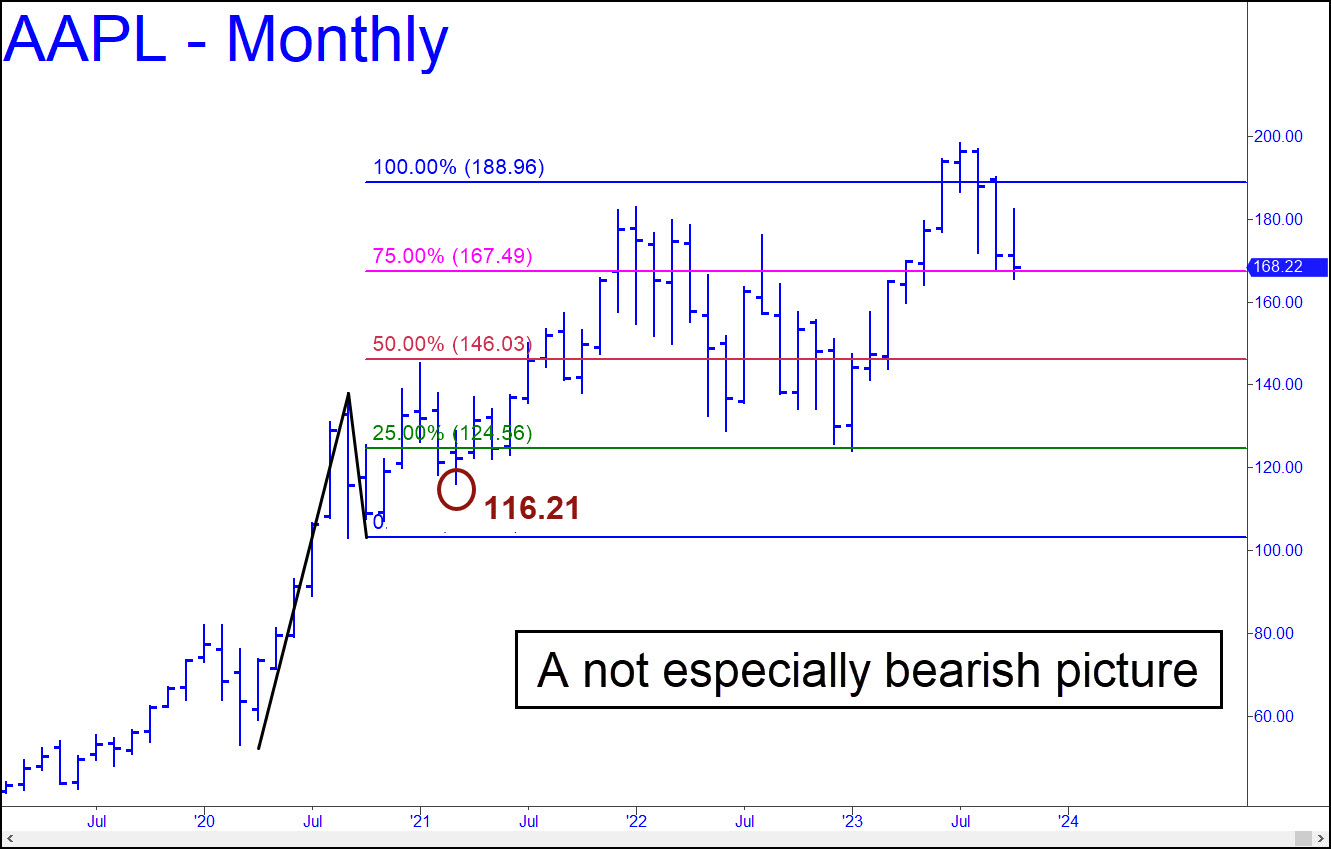
So what is AAPL’s chart saying now, as the Fed continues to tighten a noose around the consumption-based U.S. economy? Although investors have already discounted a slowdown in iPhone sales by cutting the value of Apple shares by 30%, they seem confident that no revenue disaster awaits. My own outlook calls for the stock to fall to at least 146.13, representing a 26% decline from July’s record-high 198.23 and a 13% fall from here. That would be painful for shareholders to endure, but still just a routine bear market correction. And although there can be no guarantees that a lasting bottom will form at 146.13, bulls will at least have a chance to build a base there for another big leg up.
Two More Reasons
There are two other bullish signs in the chart. For one, the July top decisively exceeded a compelling Hidden Pivot resistance at 188.96 that we might have expected to contain the long-term uptrend. And for two, the steep rally begun from $124 in January exceeded two major ‘external’ peaks without taking a breather. This qualified the rally as strongly impulsive, implying that the so-far moderate selloff has been merely corrective. In order to turn the monthly chart bearish, AAPL would need to fall beneath the circled low at 116.21 recorded in March 2021. Until such time as that happens, AAPL’s long-term chart, and therefore prospects for the stock market as a whole, will remain bullish.
STAY INFORMED! Receive our Weekly Recap of thought provoking articles, podcasts, and radio delivered to your inbox for FREE! Sign up here for the HoweStreet.com Weekly Recap.
Rick Ackerman October 29th, 2023
Posted In: Rick's Picks
Next: Debt Catharsis »