ALWAYS CONSULT YOUR INVESTMENT PROFESSIONAL BEFORE MAKING ANY INVESTMENT DECISION

February 14, 2024 | The Most Splendid Housing Bubbles in Canada: National Price Drops Further in January -18.3% from Peak. End of Easy Money

Wolf Richter


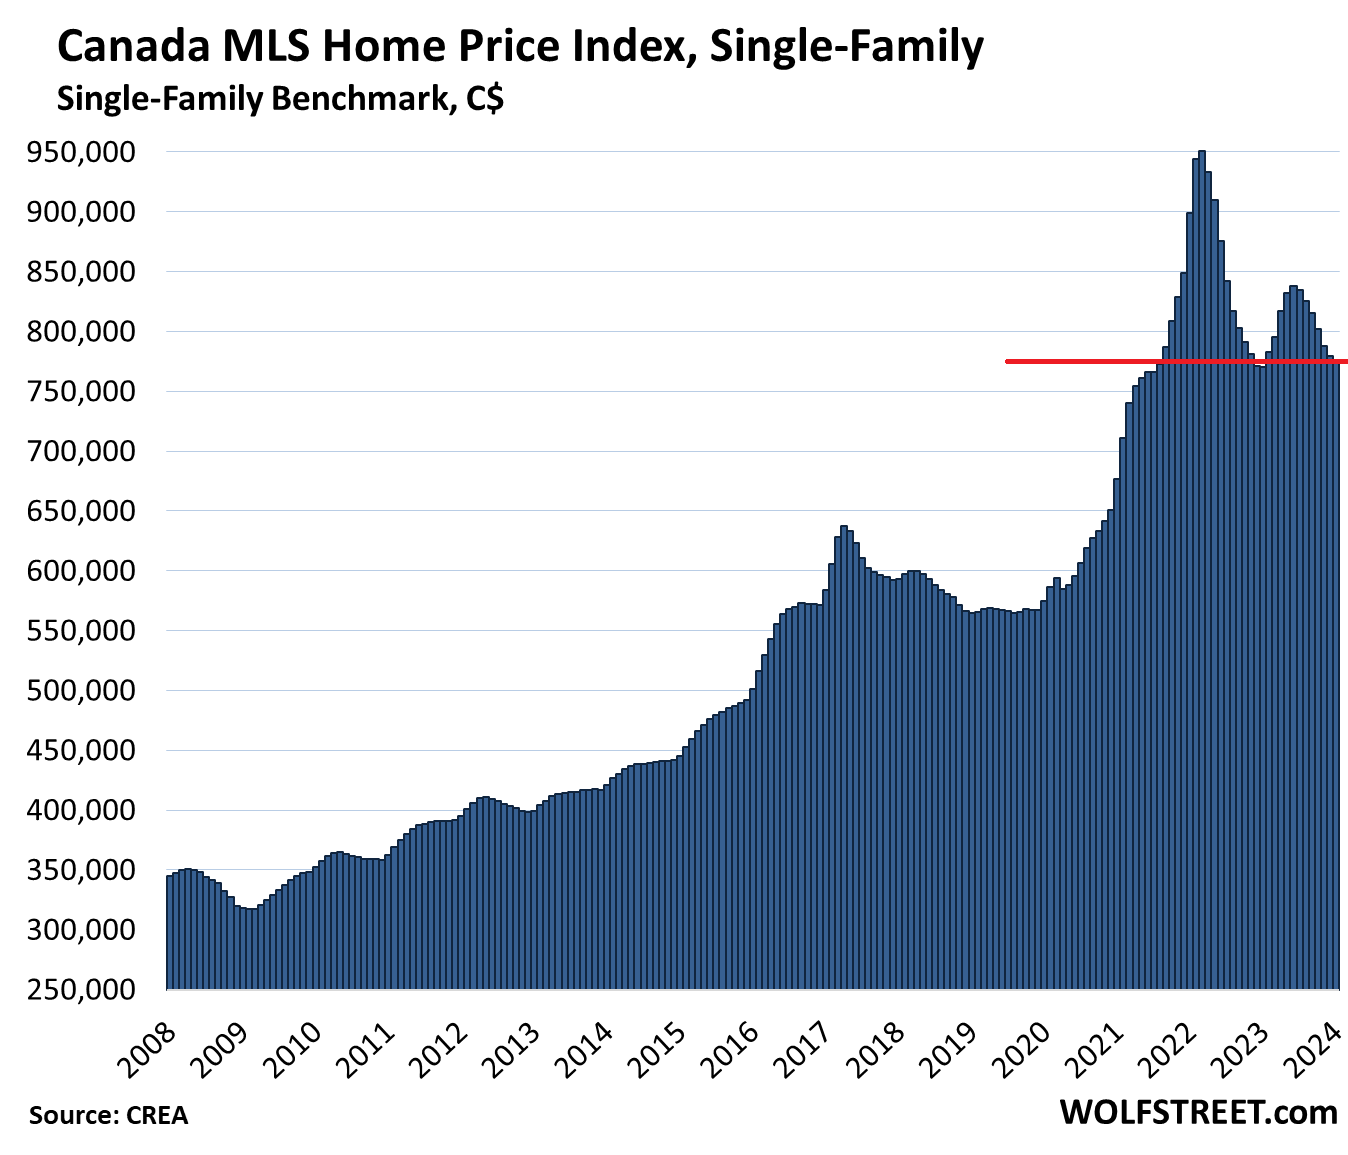
House prices in Canada overall fell 1.2% seasonally adjusted in January from December. Not seasonally adjusted, they fell 0.4%, having now fallen by 18.3% from the peak in March 2022, according to the Home Price Benchmark Index for single family houses by the Canadian Real Estate Association (CREA) today.
In dollar terms, the national index has fallen by $174,300 from the peak in March 2022, to $776,300, just a hair above where it had first been in August 2021 on the way up (all amounts in Canadian dollars).
The not-seasonally adjusted month-to-month drop in January of 0.4% was bigger than the drop a year ago (-0.1%), which whittled down the year-over-year gain to just 0.8%. Some markets had sharp month-to-month drops and fell further from their all-time highs, while other markets had month-to-month gains and Calgary prices hit a new high. And we’ll get to them.
Home sales rose by 22% from the collapsed levels a year ago, but were still 9% lower than the 10-year average for January.
New listings ticked up 1.5% in January from December, which was smaller than the increase in sales. And so supply ticked down to 3.7 months’ of sales at the end of January, from 3.8 months’ at the end of December.
Easy money vanished, inflation is here. The Bank of Canada has tightened policy to deal with this inflation, it hiked its overnight rate to 5.0% in July and has kept it there. And it has been shedding over half of the pile of securities that it had added during its pandemic-money-printing binge. And for part of last year, it looked like inflation had been licked, and the rate-cut bets were all getting lined up in a row, and bond yields and mortgage rates dropped in feverish anticipation.
But at the end of 2023, inflation – especially the two measures the Bank of Canada prefers – refused to cooperate with the rate-cut bets and instead re-accelerated.
So yields and mortgage rates rose again in January and into February. They’re now higher than they were a year ago. In March 2023, mortgage rates plunged on rate-cut hype; the Government of Canada 5-year yield, which is crucial for the types of mortgages that are common in Canada, fell to the 2.8%-3.2% range in the spring months, and that helped fuel the spring selling season. And now it’s back at 3.7%.
Home Prices by Market.
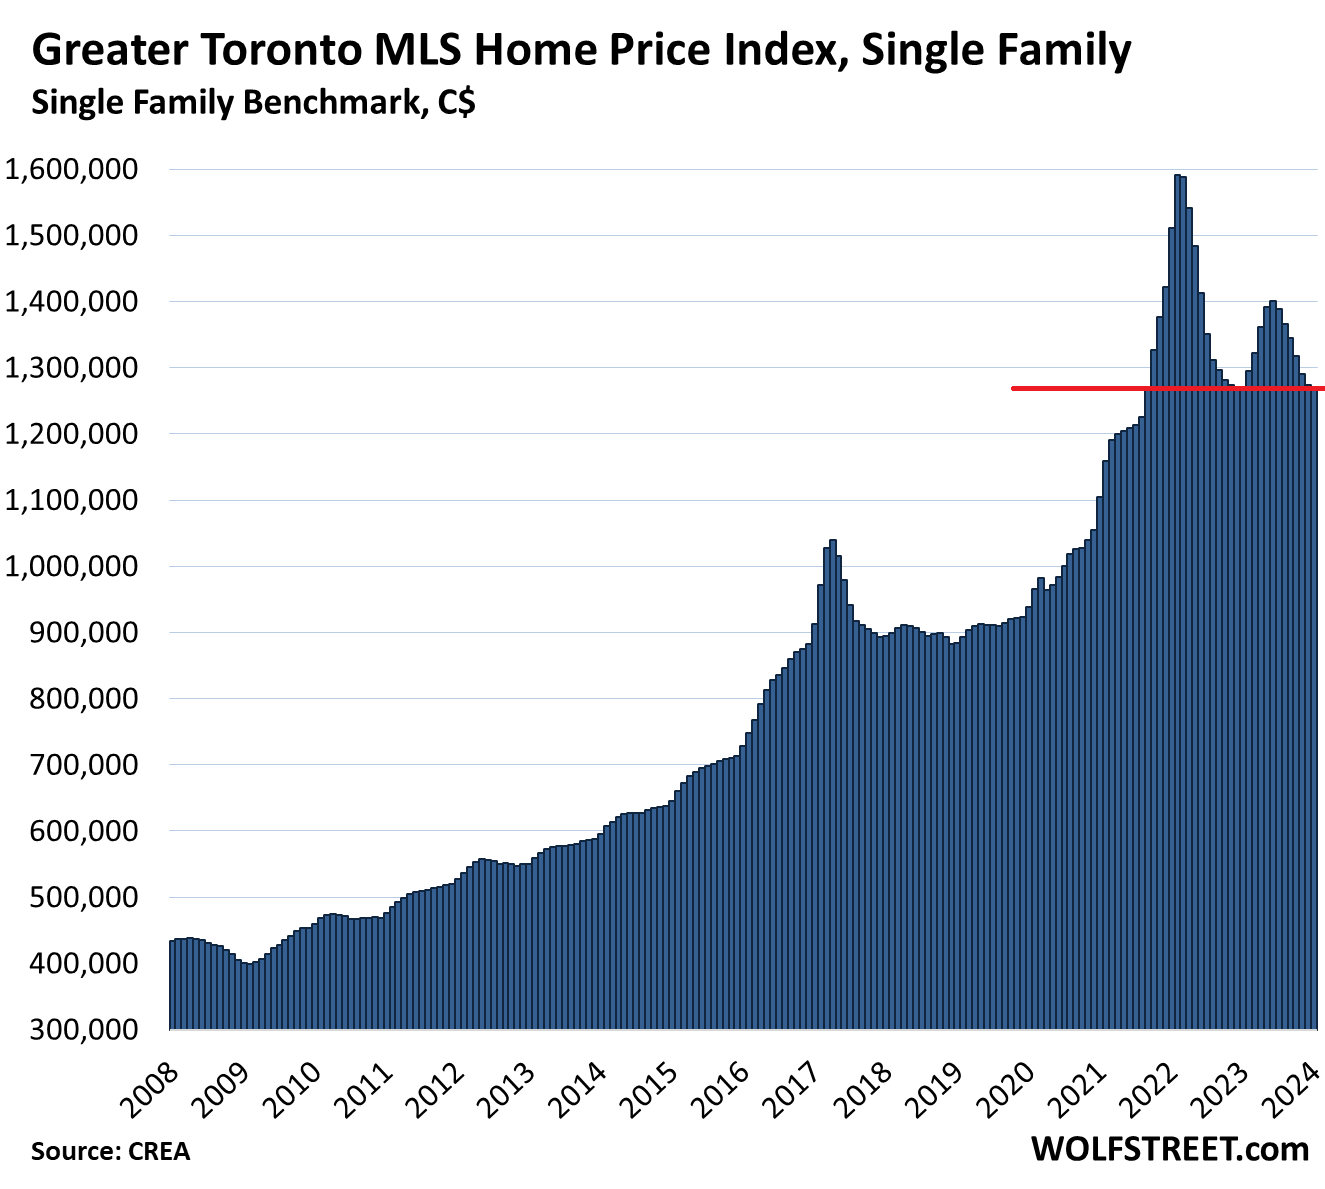
Greater Toronto Area, single-family houses: The MLS Home Price Benchmark Index for single-family houses dipped by 0.2% in January from December, to $1,273,300. It’s now just a fistful of dollars – OK, an armful of dollars, $4,301 to be precise – away from carving out a new two-year low.
The benchmark price has plunged by 20.2%, or by $320,800, from the peak in February 2022, and is back where it had first been in September 2021.
A year ago in January, the index had remained unchanged. So this drop last month whittled down the year-over-year gain to 0.3%.
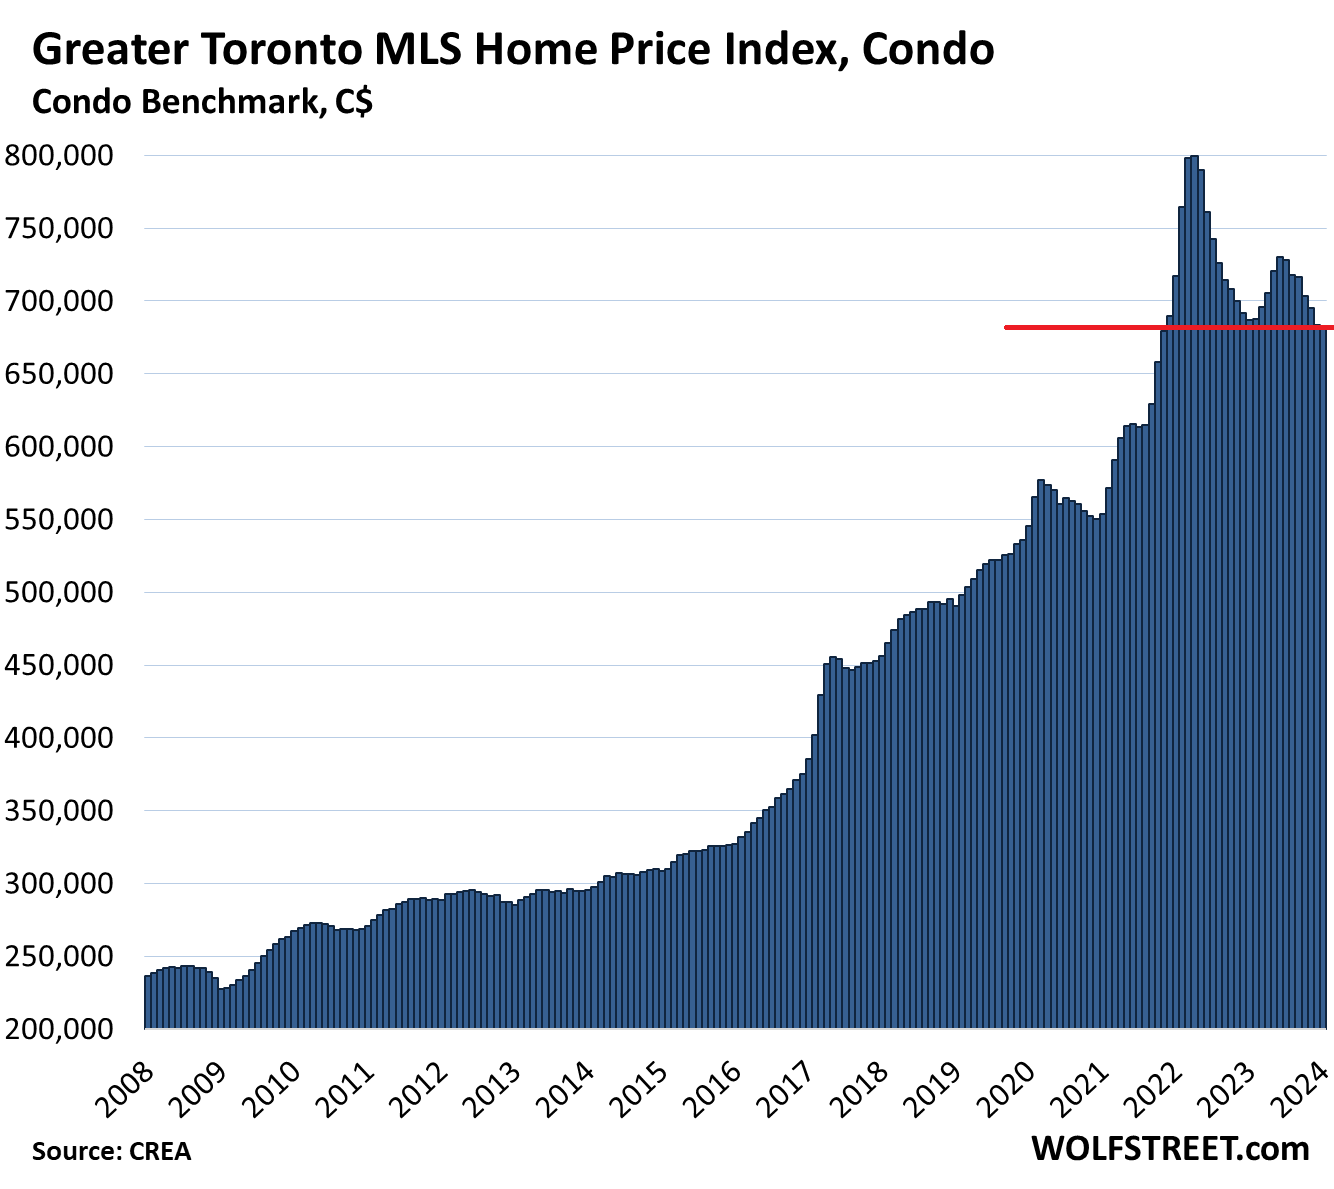
Greater Toronto Area, Condos: Prices dipped by 0.1% in January from December, to $682,600, down by 0.7% year-over-year, and by 14.6% from the peak in April 2022, marking a new two-year low:
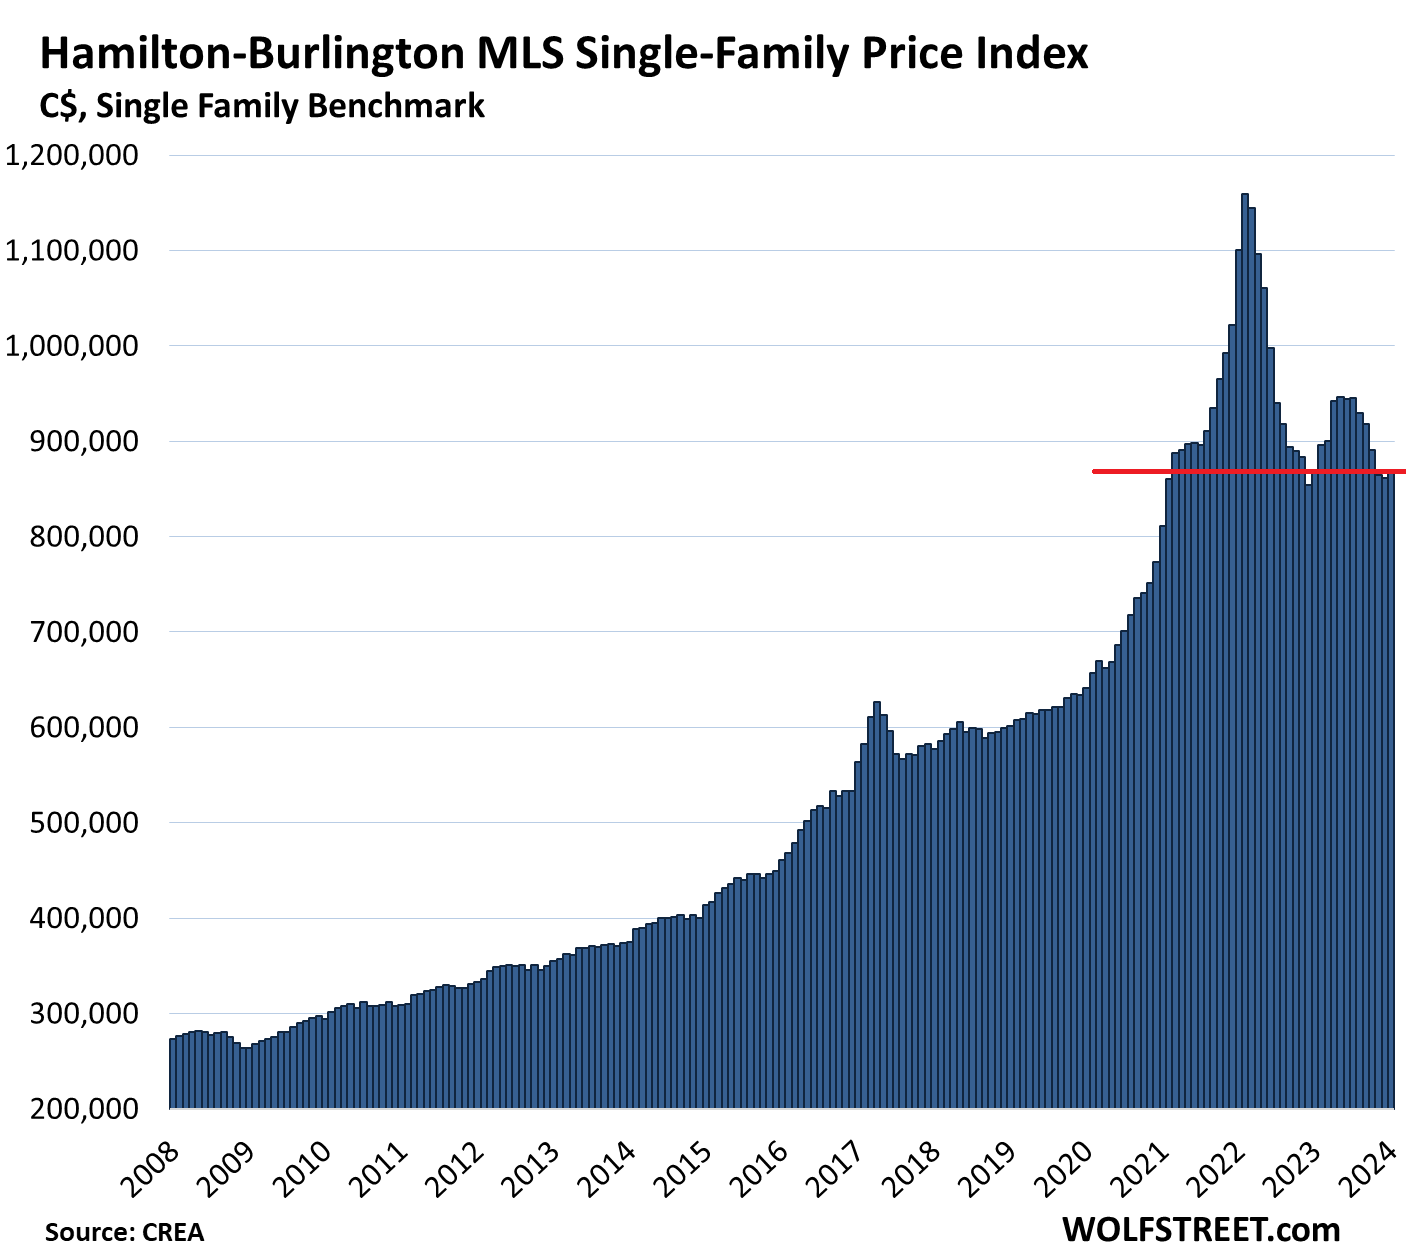
Hamilton-Burlington metro (part of the “Greater Toronto and Hamilton Area”): The single-family benchmark price rose by 1.0% in January from December, to $869,500. From the peak in February 2022, the benchmark price has plunged by 25.0%, or by $298,400.
But that month-to-month rise of 1.0% was smaller than the rise in January last year (+1.9%), and so year-over-year the index fell into the negative (-0.1%).
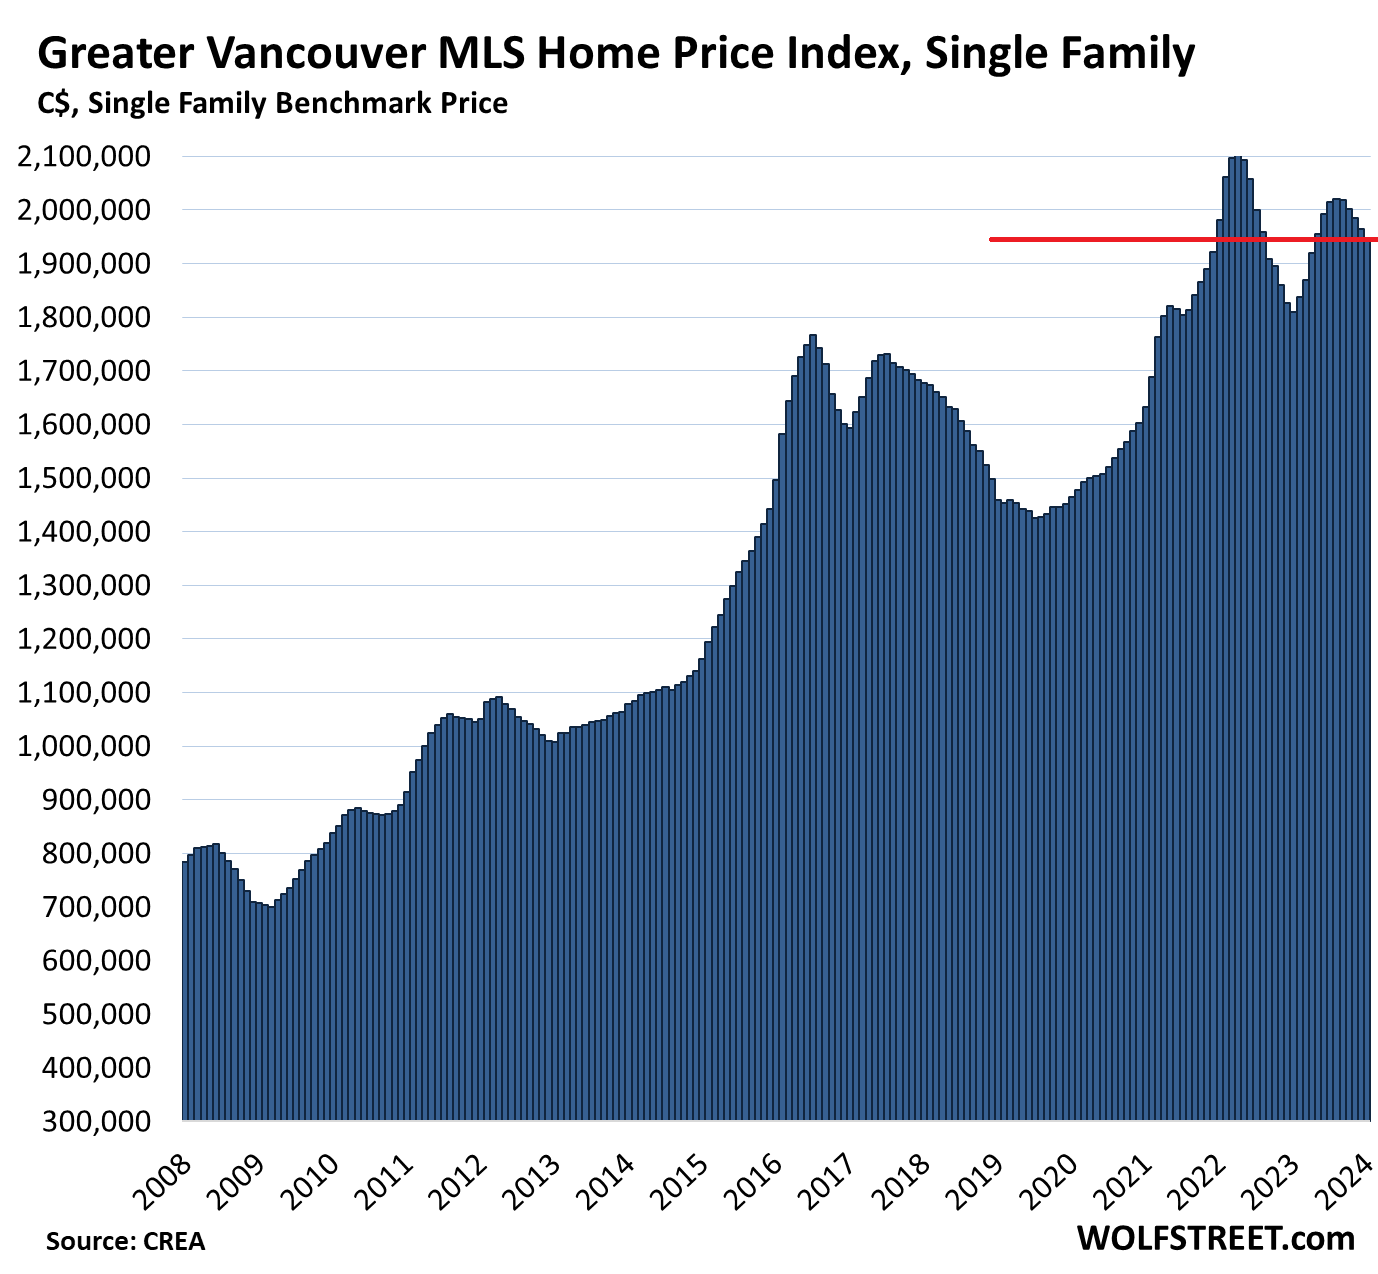
Greater Vancouver: The benchmark price for single-family houses fell 1.1% for the month, to $1,943,200:
- From peak in April 2022: -7.6% or -$158,900
- Year-over-year: +7.3%
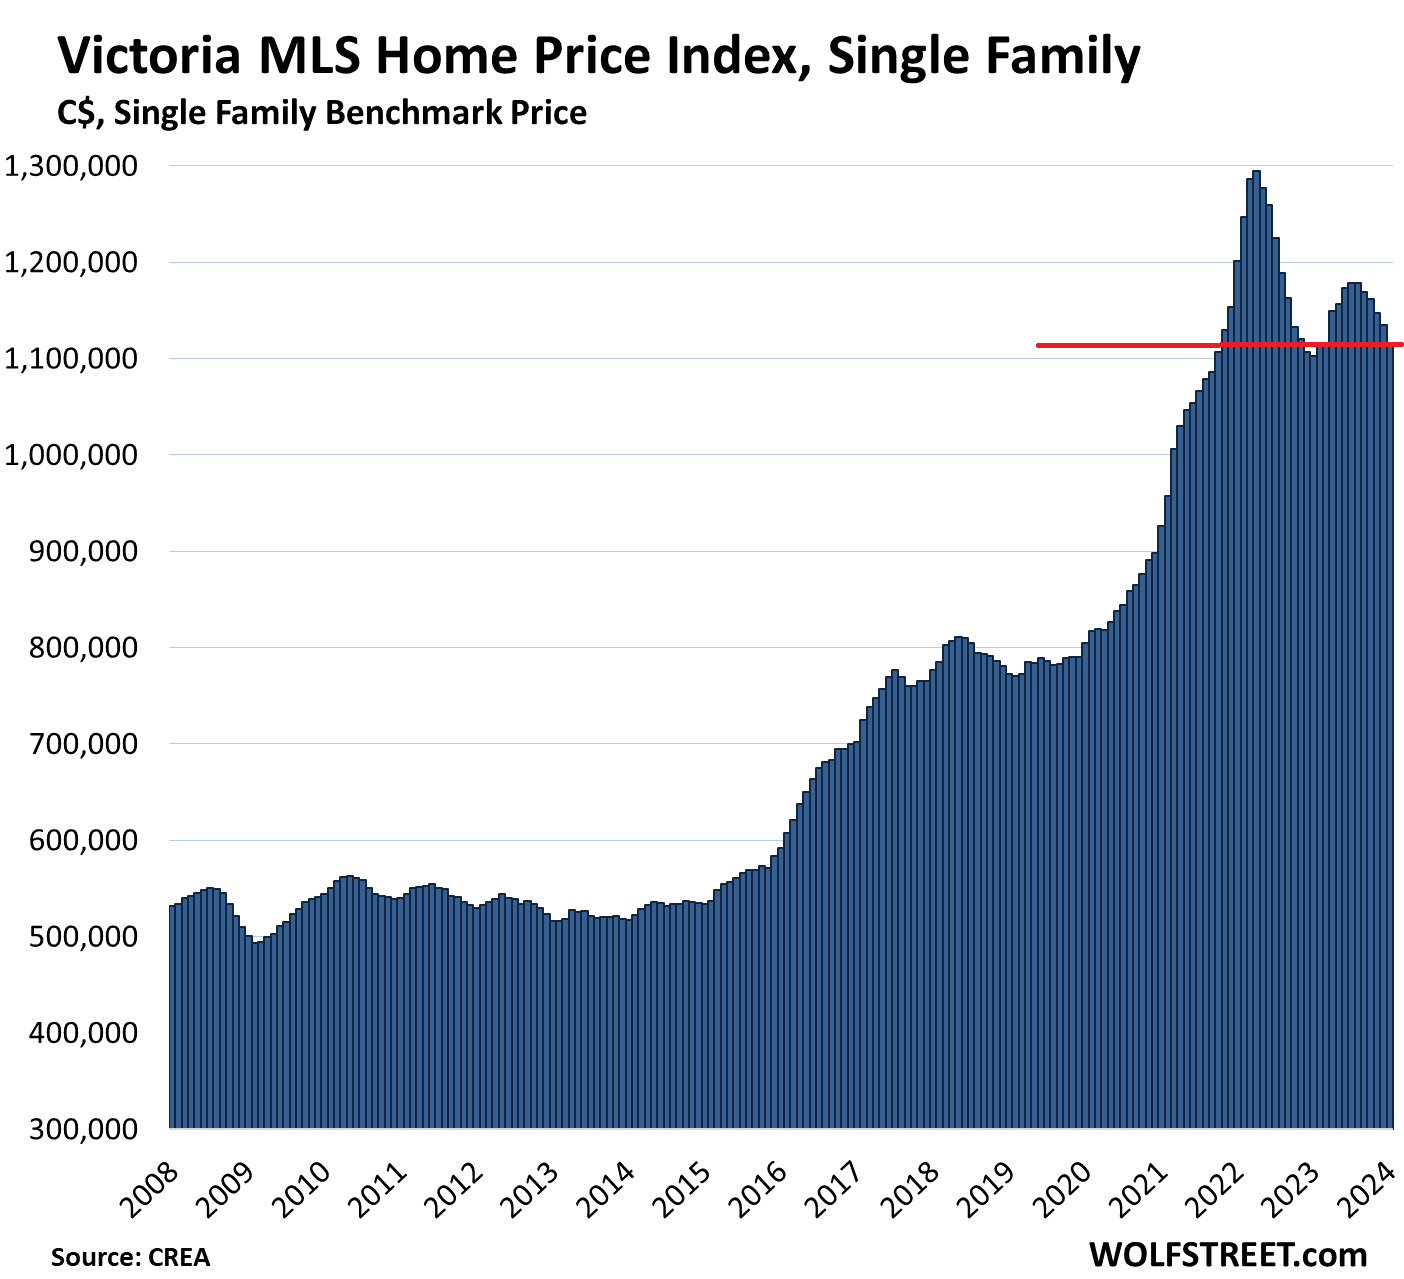
Victoria: The single-family benchmark price fell by 1.7% for the month to $1,115,300:
- From peak in April 2022: -13.8% or -$179,100
- Year-over-year: +1.2%
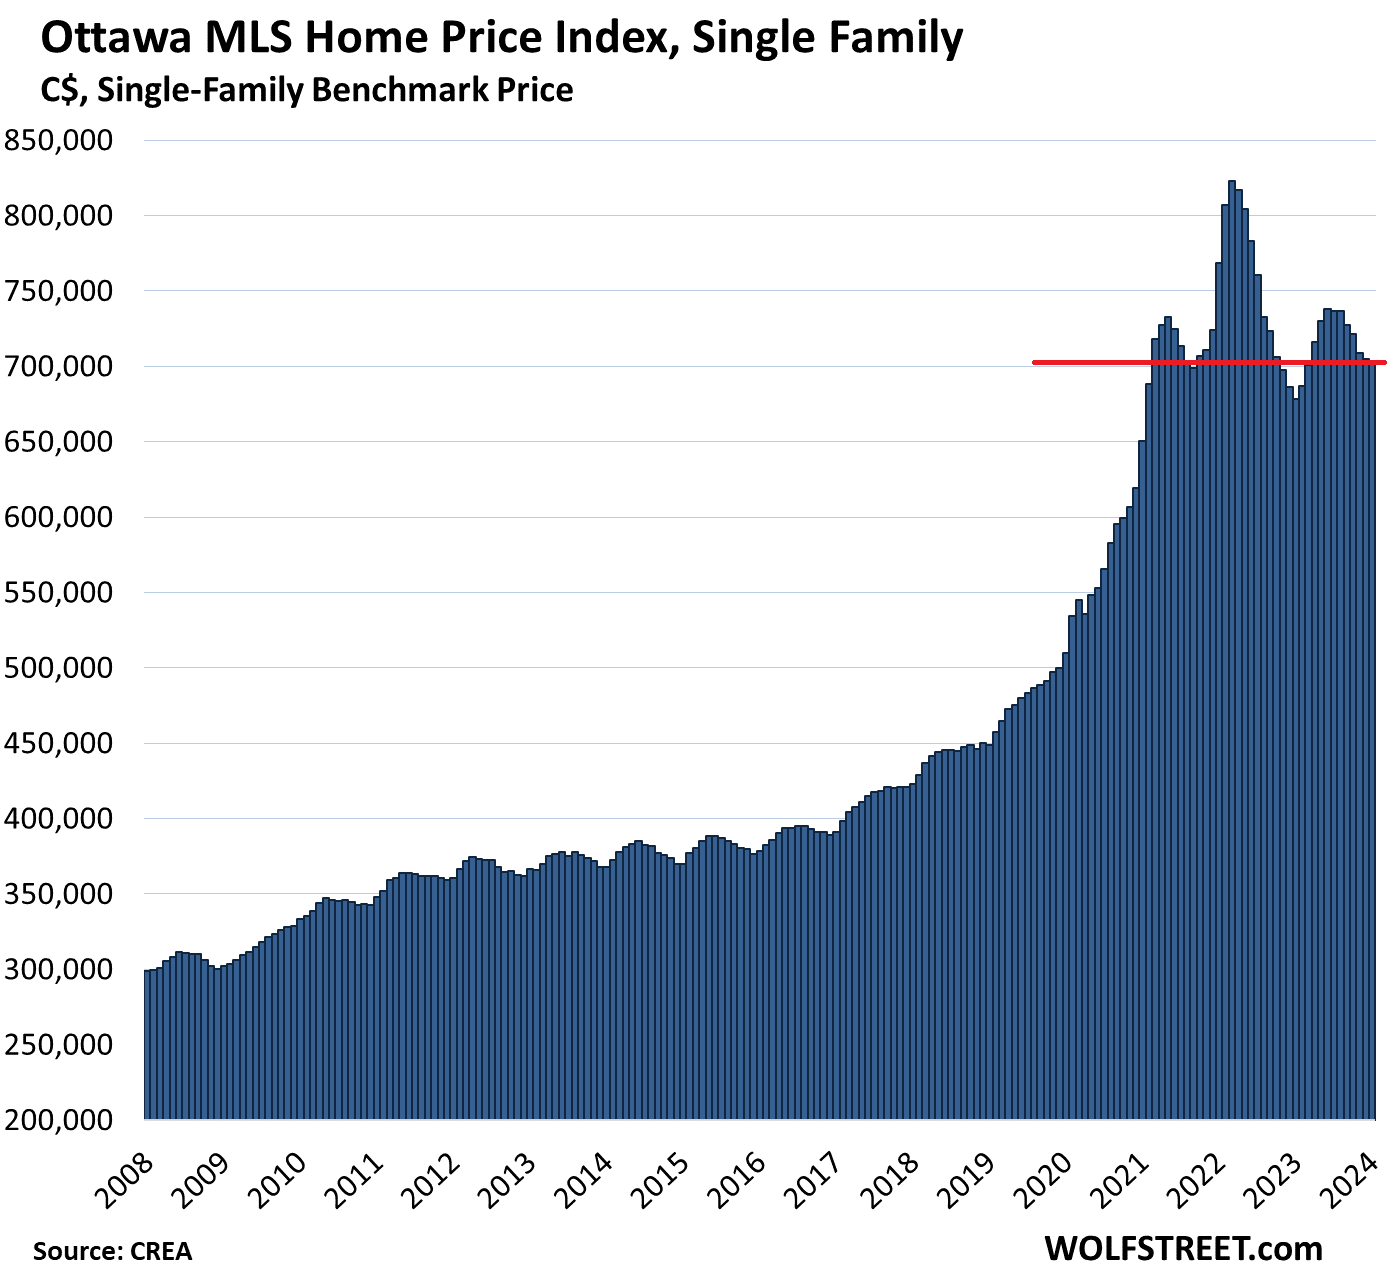
Ottawa: The benchmark price of single-family houses dipped by 0.2% for the month, to $703,500, below where they’d first been in March 2021:
- From peak in March 2022: -14.5% or -$119,700
- Year-over-year: +3.7%.
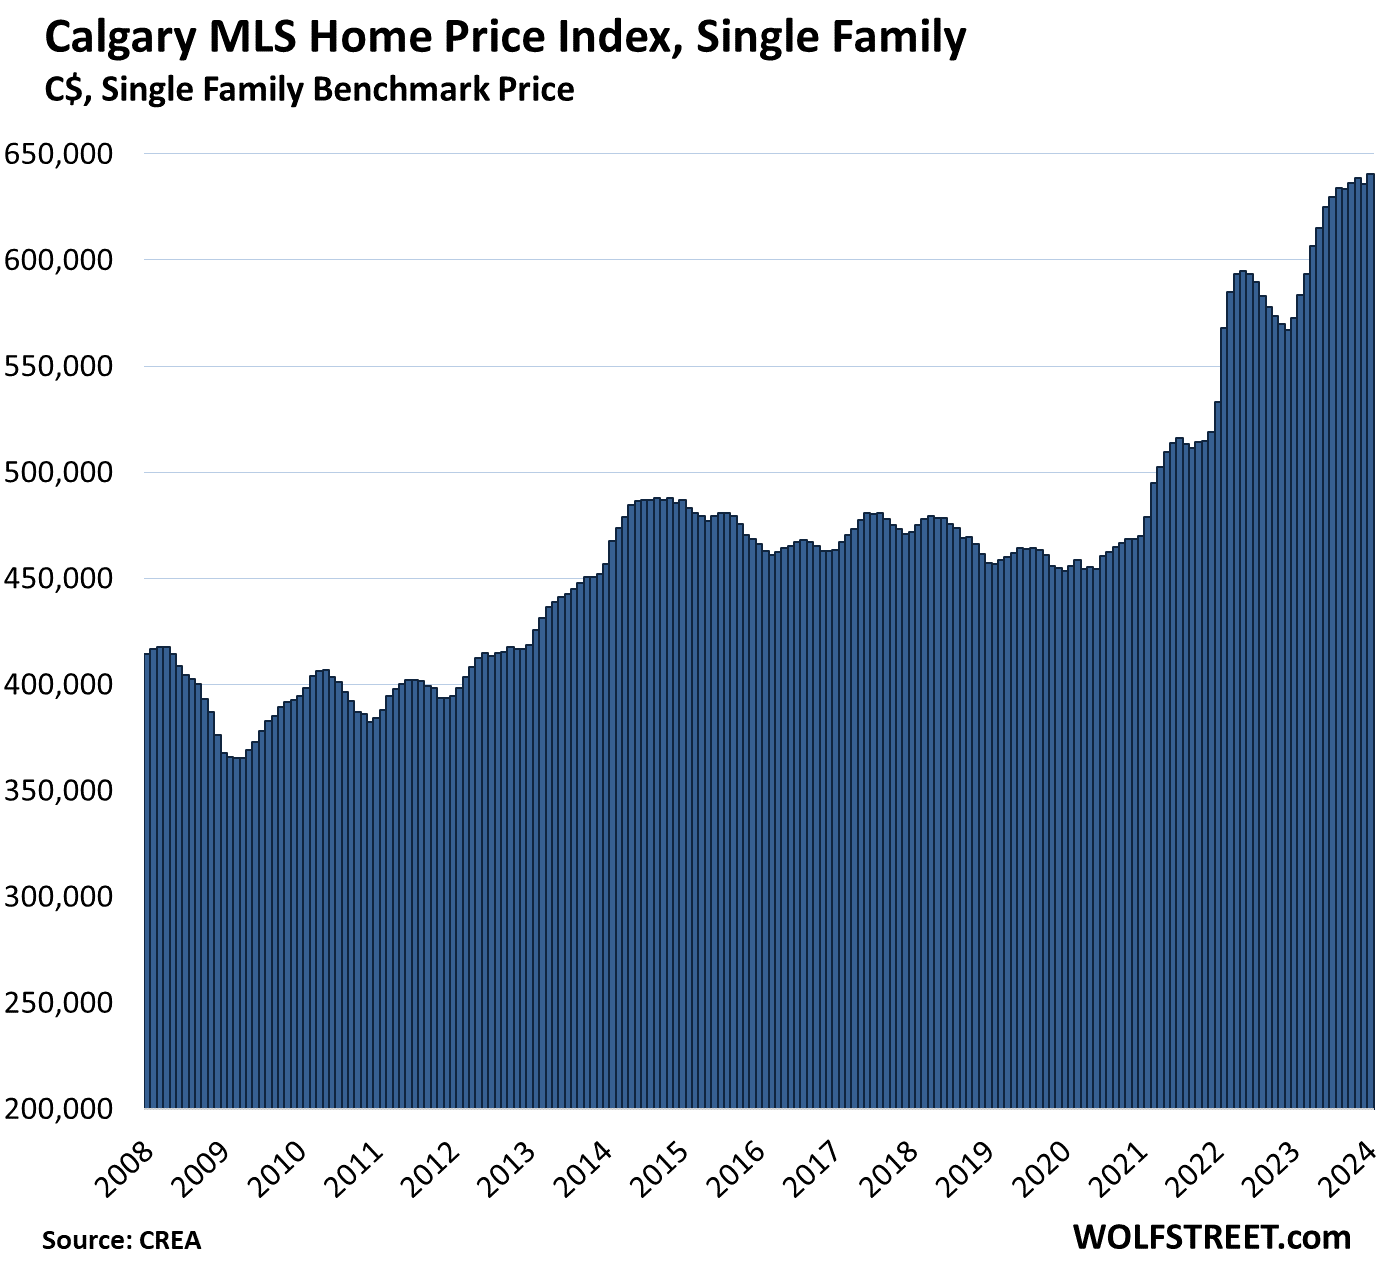
Calgary: The single-family benchmark price rose by 0.8% to a new high of $640,500. This increase, smaller than a year ago, whittled down the year-over-year gain to 11.9%.
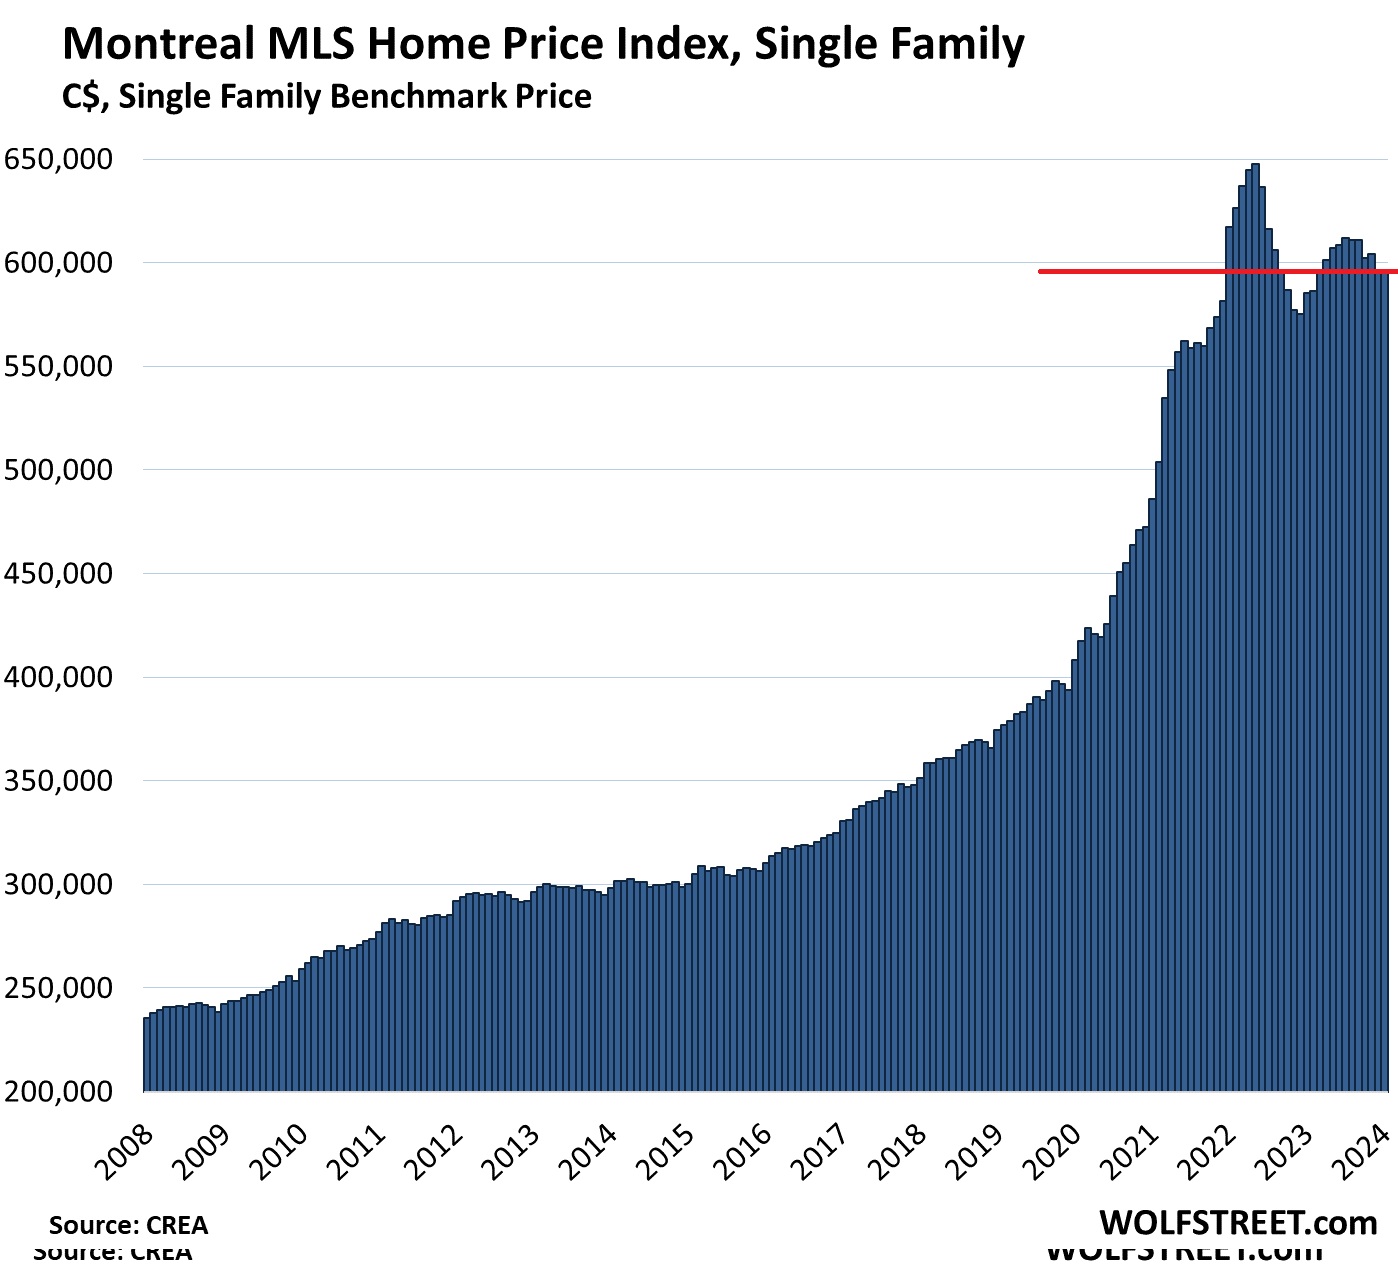
Montreal: The single-family benchmark price inched up 0.1% in January from December to $596,300. This tiny uptick – compared to the 1.7% jump a year ago – whittled down the year-over-year gain to 1.9% (from 3.5% in December).
Since the peak in May 2022, the index has fallen 7.9% or by $51,300.
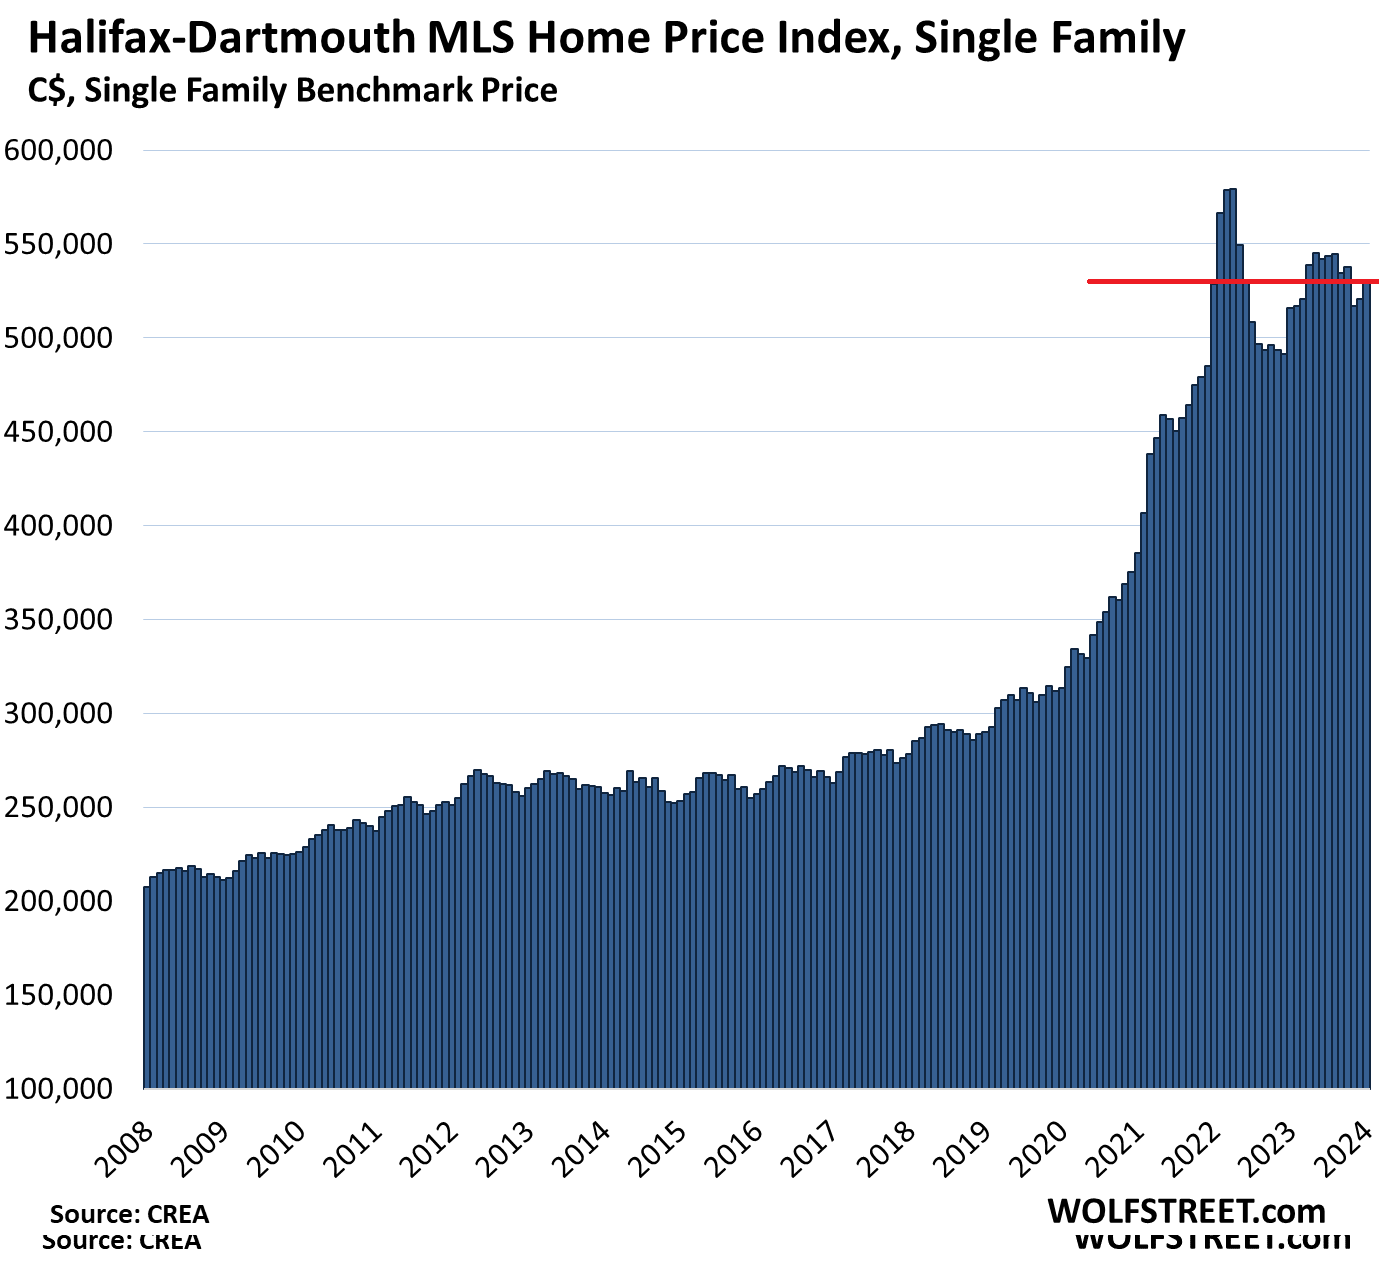
Halifax-Dartmouth: The single-family benchmark price rose 1.8%, to $530,100; but in January a year ago, the price had jumped by 5.0%, and so this smaller increase whittled down the year-over-year again to 2.7%. Since the peak in April 2022, the index has fallen by 8.5%, or by $49,400.
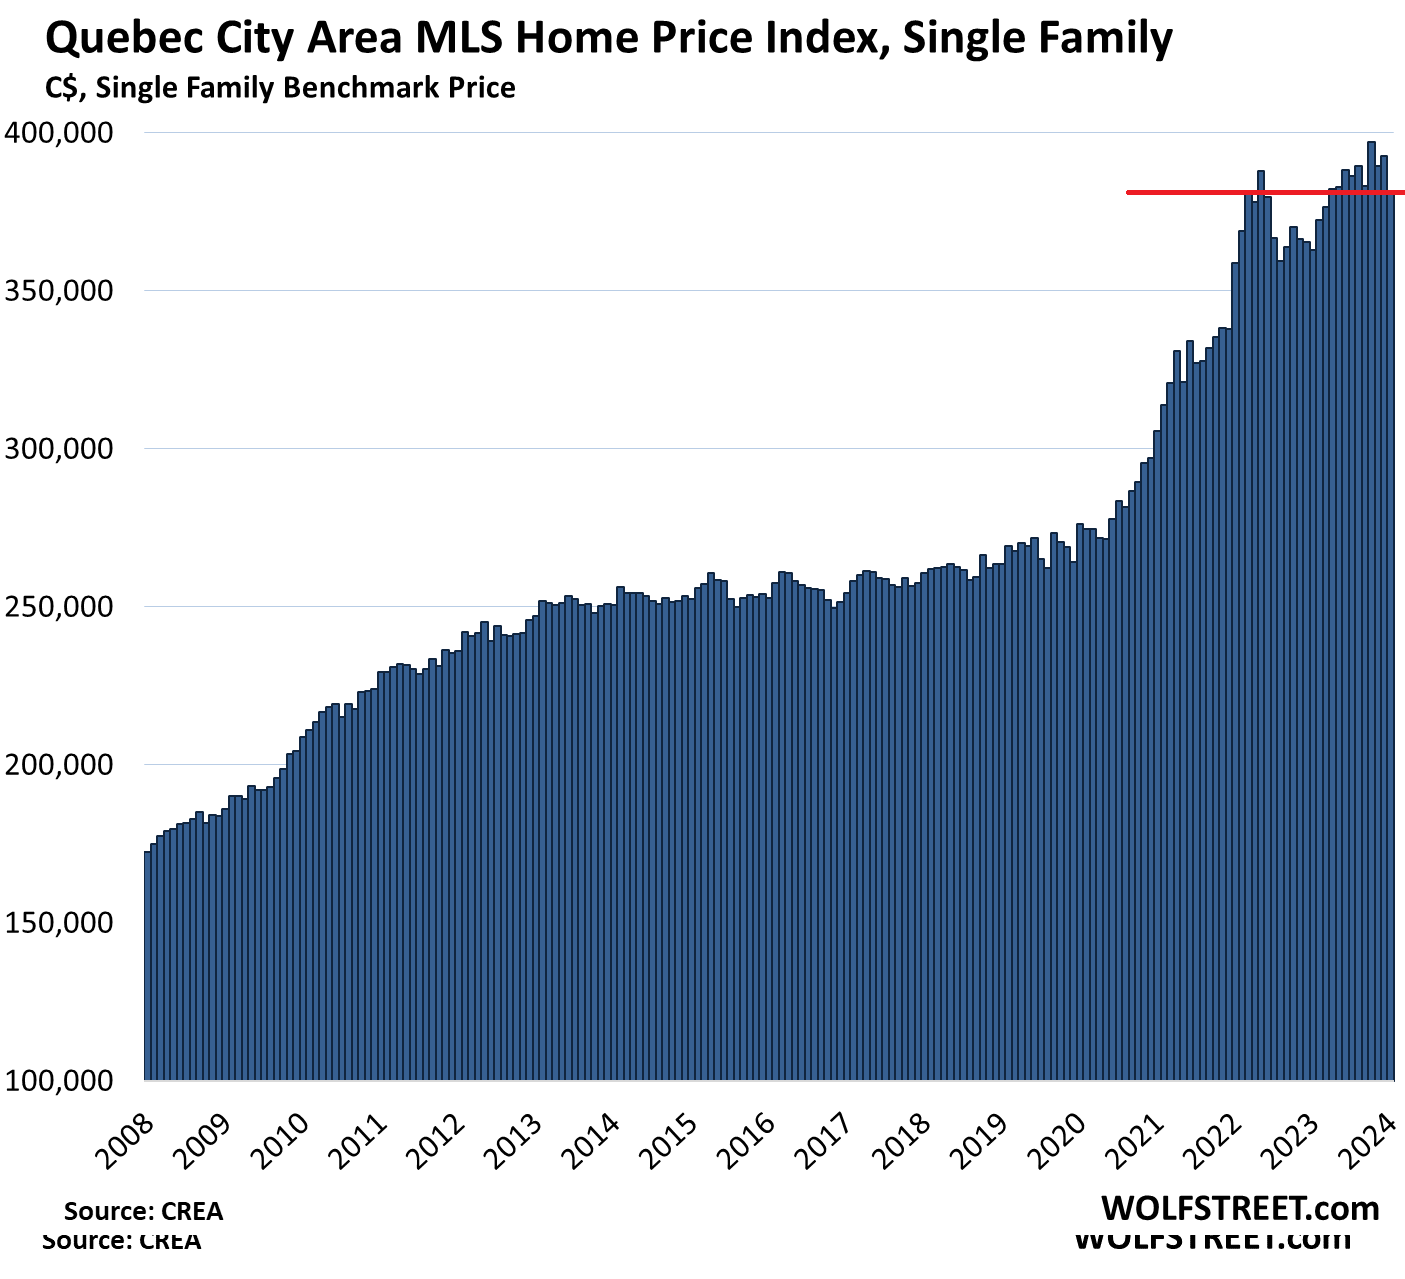
Quebec City Area: The single-family benchmark price dropped by 2.9%, to $381,300, which reduced the year-over-year gain to 5.0%. The index is now roughly back where it had first been in March 2022:
STAY INFORMED! Receive our Weekly Recap of thought provoking articles, podcasts, and radio delivered to your inbox for FREE! Sign up here for the HoweStreet.com Weekly Recap.
Wolf Richter February 14th, 2024
Posted In: Wolf Street