ALWAYS CONSULT YOUR INVESTMENT PROFESSIONAL BEFORE MAKING ANY INVESTMENT DECISION

January 30, 2024 | The Most Splendid Housing Bubbles in America, January 2024 Update. Biggest Price Drops from 2022 Peak: San Francisco, Seattle, Portland, Denver, Las Vegas, even San Diego

Wolf Richter


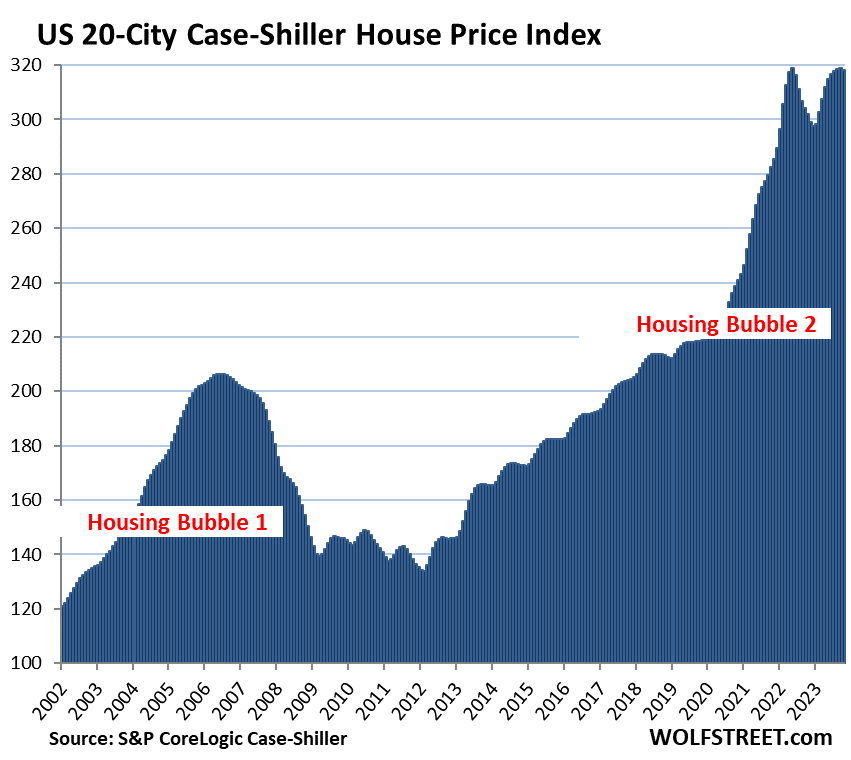
The overall home price index for the 20 metros that today’s S&P CoreLogic Case-Shiller Home Price Index covers dipped a hair from the prior month and is now forming a beautiful double-top, after a huge mind-blowing spike.
We’re going to get to the individual “most splendid housing bubbles” – as we’ve called them since 2017 to track their astounding surge – and we’ll see some big price drops from the highs in 2022 in some markets, and we’ll see some markets that put in new highs, and we’ll see a lot of double tops, and some well on their way down from the second top.
Today’s S&P CoreLogic Case-Shiller Home Price Index for “November” is a three-month moving average of home prices whose sales were entered into public records in September, October, and November, so deals made in the fall. It lags, but it uses the “sales-pairs method,” comparing the sales price of the same house over time, thereby eliminating the issues associated with median prices and average prices (see “Methodology” toward the end of the article).
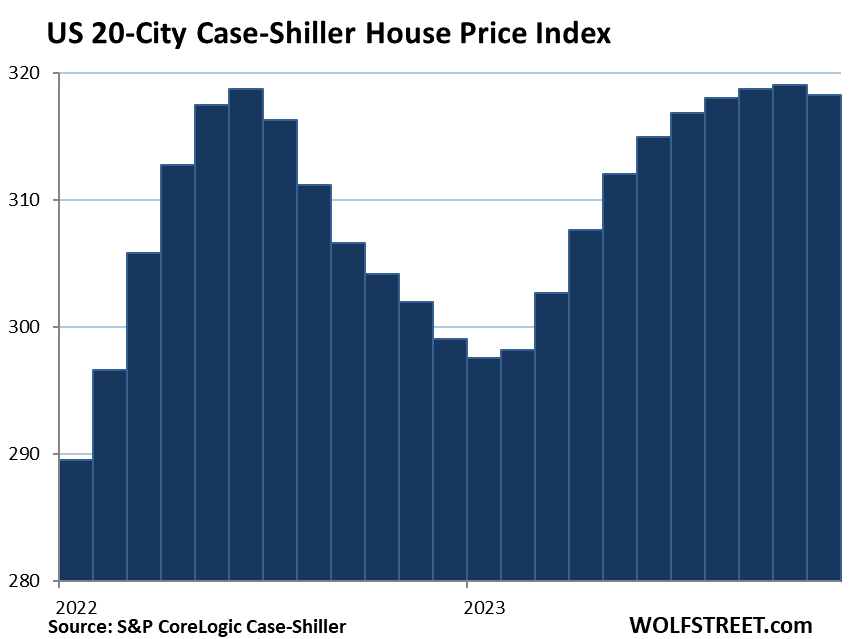
Here is the double top of the 20-City Index under the magnifying glass:
Prices were below their 2022 peaks in 9 metros of the 20 metros in the Case-Shiller index (% from their respective peak, Case-Shiller month of peak):
- San Francisco Bay Area: -12.8% (May 2022)
- Seattle: -12.1% (May 2022)
- Portland: -6.8% (May 2022)
- Denver: -6.1% (May 2022)
- Phoenix: -5.4% (June 2022)
- Las Vegas: -5.1% (July 2022)
- Dallas: -5.0% (June 2022)
- San Diego: -2.7% (May 2022)
- Los Angeles: -0.6% (May 2022)
Month-to-month declines occurred in November in 13 of the 20 metros.
Prices set new highs in 7 of the 20 metros in the index (% year-over-year). Cleveland, Charlotte, and Atlanta are not part of the “most splendid housing bubbles” because their home prices haven’t risen nearly enough since 2000 to make it into this infamous list.
- New York metro: +7.4%
- Boston: +7.1%
- Miami: +7.2%
- Cleveland: +7.4%
- Charlotte: +7.0%
- Atlanta: +5.9%
- Tampa: +3.4%
The most splendid housing bubbles by metro.
San Francisco Bay Area:
- Month to month: -1.3%
- Year over year: +2%
- From the peak in May 2022: -12.8%.
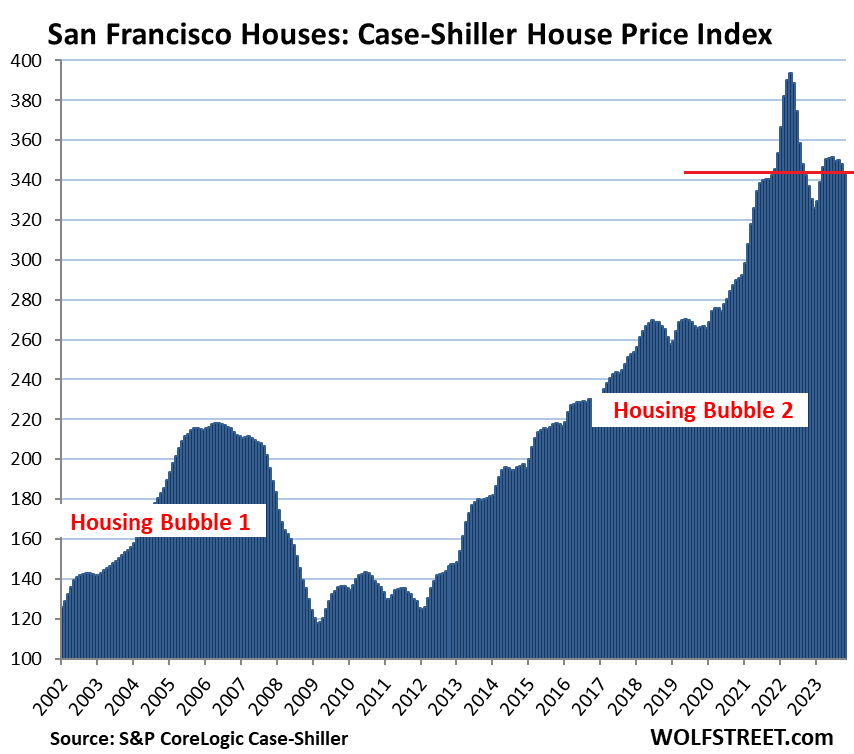
And the closeup of San Francisco:

Seattle metro:
- Month to month: -1.4%.
- Year over year: +1.6%.
- From the peak in May 2022: -12.1%.
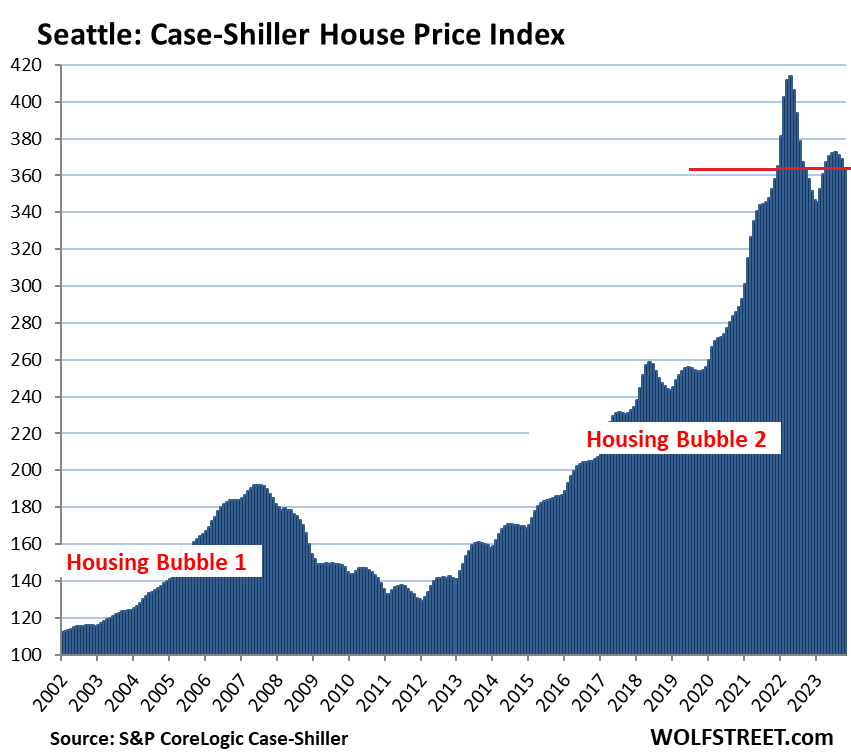
The closeup of Seattle:

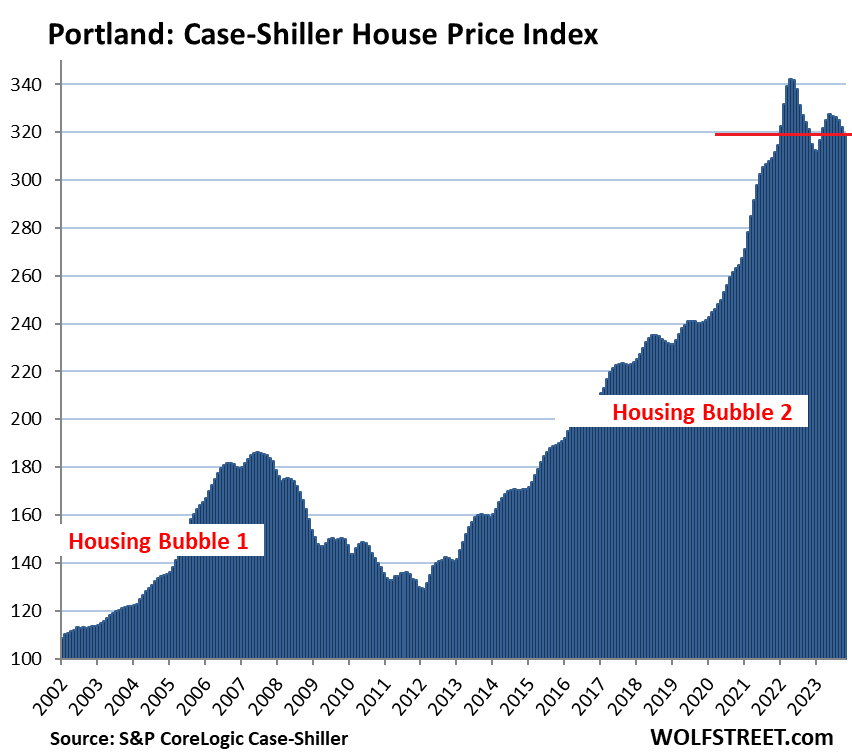
Portland metro:
- Month to month: -0.9%.
- Year over year: -0.7%.
- From the peak in May 2022: -6.8%.
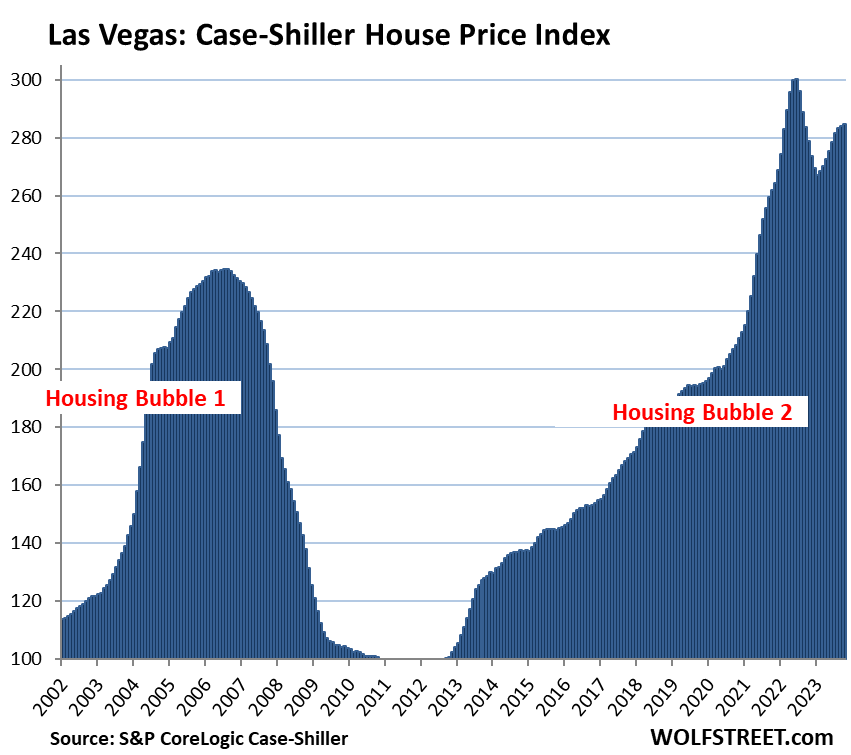
Las Vegas metro:
- Month to month: +0.2%.
- Year over year: +2.1%.
- From the peak in July 2022: -5.1%.
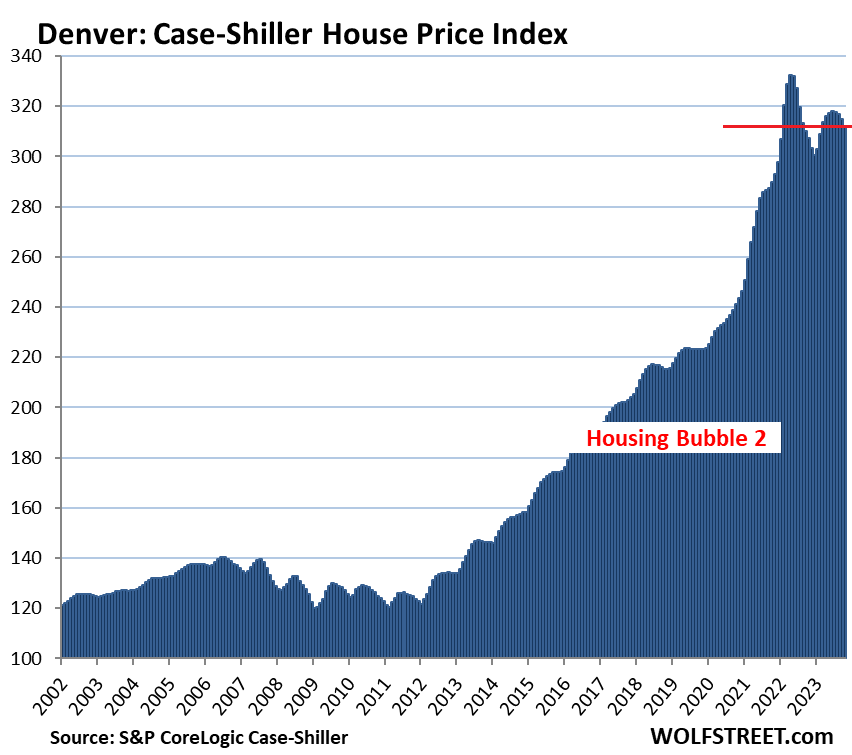
Denver metro:
- Month to month: -0.9%.
- Year over year: +1.5%.
- From the peak in May 2022: -6.1%.
Phoenix metro:
- Month to month: -0.3%.
- Year over year: +2.5%.
- From the peak in June 2022: -5.4%.

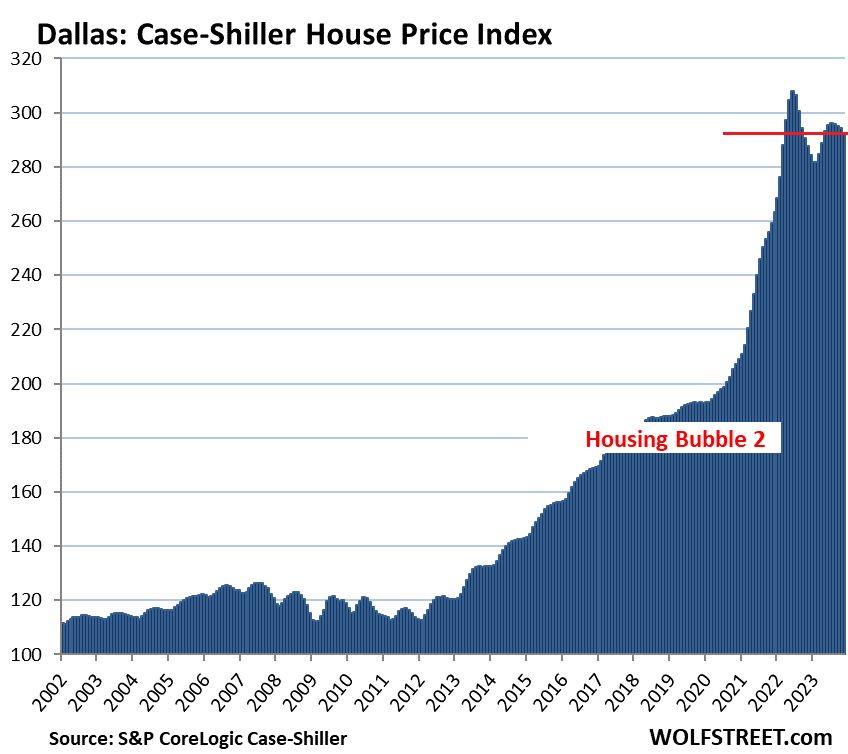
Dallas metro:
- Month to month: -0.6%.
- Year over year: +1.7%.
- From the peak in June 2022: -5.0%.
San Diego metro:
- Month to month: -0.5%.
- Year over year: +8.0%.
- From the peak in May 2022: -2.7%.

The closeup of San Diego:

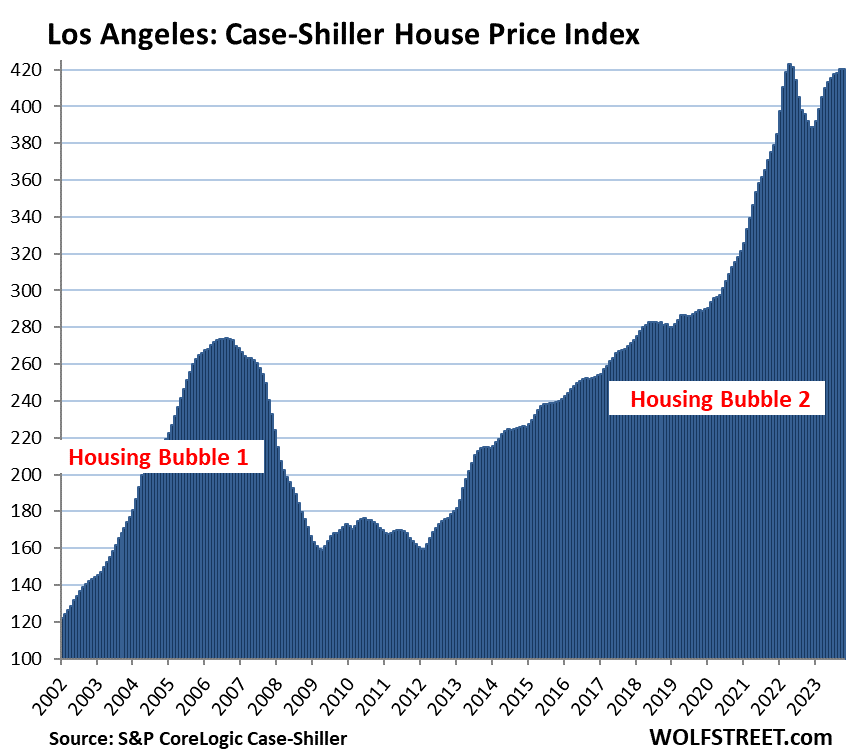
Los Angeles metro
- Month to month: +0.1%.
- Year over year: +7.2%.
- From the peak in May 2022: -0.6%.
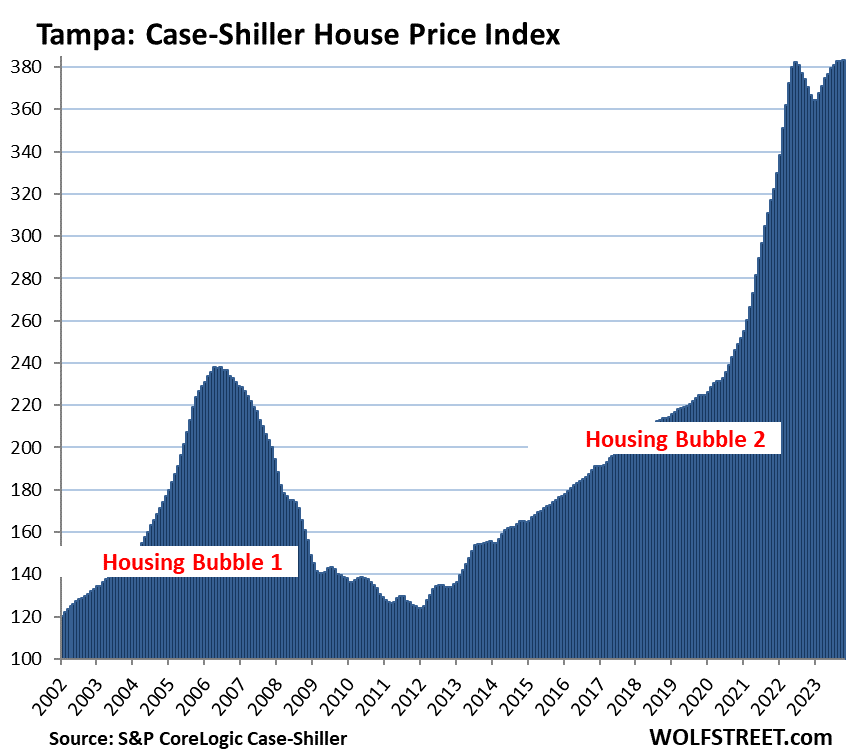
Tampa metro:
- Month to month: +0.1%.
- Year over year: +3.4%.
- New high.
Washington D.C. metro:
- Month to month: -0.3%.
- Year over year: +4.7%.
- The high was in August.
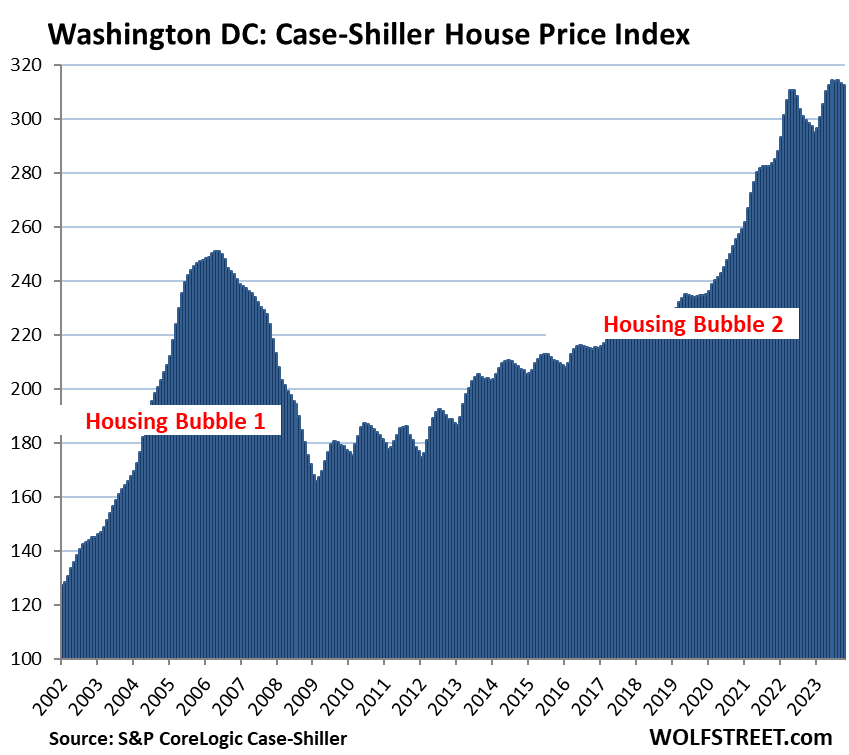
Closeup of Washington DC:

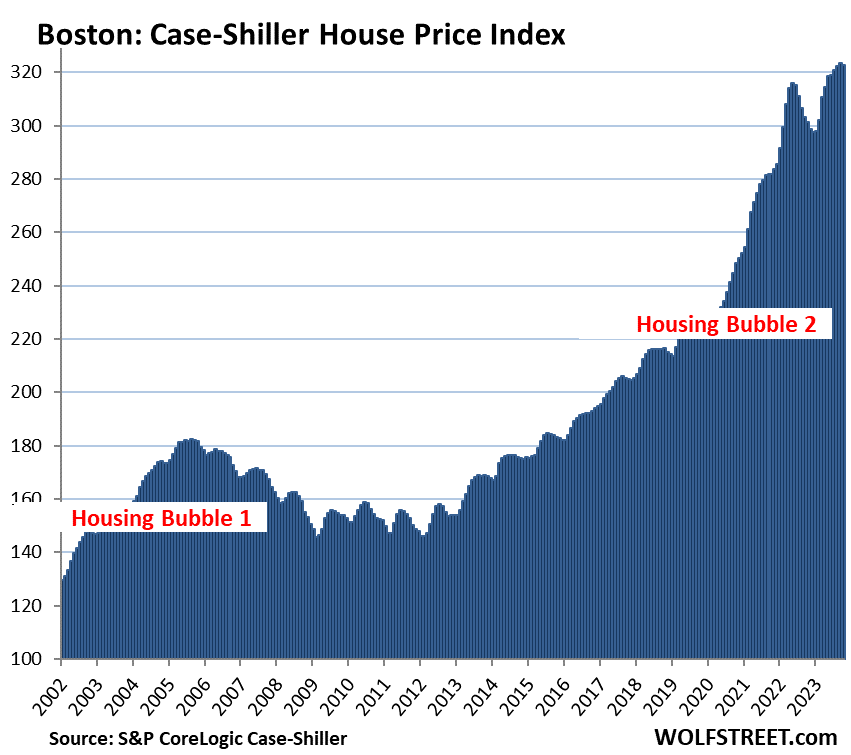
Boston metro:
- Month to month: -0.2%.
- Year over year: +7.1%.
- Prior month was the high.
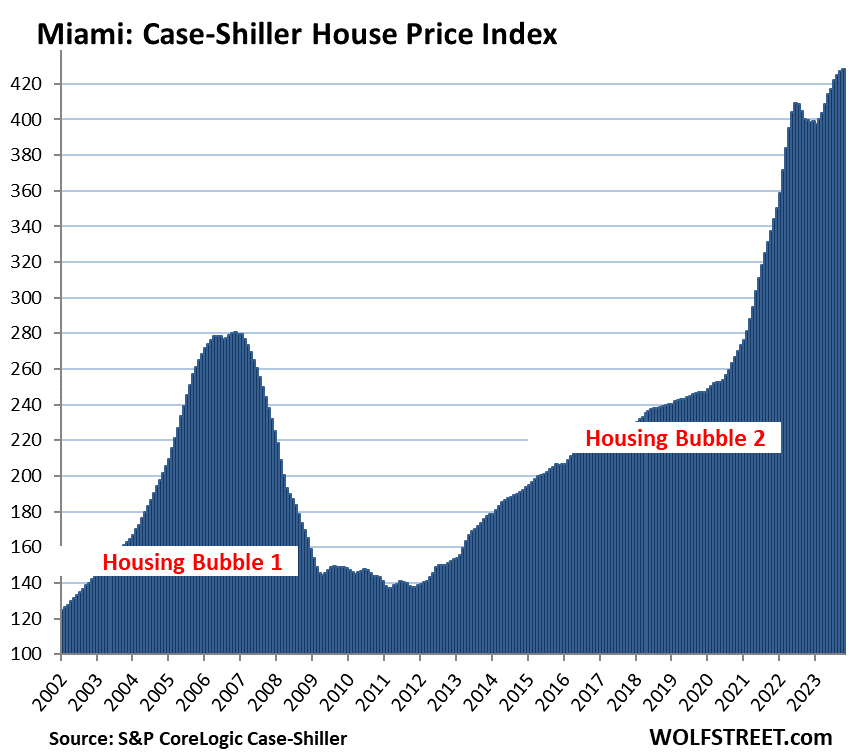
Miami metro:
- Month to month: +0.3%
- Year over year: +7.2%.
- Set new high.
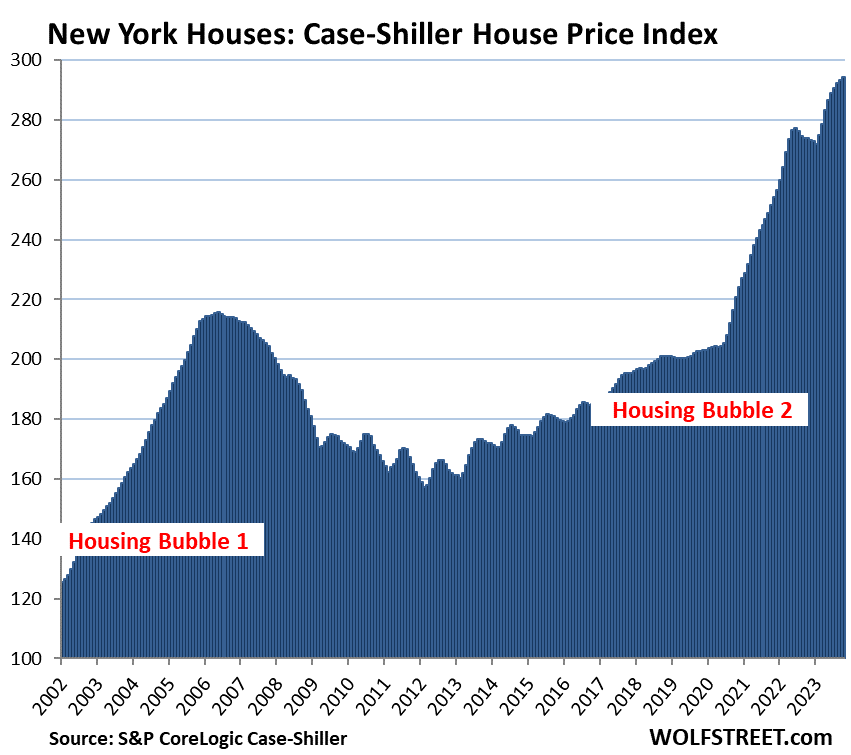
New York metro:
- Month to month: +0.3%.
- Year over year: +7.4%.
- Set new high.
To qualify for the Most Splendid Housing Bubbles, the metro must have experienced home price inflation since 2000 of at least 180%. The indices were set at 100 for the year 2000. Today’s index value for Miami of 428 is up 328% since 2000, making Miami the most splendid housing bubble on this list.
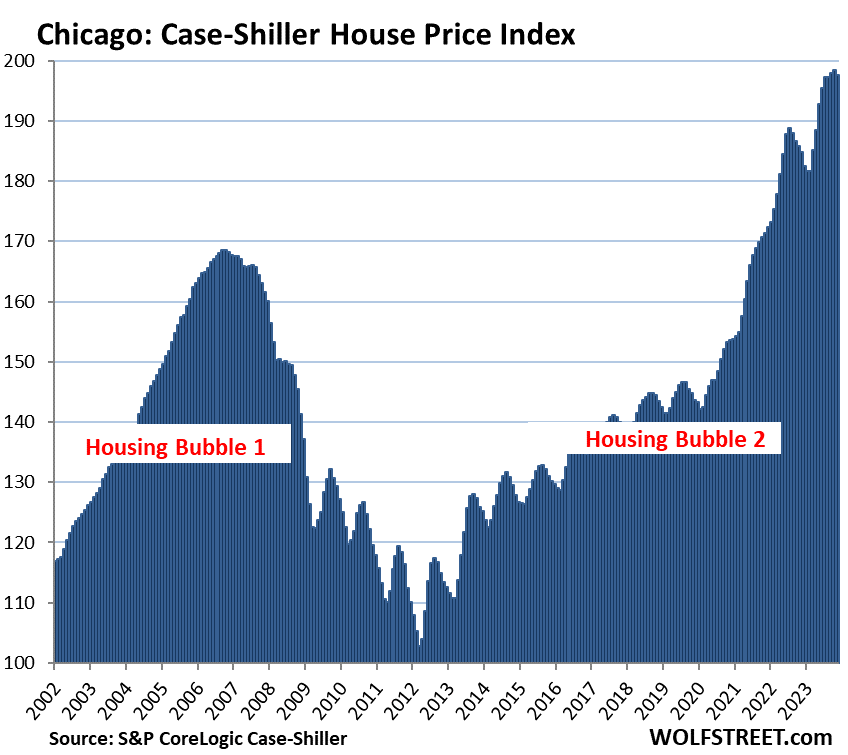
The remaining 6 of the 20 metros in the Case-Shiller index (Chicago, Charlotte, Minneapolis, Atlanta, Detroit, and Cleveland) had far less home price inflation than 180% since 2000, despite the big home price increases in percentage terms in 2022 and earlier in 2023.
Chicago, with an index value of 197 is up by “only” 97% from 2000, and therefore does not qualify for this list of the Most Splendid Housing Bubbles, but it saw blistering price surges since May 2020, and so here it is anyway:
- Month to month: -0.4% from the high in the prior month
- Year over year: +7.0%.
Methodology. The Case-Shiller Index uses the “sales pairs” method, comparing sales in the current month to when the same houses were sold previously. The price changes are weighted based on how long ago the prior sale occurred, and adjustments are made for home improvements and other factors. This “sales pairs” method makes the Case-Shiller index a more reliable indicator than median price indices (37-page methodology).
Home-Price Inflation. By measuring how many dollars it takes to buy the same house over time – the “sales pairs” method – the Case-Shiller index is a measure of home price inflation. So Miami had 328% home price inflation since 2000. By comparison, consumer price inflation, as measured by the CPI, which tracks price changes of goods and services that consumers “consume,” was 82% over the same period (our discussion: Beneath the Skin of CPI Inflation).
STAY INFORMED! Receive our Weekly Recap of thought provoking articles, podcasts, and radio delivered to your inbox for FREE! Sign up here for the HoweStreet.com Weekly Recap.
Wolf Richter January 30th, 2024
Posted In: Wolf Street