ALWAYS CONSULT YOUR INVESTMENT PROFESSIONAL BEFORE MAKING ANY INVESTMENT DECISION

October 28, 2023 | Powell’s Gonna Have a Cow When He Sees the PCE Inflation in “Core Services,” Housing, and Non-Housing Core Services

Wolf Richter


The spike in inflation in “core services” (all services except energy services) was the big nasty surprise – inflation is infamous for dishing up nasty surprises – in today’s release of the PCE price index for September. “Core services” is the index that Fed chair Jerome Powell has been hammering on, especially “core services without housing” because housing inflation is already coming down, and it’s just lagging etc., etc., and so the other core services were in his focus because their inflation rates sort of refused to come down.
But in today’s installment of our inflation soap opera, the nasty surprise was driven by – fake laughter in the background – a spike in housing inflation. And it came on top of some nasty spikes in some of the other core services.
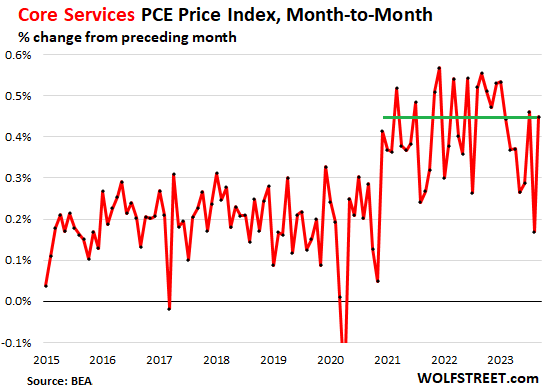
So the “Core Services” PCE price index spiked by 0.45% in September from August (5.5% annualized), driven in part by the spike in housing, and in part by even bigger spikes in three of the remaining six core services categories. Note the head-fake deceleration in August:
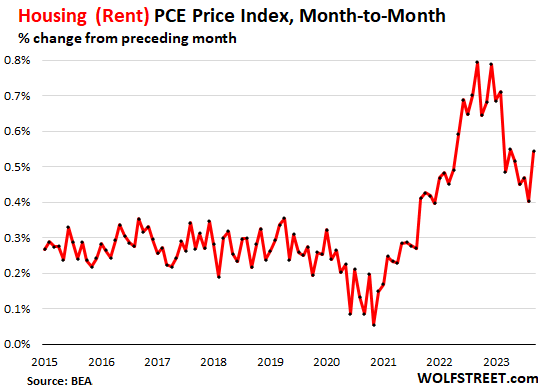
Housing.
The PCE price index for housing, which is composed of various rent factors, spiked by 0.54% in September from August (6.7% annualized).
This brought the 6-month average to over 6% annualized. That’s still down from the red-hot raging rent inflation in 2022 which topped out at 10% annualized! But 6%-plus annualized is far hotter than hoped for. Year-over-year, the PCE index for housing decelerated to 7.2%. All of it confirms what big landlords have been saying this year, that they’re getting 6%-plus increases on renewals and new-lease signings. So that’s where we are, 6%-plus rent inflation.
The seven “core services” categories.
Housing inflation was a big driver in the core services spike. But that’s only one of the seven core services categories. Three categories had even bigger month-to-month spikes than housing; two rose more moderately, and one dipped:
| Core services categories | MoM | Annualized | Includes |
| Transportation services | 1.80% | 24.0% | auto repair & maintenance, auto leasing & rentals, public transportation, airfares, etc. |
| Food services, accommodation | 0.84% | 10.6% | meals & drinks at restaurants, bars, schools, cafeterias, etc.; accommodation at hotels, motels, schools, etc. |
| Recreation services | 0.64% | 8.0% | concerts, sports, movies, gambling, streaming, vet services, package tours, etc. |
| Housing | 0.54% | 6.7% | rents |
| Finance & Insurance | 0.31% | 3.8% | fees & commissions at banks, brokers, funds, portfolio management, etc.; all kinds of insurance |
| Non-energy utilities | 0.23% | 2.8% | water, sewer, trash |
| Other services | -0.04% | 0.5% | a vast collection of other services |
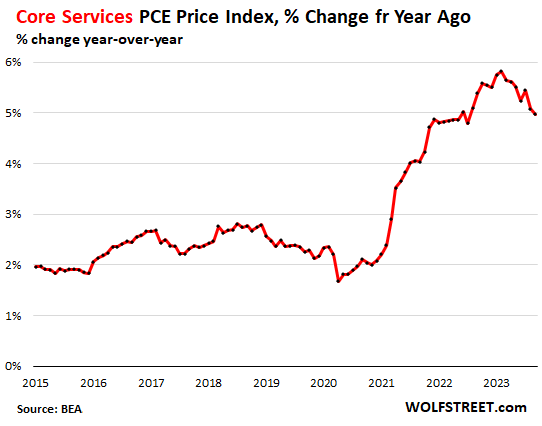
Year-over-year, the core services PCE price index decelerated to 5.0%, in part due to the base effect, given the red-hot spikes last year at this time:
Powell is going to talk about this at the press conference.
That’s exactly the data he is looking at and talking about. He has been talking about it for over a year because the index for core services without housing has been one of the frustrating elements, where inflation has gotten entrenched and is hard to dislodge from.
And now housing refuses to do what it was supposed to do and was expected to do – vanish as a source of inflation.
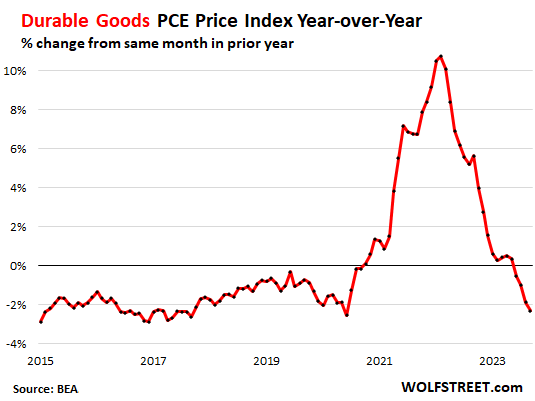
Durable-goods PCE price index is normalizing.
But the durable-goods PCE price index changes are still negative, driven by motor vehicles which dominate durable goods:
- Durable goods: -0.1% MoM; -2.3% YoY
- Motor vehicles 7 parts: -0.84% MoM; -1.4% YoY
- Furnishings, durable household goods: -0.38% MoM; -2.7% YoY
- Recreational goods and vehicles: +1.2%; -4.3%
- “Other” durable goods: -0.81%; +0.6%.
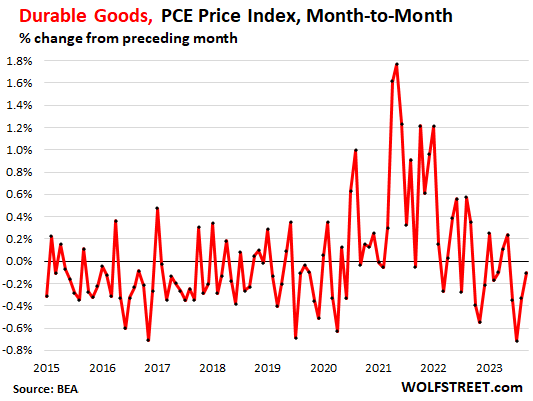
Year-over-year, the durable goods PCE price index fell 2.3%. The natural state for this index is with negative values – as we’ve seen in the years before the pandemic. This is a result of manufacturing efficiencies, offshoring, competition, and “hedonic quality adjustments” that remove the costs of improvements, on the principle that consumer price inflation is the change in dollars to buy the same product over time, and the costs of improvements to the products are not inflation. Here is my explanation of hedonic quality adjustments.
Prices of durable goods are still high but are coming down from the ridiculous price spikes of 2021. The dynamics are particularly driven by used vehicles, whose prices have been dropping for over a year, though they’re still way too high:
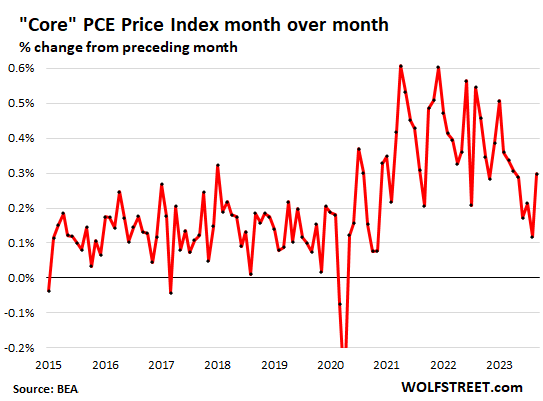
The core PCE price index re-spikes.
Driven by the spike in core services, minus the drop in durable goods, the core PCE price index, which excludes food and energy products and services, accelerated to 0.30% in September from August, the biggest increase since April,
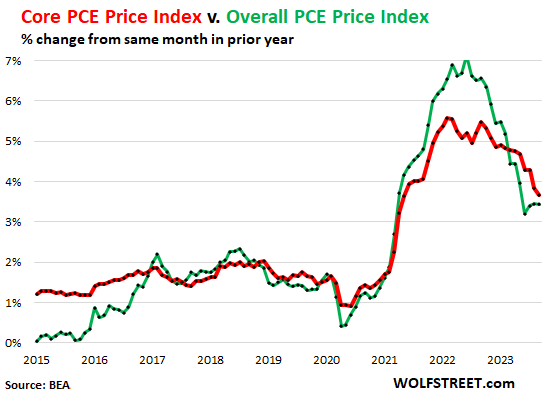
Year-over-year, the “core” PCE price index, decelerated to 3.7% (red line). The overall PCE price index remained at 3.4% year-over-year, as food and energy prices ticked up moderately:
- Energy prices: +0.20% MoM; +1.8% YoY
- Food & beverage for off-premise consumption: +0.30% MoM; +2.7% YoY
STAY INFORMED! Receive our Weekly Recap of thought provoking articles, podcasts, and radio delivered to your inbox for FREE! Sign up here for the HoweStreet.com Weekly Recap.
Wolf Richter October 28th, 2023
Posted In: Wolf Street