ALWAYS CONSULT YOUR INVESTMENT PROFESSIONAL BEFORE MAKING ANY INVESTMENT DECISION

February 24, 2024 | Trading Desk Notes For February 24, 2024

Victor Adair


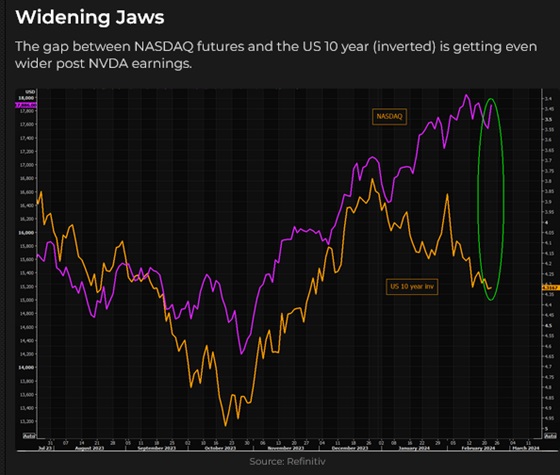
The most important stock in the world
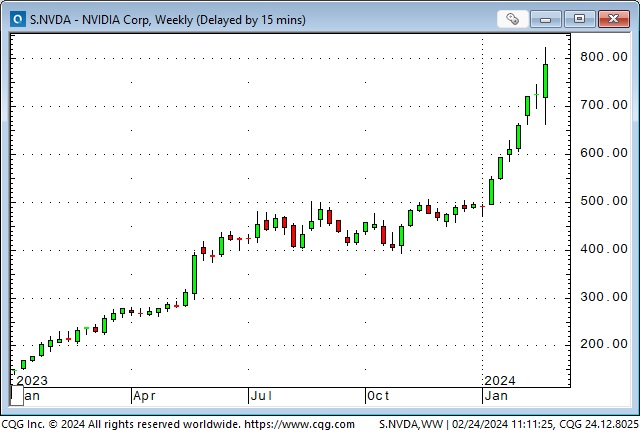
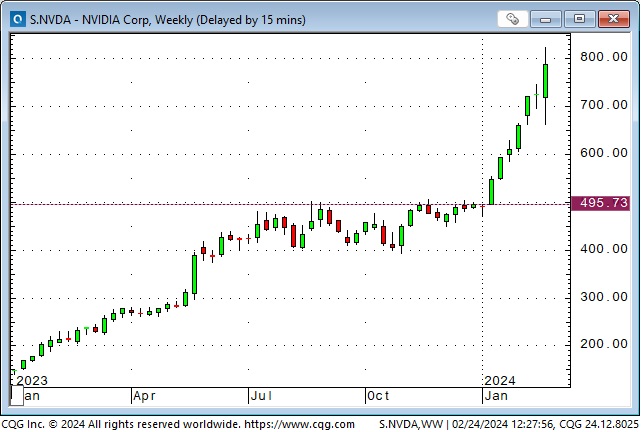
NVDA market cap soared >$300 Billion on Thursday (day session and aftermarket) to >$2 Trillion. This was the largest ever one-day market cap gain by an individual stock. The increase was equivalent to over TWICE the market cap of RBC, the largest stock on the TSE.
The rally in NVDA’s share price stalled last week below $750 and fell >$80 from Monday’s high to Wednesday’s low as traders took profits ahead of the quarterly report after the close on Wednesday. This 3-day correction set up the massive gain on Thursday when the report was better than expected.
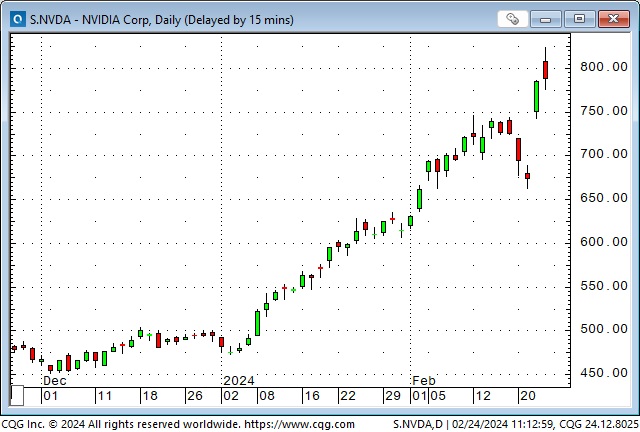
NVDA is up >100% from the end of October when stock markets worldwide began a steep rally on expectations that the Fed was done raising interest rates and would soon start cutting, but the rally kicked into “overdrive” on January 8 when prices rallied to a new All-Time High.
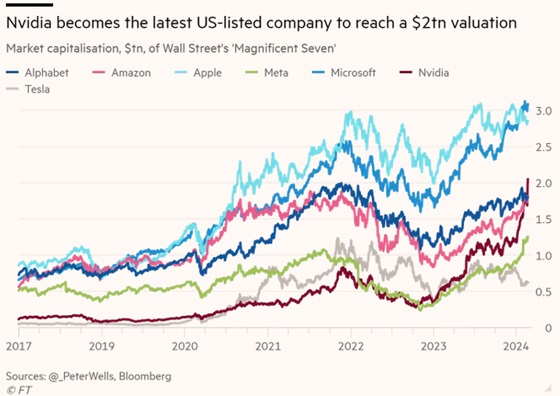
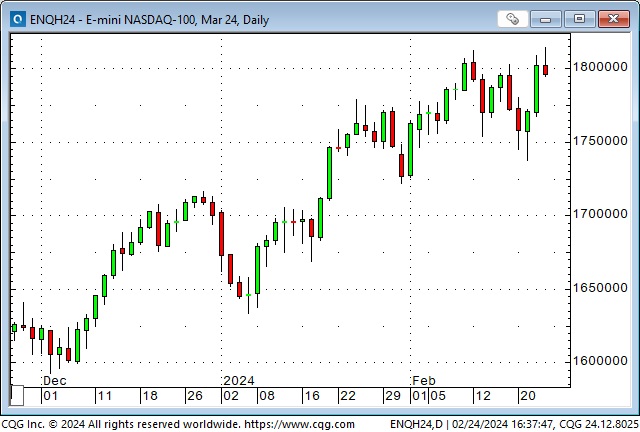
Stock indices worldwide rallied with NVDA’s surge above $2 Trillion. The S&P, DJIA, Nasdaq 100, the Euro Stoxx 600, and the Indian Nifty 500 hit All-Time Highs.

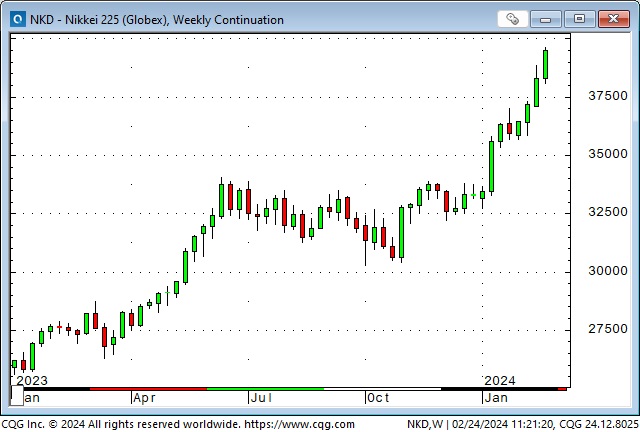
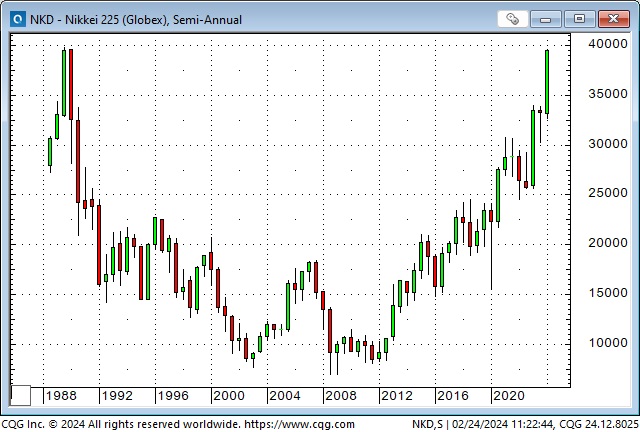
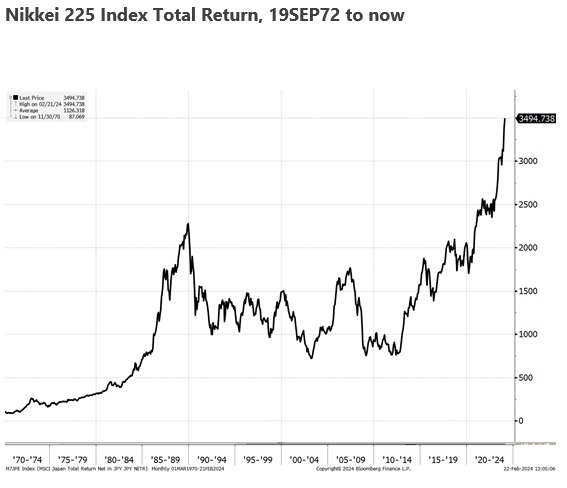
The Japanese Nikkei also hit All-Time Highs this week – topping the 1989 record high.
This Nikkei total return chart from Brent Donnelly reminds us that shareholders benefit from more than just rising share prices.
Stock indices lose their correlation with interest rates
The correlation between stock indices and interest rates comes and goes, but from late July to late October last year, as bond yields rose to 16-year highs and Fed speakers warned of “higher for longer,” the S&P reluctantly fell over 10%.
But around the end of October and continuing into November, Fed speakers “changed their tune,” indicating that they were done raising rates and might soon contemplate cutting rates. This was a Green Light Special for stock market sentiment, and the leading stock indices surged higher as markets priced in more and more cuts.
This chart from TS Lombard (h/t Kevin Muir) shows that expectations for the number of 25 bps cuts from the Fed by Jan 2025 increased from ~2 to ~7 (dark green line – left scale) between the end of October and the end of December 2023.
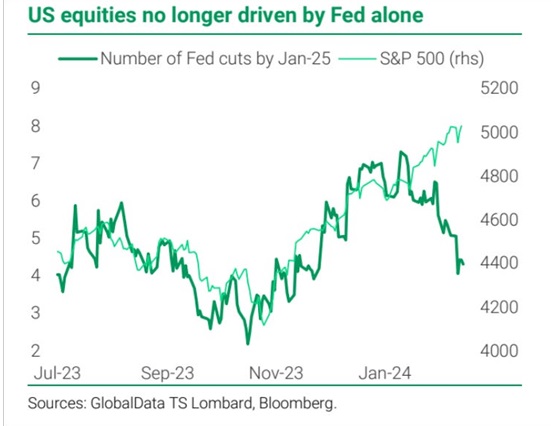
Since the end of December, however, expectations for interest rate cuts fell from ~7 to ~4 as employment stayed robust and economic activity didn’t fade, inflation ticked higher, and Fed speakers indicated they were in “no rush” to cut rates – but the S&P (and other stock indices) continued to rally!
Something other than falling interest rates has been driving stock market sentiment YTD. What could it be?
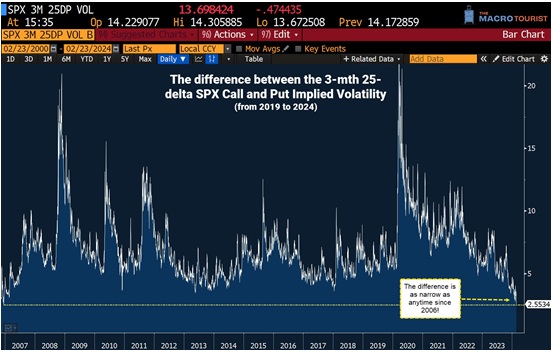
Stock market sentiment
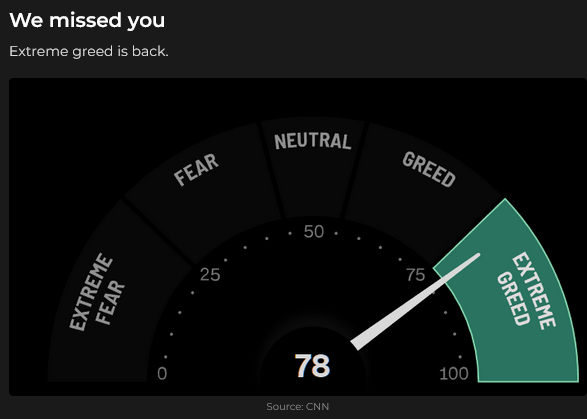
This chart from Kevin Muir shows that the premium for puts over calls has shrunk to a 16-year low. (S&P puts historically trade rich to calls as the prospect of a huge price drop is “more likely” than a huge price jump – see the spike in put premiums in early 2020 when covid hit.)
Other markets
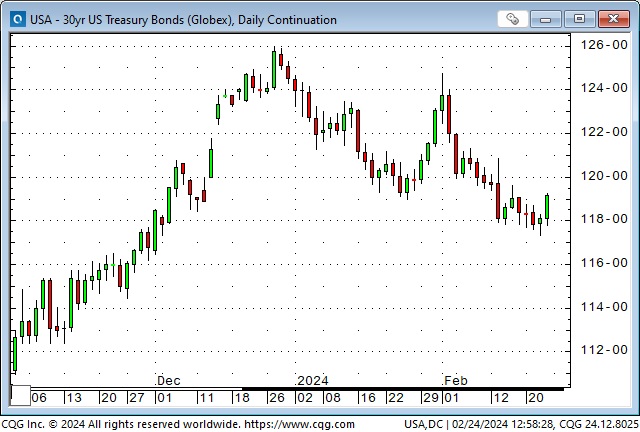
Bond prices hit 16-year lows in October (10-year yields hit ~5%) and then had a terrific rally into December on expectations that the Fed tightening cycle had ended. The long-end rally was overdone (just like the short-end rally was overdone), and prices turned lower in late December (10-year yields ~3.8%) as investors contemplated an issuance tsunami to fund never-ending government deficits. Bond prices rallied a bit this week as 1) the Fed is in “no rush” to cut short rates and 2) bonds may be a haven if equity markets break.
Currencies
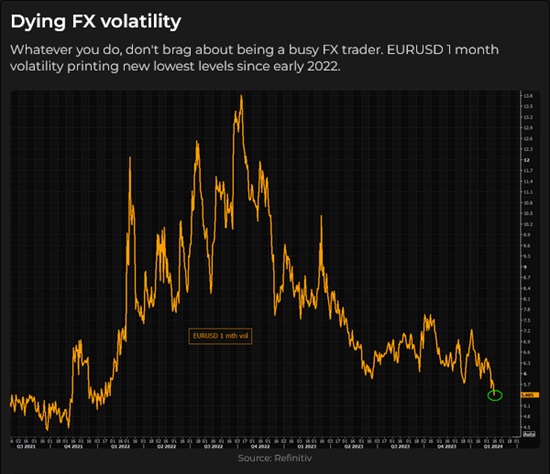
Currencies have been as dull as dishwater, with FX volatility at 2-year lows.
The US Dollar Index rallied from July to October as markets reluctantly “came around” to the Fed staying “higher for longer,” then fell into late December as the Fed seemed to signal interest rate cuts.
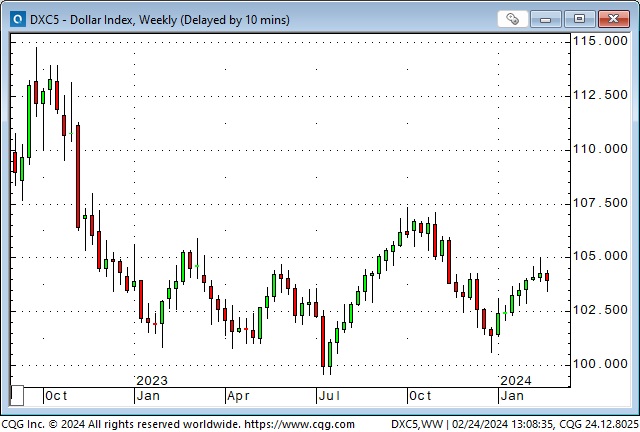
The USDX has rallied a bit YTD as the number of expected Fed cuts has been reduced, and the date of the first cut has been pushed further into the future (now June instead of March.) The US Dollar may also benefit from expectations that Europe is “struggling,” that the BoJ is in no hurry to change monetary policy and that American equity markets continue to draw capital from the rest of the world. (Money comes to America for safety and opportunity.)
Gold
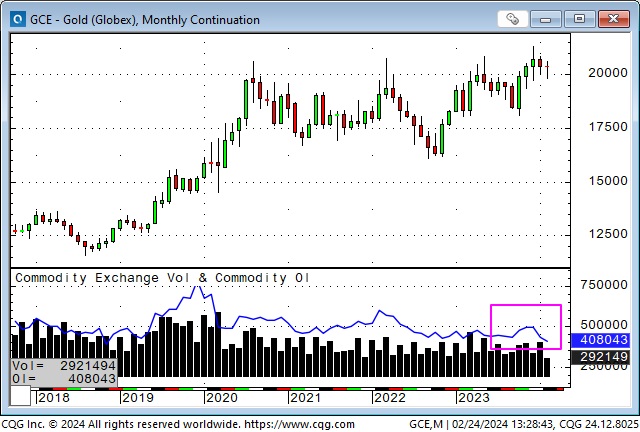
Like currencies, gold has been as dull as dishwater, with volatility at 4-year lows.
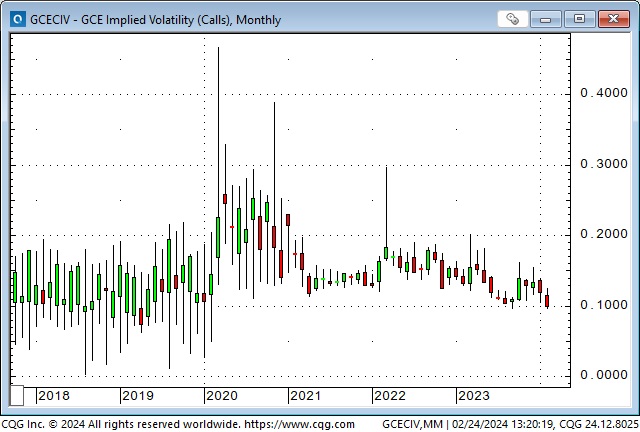
Open interest has fallen to fresh 6-year lows even though prices are only ~5% below All-Time Highs.
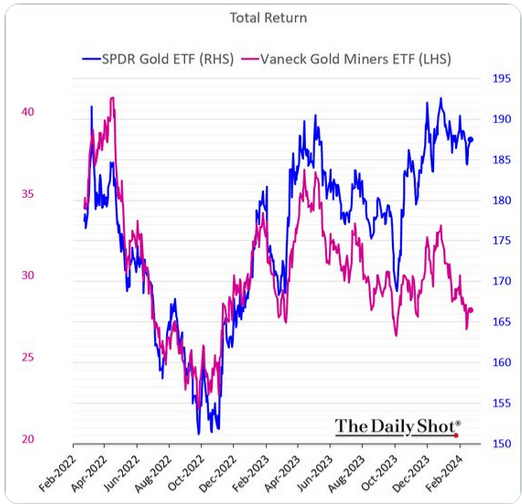
Gold shares continue to underperform gold, and gold continues to underperform Bitcoin.
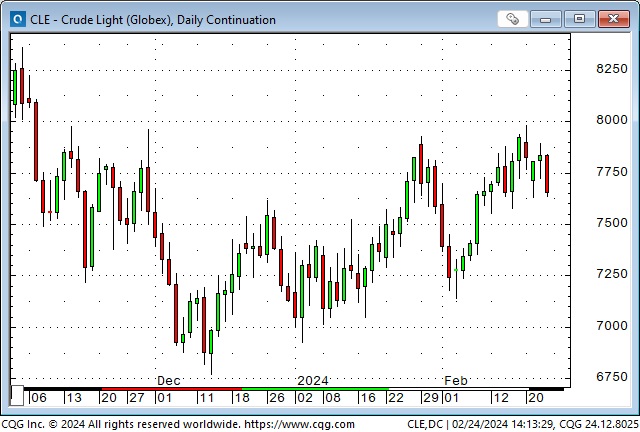
Energy
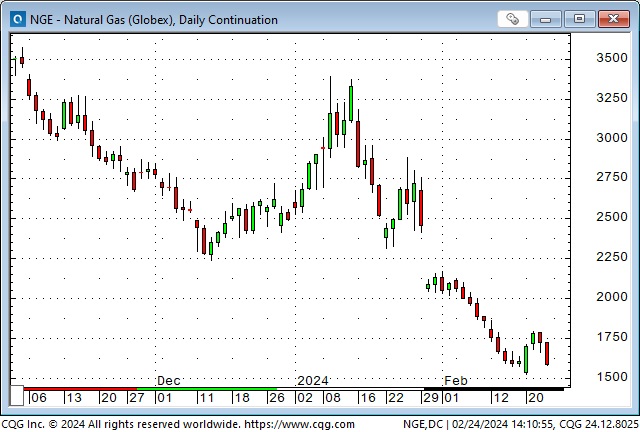
Natgas bounced from multi-year lows early this week but couldn’t sustain the gains.
WTI traded to 3-month highs early in the week but closed on Friday below last week’s close. (Risk premium down on rumours of Israeli/Hamas negotiations?)
Check out the free access to my friend Josef Schachter’s weekly Eye on Energy for a comprehensive review of developments in the oil and gas markets.
Uranium issues continued their slide from multi-year highs reached on February 1.

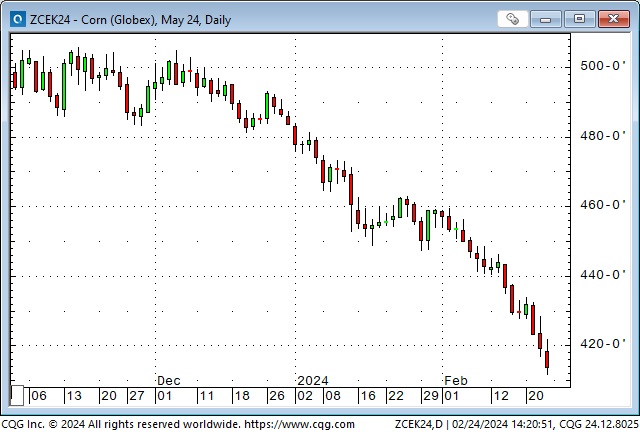
Grains
Corn and soybeans extended their losses to new 4-year lows, with commercial accounts increasing their net long positioning to new 4-year highs.
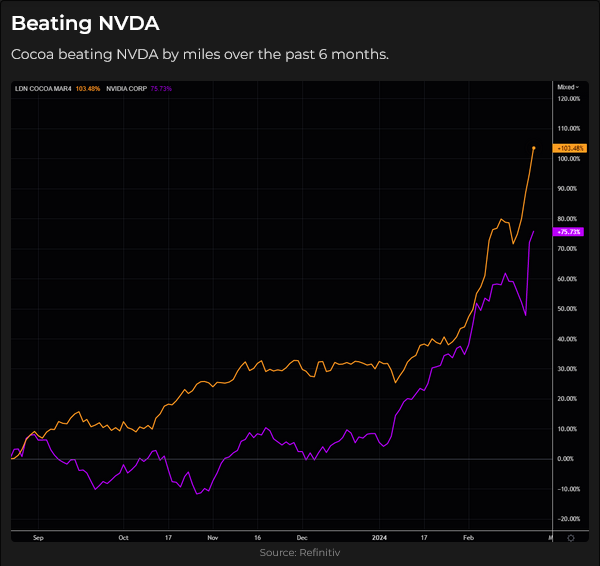
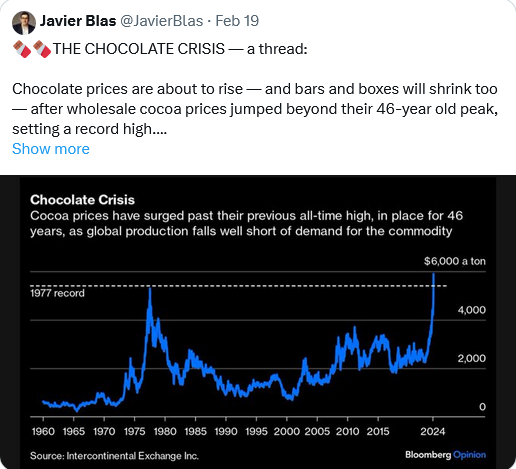
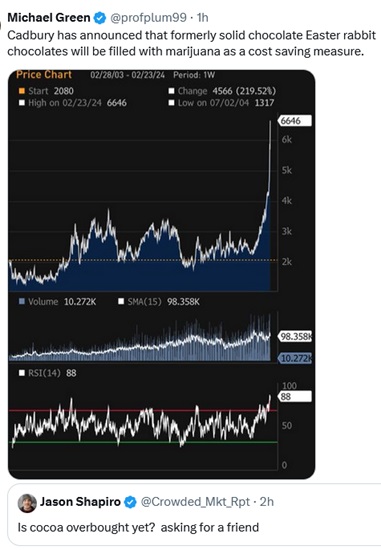
Cocoa
My short-term trading
I started this week with a short S&P position established on Friday last week. I was ahead by ~80 points on the trade at Wednesday’s lows before the NDVA report. I chose to stay with the position going into the report because I’ve been looking for a substantial correction (at least 5 – 10%.) I lowered my stop, and it was hit in the Wednesday O/N market. I was out with a 10-point profit.
I shorted the market again on Friday and held the position into the weekend, thinking the rally was exhausted. (The NAZ hit a new ATH on Friday’s open but closed on the day’s low.)
On my radar
The February US employment reports are due this week, and the NFP report will be on Friday, March 1. Any significant change in the employment picture could dramatically impact financial markets.
Just as I’ve been watching for a reversal in the equity markets, I’m watching for signs of a reversal in the Yen (at 34-year lows), Corn, Soybeans, and Natgas. (Not cocoa!)
Thoughts on Trading
I’m trading price action from the perspective of sentiment and positioning. For instance, equity market sentiment is very bullish, and positioning is very aggressive. I will get short if short-term price action looks like a breakdown. I’m trading small size, and I will take losses quickly because the trend is up on a weekly time frame. If the market develops downside momentum, I’ll try to add to my position.
A minor breakdown in stock indices could trigger a much deeper correction as various “trend-following” systems start reducing their accumulated size.
The S&P has rallied ~21% in four months to All-Time Highs, closing higher for 15 of the last 17 weeks. It is up ~45% in 16 months, ~130% from the covid lows, and 7.5X from the 2009 lows. I’m not arguing that there haven’t been good reasons for the rally, but the current complacent bullishness (and irrational exuberance!) leaves the market vulnerable to a correction.
Inflation is not going back to 2% or less because governments are addicted to deficit spending = more debt = diminished purchasing power of currencies = higher inflation as people try to “catch up” to rising prices and wages.
Retail sales are down. The cost of things people want/need to buy is rising faster than CPI, causing a slowdown in sales among people not benefiting from the “wealth effect” of rising stocks and real estate. These are the same people who likely hold most of the $1.1 trillion in credit card debt, with interest rates now averaging 21.5%.
There are two groups of consumers: 1) people with good incomes and profitable investments and savings (who can afford to pay rising prices) and 2) others who are increasingly left behind. This bifurcation will increase social tensions and impact elections.
I’ve searched for estimates of a percentage breakdown between groups one and two. I found that approximately 50% of all credit card holders don’t pay off their debt monthly.
The Barney report
Barney is two and a half years old, and he is getting better at doing what I ask him to do. For instance, when we go for an off-leash forest walk, he loves to run off into the woods, but he is getting much better at coming back to me when I whistle. In this photo, he is patiently sitting beside my chair, but he has his eye on a milk bone (that will soon be his!) sitting on the edge of my desk.

Barney loves to be outside. His idea of a great time is running at a full gallop with a stick in his teeth.

Listen to Victor talk about markets
I did a 9-minute interview with Mike Campbell on his Moneytalks show this morning. We discussed Nivida and how it helped fuel bullish sentiment in stock markets worldwide. We also discussed how markets have reduced expectations for interest rate cuts and how the stock market doesn’t seem to care, and we talked about Japan and the Yen: how the Nikkei has finally recovered to the 1989 highs and how the cheap Yen makes Japan such a bargain. You can listen to the entire show here; my spot with Mike begins around the 47-minute mark.

I did my monthly 30-minute interview with Jim Goddard on the “This Week In Money” podcast last Saturday. Jim and I discussed how I feel about the irrational exuberance in the equity markets! We also discussed gold, currencies, interest rates, cocoa, and natural gas. I gave him a 2-minute summary of my speech on the energy markets at the recent World Outlook Financial Conference. You can listen to the interview here.
Online streaming video access to The World Outlook Financial Conference: https://mikesmoneytalks.ca/
The Archive
READERS CAN ACCESS WEEKLY TRADING DESK NOTES GOING BACK SEVEN YEARS BY CLICKING THE GOOD OLD STUFF-ARCHIVE BUTTON ON THE RIGHT SIDE OF THIS PAGE.
Headsupguys
There’s a reason I put a link to Headsupguys in my Notes every week. I’ve had friends who took their own lives, and Headsupguys helps men struggling with depression.

STAY INFORMED! Receive our Weekly Recap of thought provoking articles, podcasts, and radio delivered to your inbox for FREE! Sign up here for the HoweStreet.com Weekly Recap.
Victor Adair February 24th, 2024
Posted In: Victor Adair Blog
Next: The Fallacy of the Wall of Worry »