ALWAYS CONSULT YOUR INVESTMENT PROFESSIONAL BEFORE MAKING ANY INVESTMENT DECISION

December 23, 2023 | Trading Desk Notes For December 23, 2023

Victor Adair


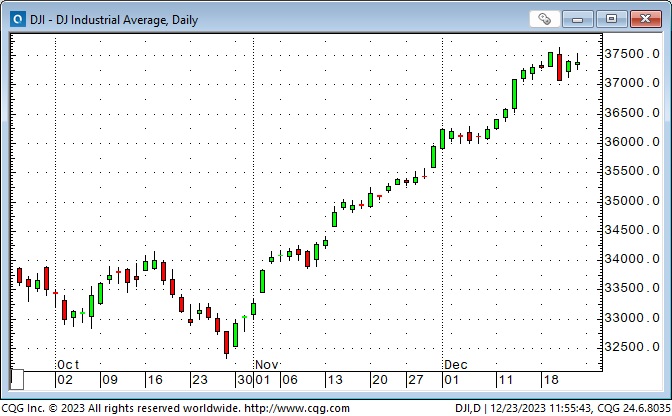
DJIA and NAZ hit All-Time Highs after closing higher for eight consecutive weeks
Who would have thought, back in October, with stock market sentiment crushed under the weight of “higher for longer” and the 10-year Treasury yielding more than 5% (a 16-year high) that eight weeks later, the venerable DJIA would have rallied over 5,300 points (16.5%)? That’s an average gain of ~143 points per day for the 37 trading days (that’s all!) between the October lows and Wednesday’s ATH.
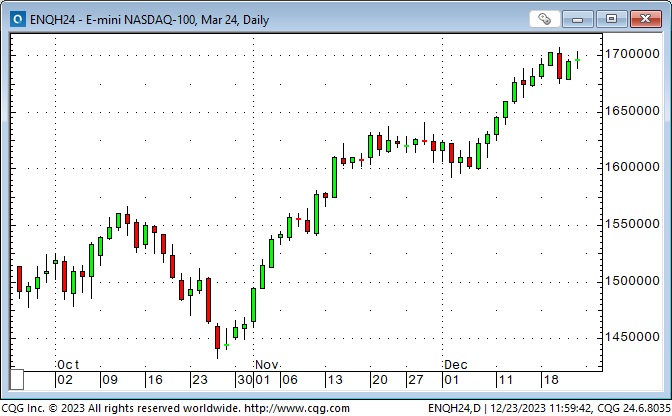
The NAZ rallied ~20% from October lows to Wednesday’s All-Time Highs.
The Russell 2000 rallied ~25% from October lows to Friday’s highs as small caps went from shunned to chased!

The Euro STOXX 50 rallied ~15% from October lows to last week’s highs.

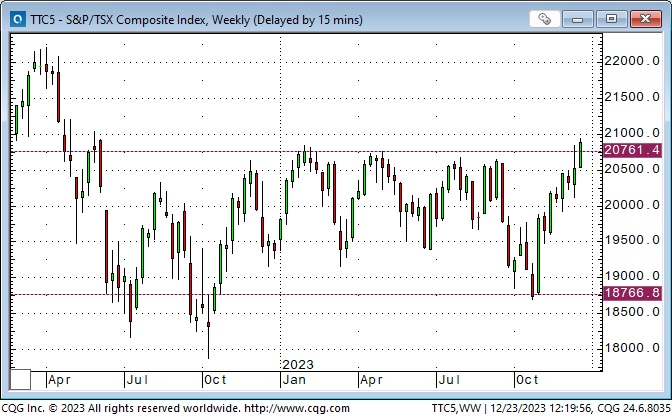
The Toronto Composite rallied ~12% from October lows and broke out of a 19-month sideways range.
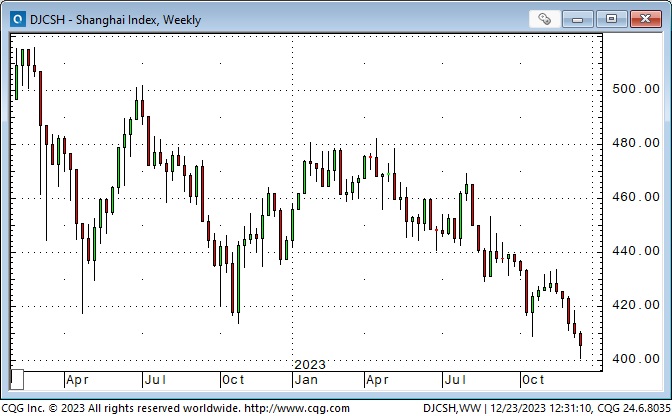
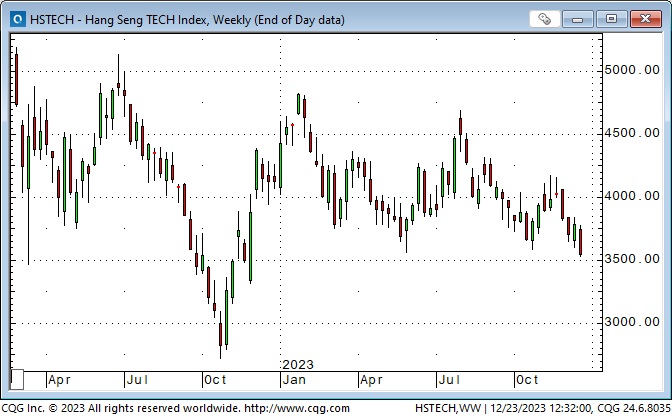
Meanwhile, in China, the Shanghai Index hit a 44-month low, and the Hang Seng Tech Index made a new YTD low. (Forget it, Jake. Its Chinatown.)
Interest rates
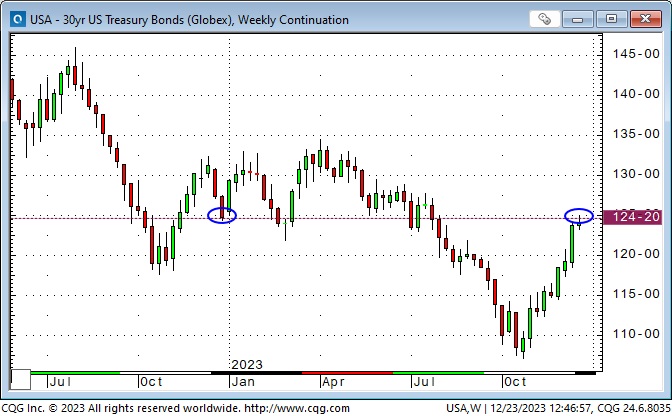
The long bond futures made a 16-year low on October 23, then traded higher for the next eight consecutive weeks – returning to breakeven with last year’s close. The 30-year Treasury yield fell from a high of ~5.1% in October to a low of ~3.99% this week.
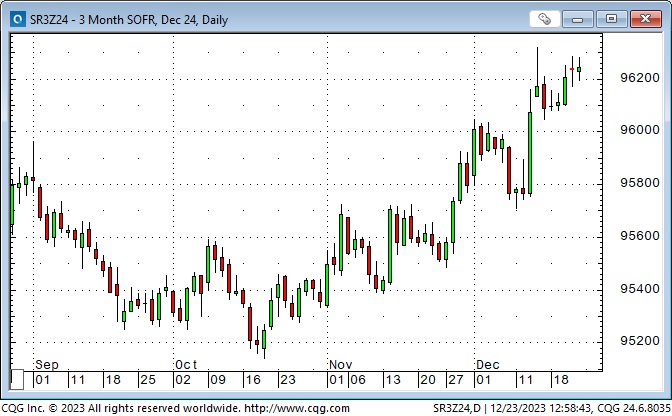
The 3-month SOFR December 2024 futures rallied ~110 points from October’s low to Friday’s close, pricing short rates twelve months from now to be ~160 bps points below current levels.
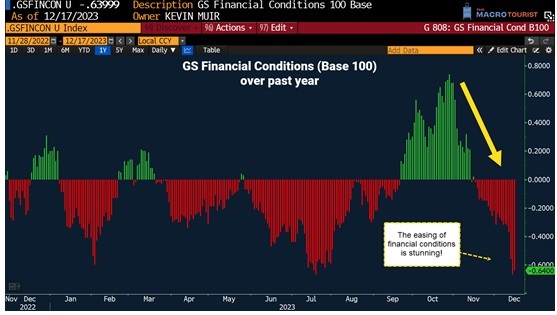
Here’s a chart from my friend Kevin Muir, The Macrotourist, showing the DRAMATIC easing in Goldman Sachs’ financial conditions index from mid-October to now.
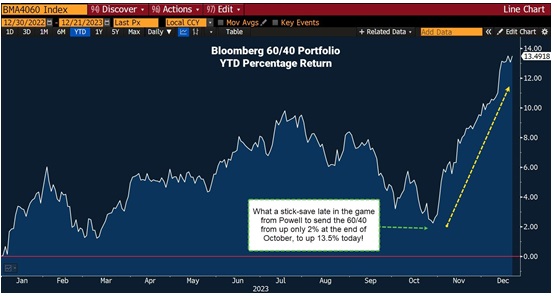
This chart from Kevin shows the DRAMATIC improvement in the classic 60/40 portfolio over the last eight weeks.
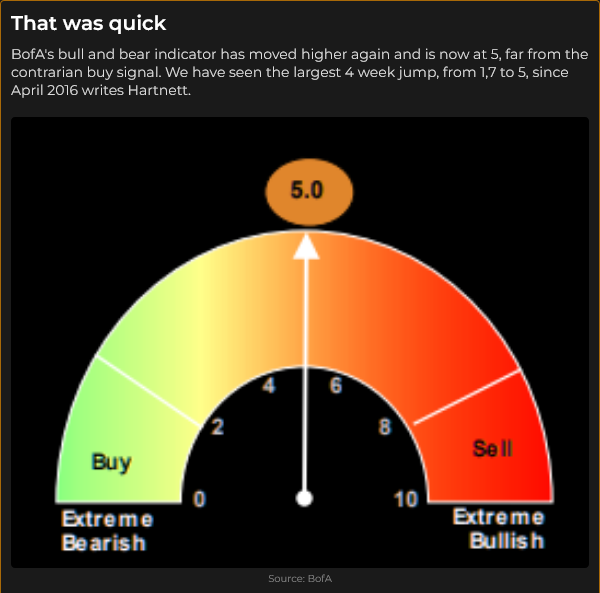
The latest Bank of America Global Fund Manager Survey shows that 62% (a 20-year high) of respondents expect bond yields to continue falling.
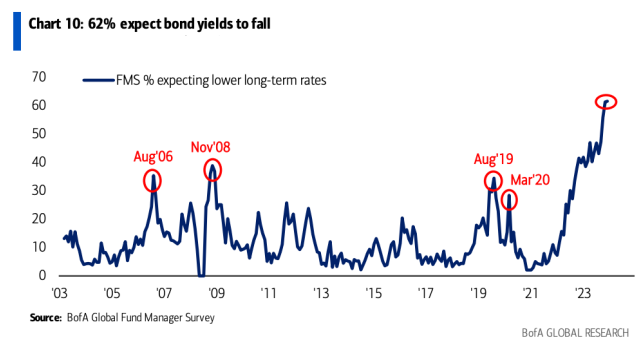
The fund managers love bonds here. Commodities? Not so much.

Currencies
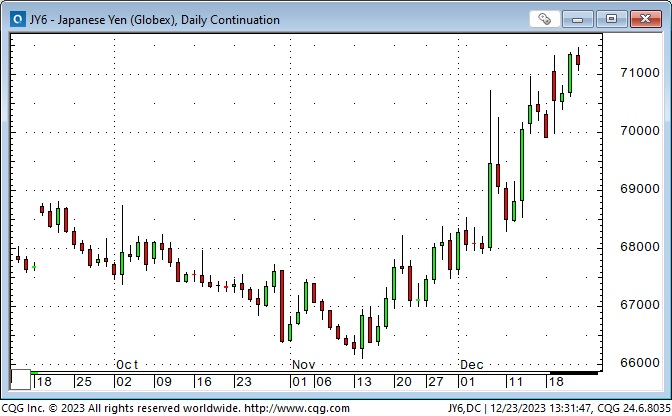
The Japanese Yen hit a 33-year low in November (down ~50% from 2011 ATH) but has rallied back ~7.5% as traders front-run an anticipated policy tightening from the BoJ and as the USD weakens against virtually all currencies.
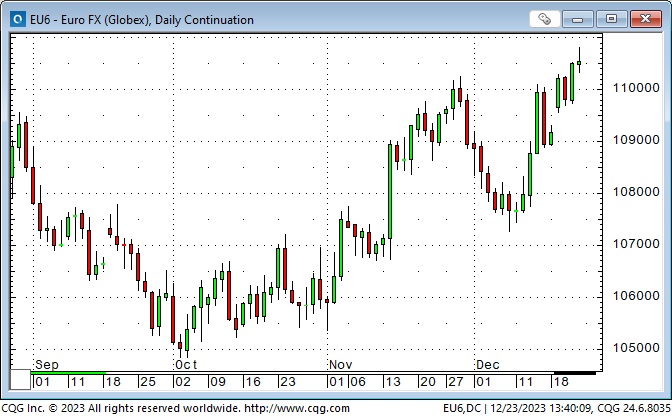
The Euro (The Anti-dollar) has risen to a 5-month high as traders price in the FOMC cutting interest rates more aggressively than the ECB in 2024. (I’ll take the other side of that trade, but wait until I see signs that this rally has run its course.)
Even the Canadian Dollar has rallied from 12-month lows in early November when net short speculative futures positioning hit a 7-year high. (I expected short-covering to boost the CAD, but as of December 23, the net short speculative position has only dropped from ~70,000 contracts to ~54,000 contracts. Those shorts either have a much longer time horizon and/or a much greater risk threshold than I have!) I subscribe to and sincerely recommend Jason Shapiro’s Crowded Markets Report for great charts and insights into the Commitments of Traders data.

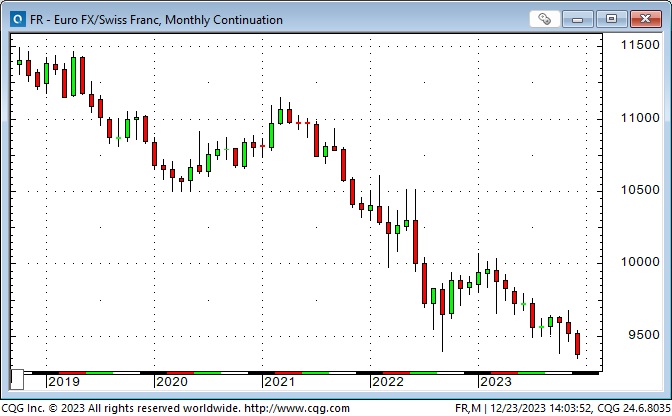
The Swiss Franc traded to a 12-year high against the USD this week (X a couple of days in January 2015) and to an All-Time High against the Euro.
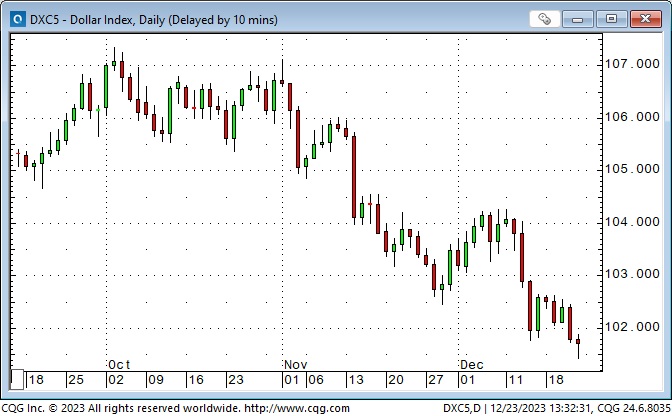
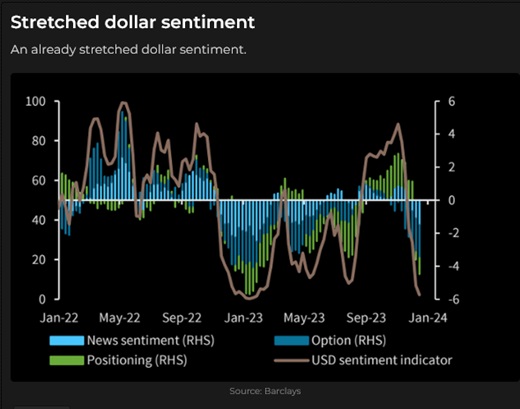
US Dollar sentiment is currently very bearish on a 2-year lookback.
Gold
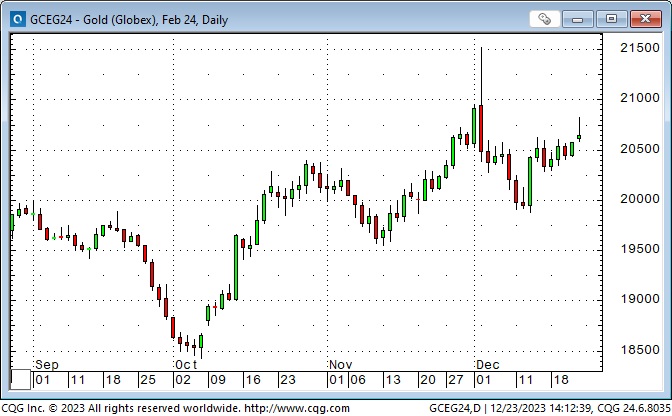
Gold was “unloved” and nearly made a new low for the year in October before the Hamas attacks on Israel caused a spike higher. It traded to All-Time Highs of ~$2150 during the Sunday afternoon session on December 4 but got slammed down ~$150 over the next few days. Since the October lows, gold has benefited from geo-political stress, a weaker USD and sharply lower interest rates.
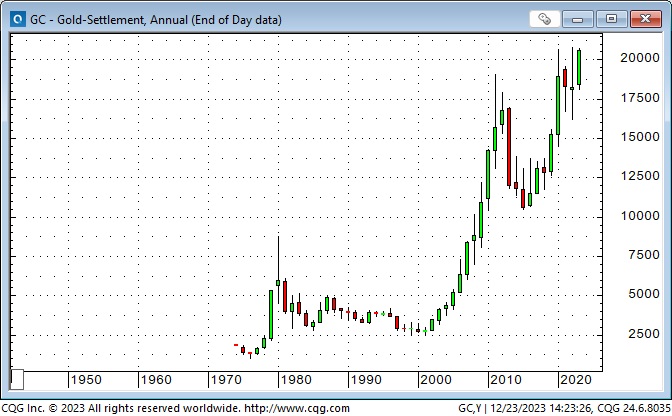
Gold looks like it will generate a new All-Time High Yearly close for 2023, which may be significant for some trading models. (Marty Armstrong comes to mind.)
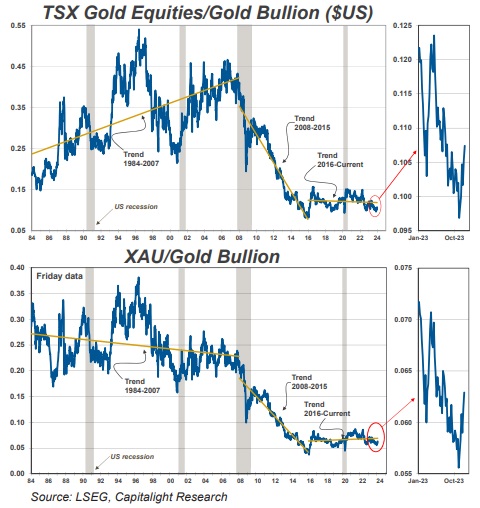
My friend Tony Greer thinks gold shares will do well in 2024. As these two charts from my friend Martin Murenbeeld show, shares of gold mining companies have hugely underperformed gold for years – maybe it’s time for a rebound! (If gold prices jump, that may increase operating margins for gold miners, which could mean investors see gold miners as a leveraged play on gold, which could mean higher share prices.)
Energy
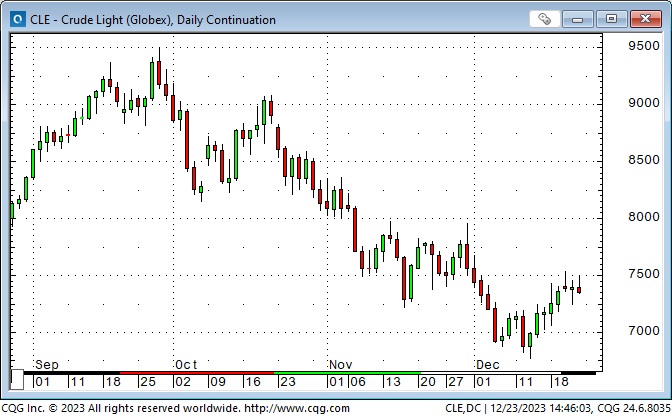
WTI traded at an 11-month high of ~$95 in September, sold off to below $68 last week, then bounced back to ~$72 – 75 this week. At the September highs, the net long spec position was ~350,000 contracts (an 18-month high), which was reduced to ~150,000 last week. That 70% decline in spec long positioning may indicate that the price decline has (more or less) run its course.
For an excellent (free) weekly summary of energy markets, I highly recommend the Eye on Energy report written by my good friend Josef Schachter. His paid subscription service provides in-depth coverage of publicly traded energy shares. Josef and I will speak at the World Outlook Financial Conference at the Bayshore Hotel in Vancouver on February 2 & 3, 2024.
My short-term trading
I started this week with short S&P and CAD positions established late last week. I thought the astonishing S&P rally off the October lows was running out of momentum, but I was stopped for a slight loss when the market traded to new highs on Monday, and I had no position when the market took a sharp break on Wednesday.
I shorted the S&P on Thursday when the bounce back from the Wednesday break looked to be over, but I was stopped for another small loss.
My short CAD position looked okay when the market closed near its lows on Monday, but I covered the trade (before my stop was hit) on Tuesday when the market “refused to go down.”
I went into the Christmas long weekend flat.
Thoughts on trading
I had three small losing trades this week and no winners. My P+L was down ~0.20%. (Like I said, small losses!)
I had developed a “bearish view” on these markets based on positioning and sentiment. I established positions when “market action” seemed to indicate it was an excellent time to put on an initial position based on my market view. When market action showed me that my timing was off, I covered or was stopped out. If market action had confirmed my view, I would still hold the positions and might be looking for a reason/opportunity to add.
I’ve paid attention to COT data since I got to know Steve Briese in the mid-1990s. ( Check out his book The Commitments of Traders Bible, published in 2008.) I’ve looked at several subscription services over the years, and I think I had trouble using COT analysis because my trading time frame was too short. I think the trading time frame of people who “move the markets,” large speculators and commercials, is several weeks to months. (See my comments on the CAD above.)
I like Jason Shapiro’s approach (similar to mine but with a longer-term time frame) of 1) waiting (weeks) for speculators to build an unusually large net position opposite commercials and then 2) waiting for market action to confirm when to put on a trade in line with the commercials. His risk control, again like mine, is to stop out of a short position if the market makes a new high, invalidating the market action signal to go short.
Another aspect of his risk control is trade sizing. Jason has a maximum loss limit on any trade, say X dollars. Before he enters a trade, he knows where he must put his stop (a new high if he is getting short), so he calculates what the loss per contract would be between his entry price and his stop, say Y dollars, and he divides his X loss limit by Y to get the trade size.
The “big picture” theory of using COT data in this way is that the commercial accounts know the market better than the large speculators who usually move from market to market, like macro tourists, or who are using trend-following techniques and “don’t care” about fundamentals.
But as Peter Brandt points out, “big money” can be made when the commercials are “wrong” about the market and have to capitulate.
On my radar
I’ll watch markets next week but probably do limited trading. I suspect “new money” will come into the stock market in the first few days of January, and I’ll watch the price reaction to that. If market prices don’t get a lift from that “new money,” I’ll look closely for a shorting opportunity.
The bond market had a laundry list of reasons to be short in September and October (remember Bill Ackman’s list?), but then “everybody” became bullish as 1) inflation was over and 2) the Central Banks would cut interest rates, and prices rallied in November and December.
There are still good reasons to be short bonds, maybe as basic as a supply/demand imbalance, and I’ll be looking for market action to fade the rally.
Same thing with the currency markets. I will watch for market action to show me opportunities to buy the USD.
The Barney report
Barney loves to run when we are out in the forest, but he also likes to relax and chew on a good stick.

After a good forest run, Barney loves napping in my reading chair – he thinks it’s his chair!

Merry Christmas from our family to yours

Full credit to my wife for the Christmas lights!
Listen to Victor talk markets with Mike Campbell
Mike and I talked about the roaring stock market, the game of “musical chairs” that short-term traders are playing when they think there is “easy money” to be made by selling put options, how the “purchasing power” of our currencies has been diminished and how, in some respects, markets increasingly look like a casino. My segment with Mike starts around the 55-minute mark. You can listen to the entire show here.

Victor talks with Jim Goddard on This Week In Money
Jim and I had our monthly 25-minute chat about stocks, bonds, currencies, gold, the trades I’ve been making and what’s “On My Radar” for 2024. You can listen to the show here.
The World Outlook Financial Conference
Tickets are now on sale for the 2024 WOFC, which will be held at the Westin Bayshore Hotel in Vancouver on February 2 & 3, 2024. Click here for more information and to purchase tickets.
The Archive
Readers can access weekly Trading Desk Notes going back six years by clicking the Good Old Stuff-Archive button on the right side of this page.
Headsupguys
There’s a reason I put a link to Headsupguys in my Notes every week. I’ve had friends who took their own lives, and Headsupguys helps men struggling with depression.

Subscribe: You have free access to everything on this site. S subscribers receive an email alert when I post something new – usually 4 to 6 times a month.
Victor Adair retired from the Canadian brokerage business in 2020 after 44 years and is no longer licensed to provide investment advice. Nothing on this website is investment advice for anyone about anything.
STAY INFORMED! Receive our Weekly Recap of thought provoking articles, podcasts, and radio delivered to your inbox for FREE! Sign up here for the HoweStreet.com Weekly Recap.
Victor Adair December 23rd, 2023
Posted In: Victor Adair Blog
Next: Klaus Wishing You Zee Merry XMas »