ALWAYS CONSULT YOUR INVESTMENT PROFESSIONAL BEFORE MAKING ANY INVESTMENT DECISION

November 28, 2023 | Most Splendid Housing Bubbles in America, Nov. Update: From 2022 Highs, San Francisco -11%, Seattle -10%, Las Vegas -6%, Phoenix -6%, Portland -5%, Denver -5%, Dallas -5%, San Diego

Wolf Richter


Home prices in the 20 metropolitan areas that today’s S&P CoreLogic Case-Shiller Home Price Index covers eked out the smallest month-to-month gain (+0.2%) since January, and remained a tad below its all-time peak of June last year. Here’s the close-up. We’ll get into the most splendid of the 20 metros in a moment in all their individual glory.
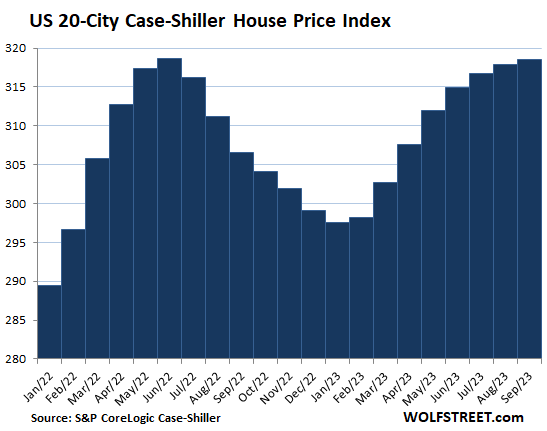
The S&P CoreLogic Case-Shiller Home Price Index uses the “sales-pairs method,” comparing the sales price of the same house over time, thereby eliminating the issues associated with median price indices (see “Methodology” toward the end of the article). But it lags: Today’s index for “September” is a three-month moving average of home prices whose sales were entered into public records in July, August, and September.
By contrast, the national median-price index by the National Association of Realtors fell for the fourth month in a row in October and was down 5.1% from the all-time high in June 2022, making 2023 the first year since the Housing Bust that the seasonal high of the current year was below the high in the prior year. And this is an actual national index.
By contrast, the “National” Case-Shiller index hit an all-time high, which is what the headlines today screamed about. But the Case-Shiller Index, which I think is the most reliable house price index out there, does not cover the entire US; it only covers the 20 metros discussed here.
So S&P CoreLogic, in its attempts to give the 20-City data the aura of a “National” index, combined the clean 20-City Case-Shiller data with data from the FHFA House Price Index. The FHFA data is based on mortgage data from Fannie Mae and Freddie Mac that systematically excludes all cash deals and all deals with mortgages that hadn’t been bought by Fannie and Freddie. This systematic selection and exclusion of home price data makes the FHFA index very weird and skews it.
Nevertheless, S&P CoreLogic mixed these two data sets into a cocktail it calls “National Home Price Index,” and the doofus reporters or bots at the media outlets to make clickbait out of it.
So today’s 20-City Case-Shiller housing numbers.
Prices are below their 2022 peaks in 9 of the 20 metros in the index (% from their respective peak):
- San Francisco Bay Area: -11.2%
- Seattle: -10.4%
- Las Vegas: -5.6%
- Phoenix: -5.6%
- Portland: -5.0%
- Denver: -4.7%
- Dallas: -4.1%
- San Diego: -2.0%
- Los Angeles: -1.1%
Prices set new highs in 10 of the 20 metros in the index (% year-over-year):
- New York: +6.3%
- Detroit: +6.7%
- Chicago: +6.0%
- Boston: +5.3%
- Cleveland: +5.0%
- Miami: +5.0%
- Charlotte: +4.7%
- Washington DC: +4.4%
- Atlanta: +4.3%
- Tampa: +1.5%
The most splendid housing bubbles by metro.
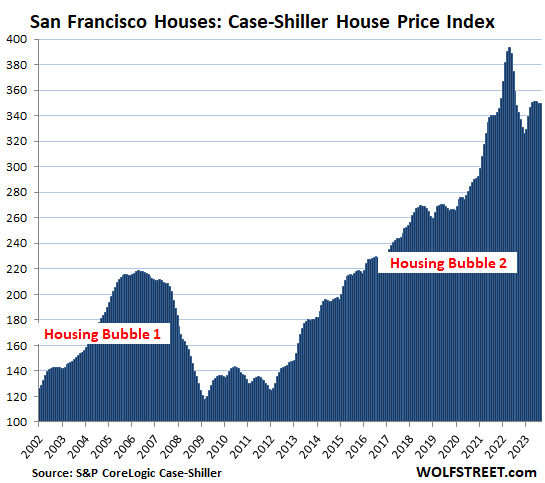
San Francisco Bay Area:
- Month to month: flat
- Year over year: +0.5%
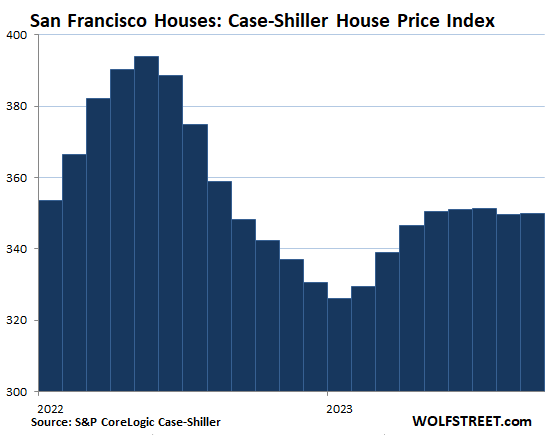
- From the peak in May 2022: -11.2%.
And here is the closeup of San Francisco:
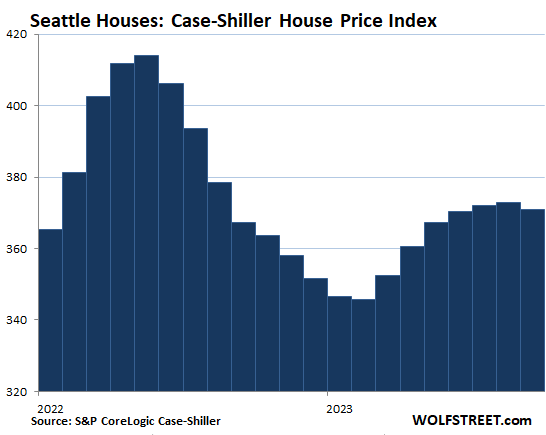
Seattle metro:
- Month to month: -0.5%.
- Year over year: +0.9%.
- From the peak in May 2022: -10.4%.
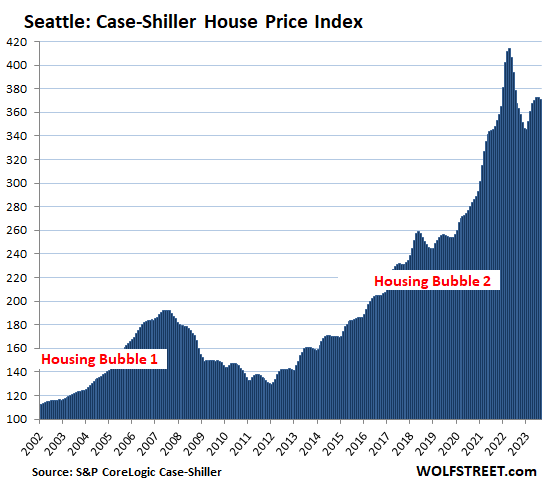
The closeup of Seattle:
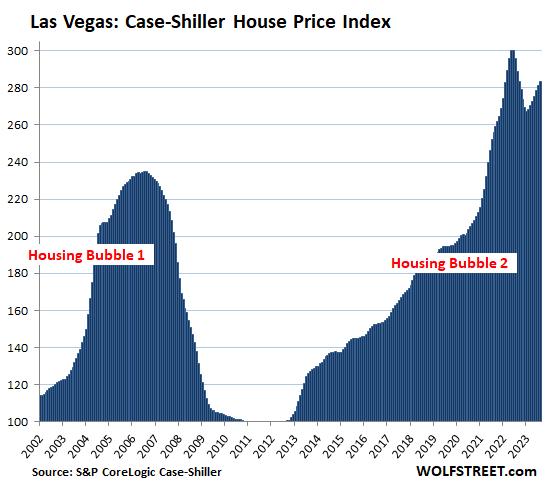
Las Vegas metro:
- Month to month: +0.6%.
- Year over year: -1.9%.
- From the peak in July 2022: -5.6%.
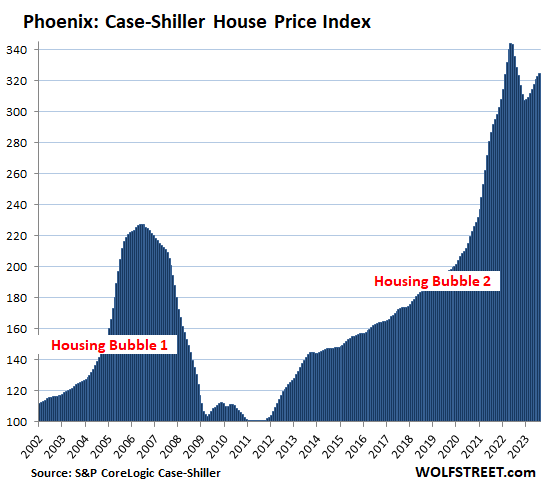
Phoenix metro:
- Month to month: +0.5%.
- Year over year: -1.2%.
- From the peak in June 2022: -5.6%.
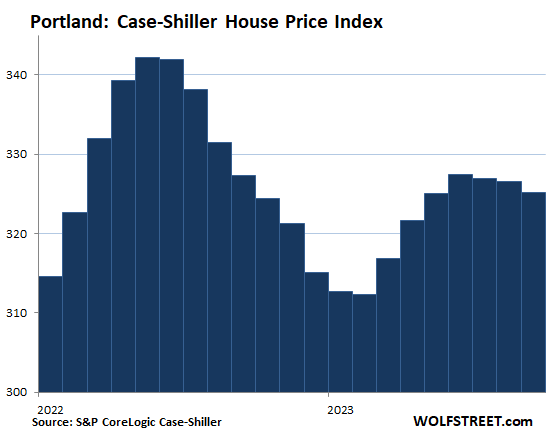
Portland metro:
- Month to month: -0.4%.
- Year over year: -0.7%.
- From the peak in May 2022: -5.0%.
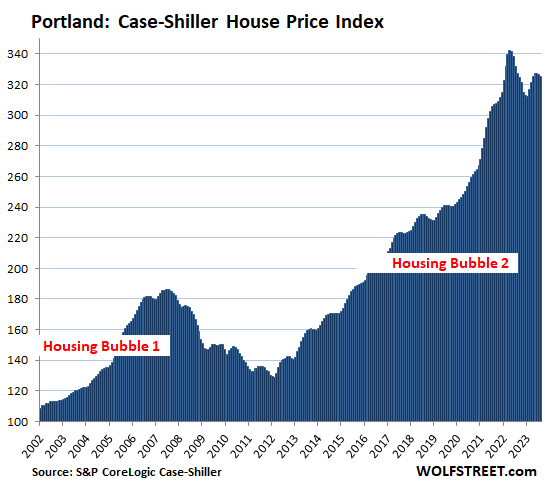
The closeup of Portland:
Denver metro:
- Month to month: -0.3%.
- Year over year: +1.0%.
- From the peak in May 2022: -4.7%.
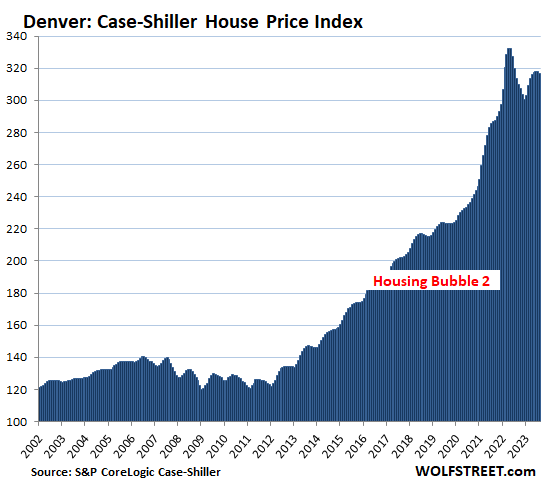
Note: I will post closeups of Denver and a few other markets in the comments below as soon as I have a little extra time.
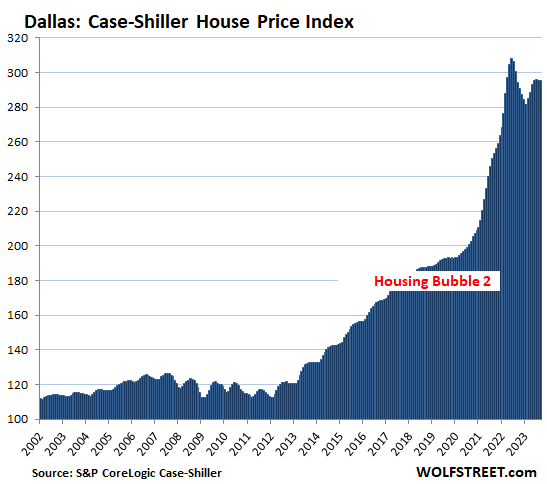
Dallas metro:
- Month to month: -0.1%.
- Year over year: +0.3%.
- From the peak in June 2022: -4.1%.
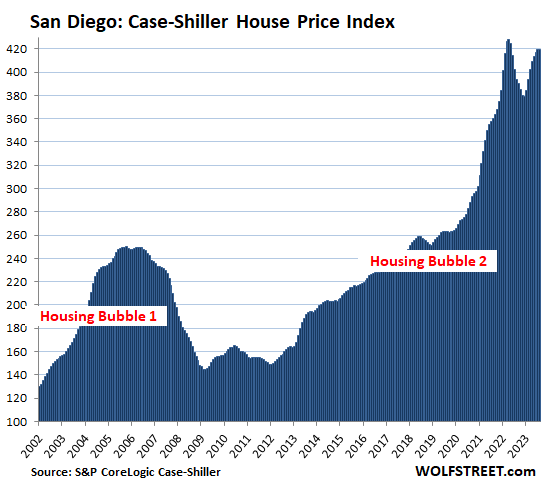
San Diego metro:
- Month to month: flat.
- Year over year: +6.5%.
- From the peak in May 2022: -2.0%.
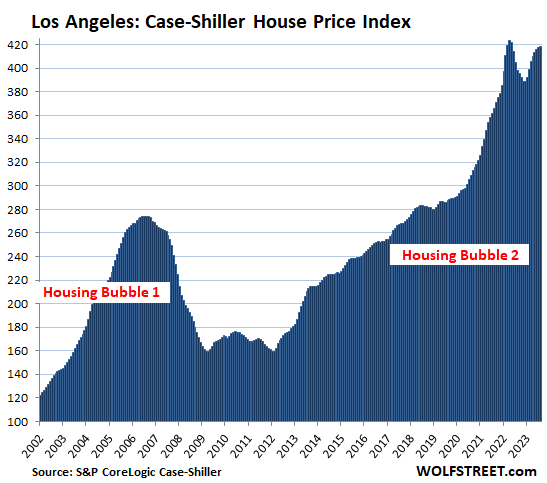
Los Angeles metro:
- Month to month: +0.2%.
- Year over year: +5.2%.
- From the peak in May 2022: -1.1%.
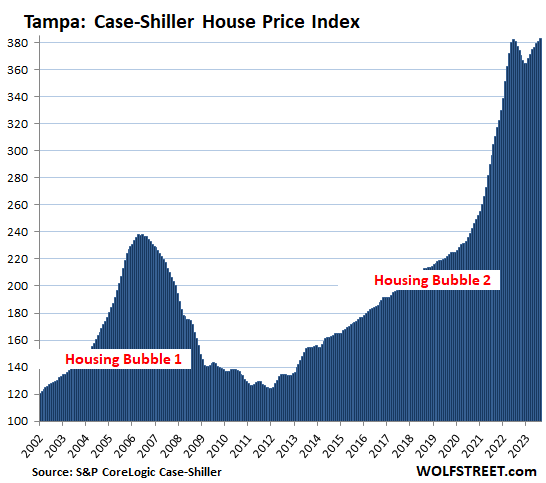
Tampa metro:
- Month to month: +0.5%.
- Year over year: +1.5%.
- Set new high by a hair, squeaking past the high of July 2022.
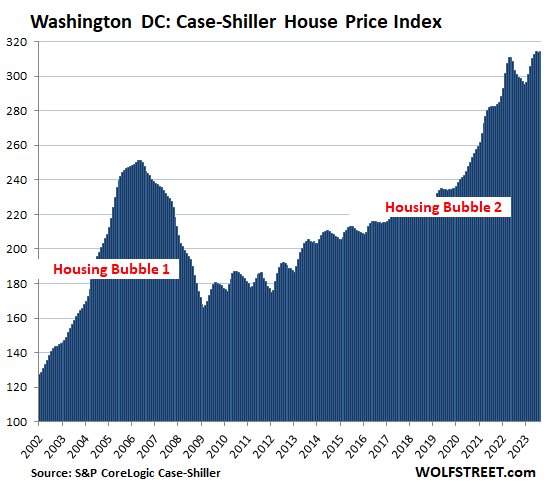
Washington D.C. metro:
- Month to month: 0.1%.
- Year over year: +4.4%.
- Set new high.
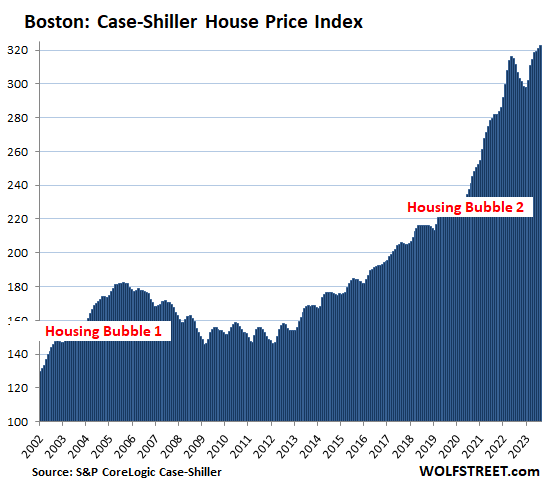
Boston metro:
- Month to month: +0.5%.
- Year over year: +5.3%.
- Set new high.
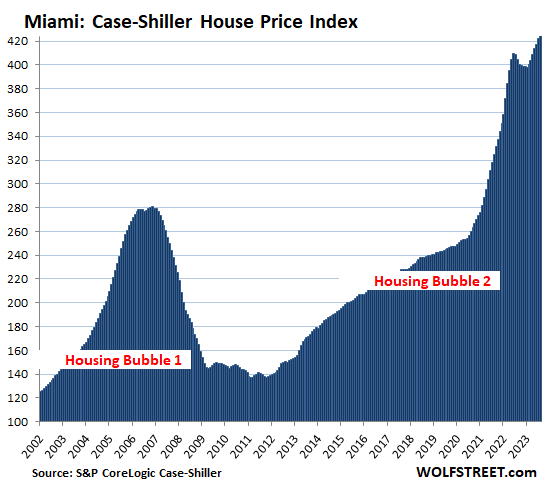
Miami metro:
- Month to month: +0.6%
- Year over year: +5.0%.
- Set new high.
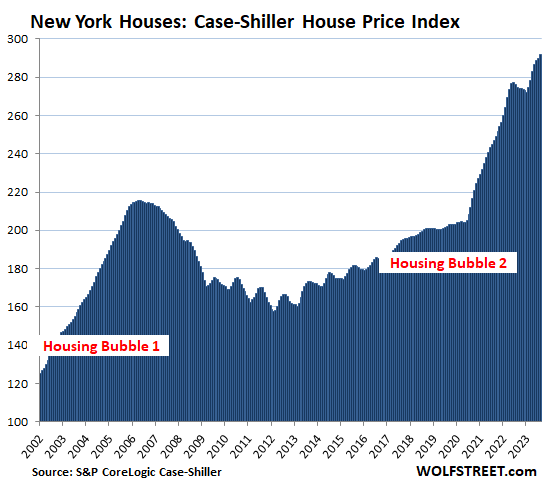
New York metro:
- Month to month: +0.6%.
- Year over year: +6.3%.
- Set new high.
Methodology. The Case-Shiller Index uses the “sales pairs” method, comparing sales in the current month to when the same houses sold previously. The price changes are weighted based on how long ago the prior sale occurred, and adjustments are made for home improvements and other factors. This “sales pairs” method makes the Case-Shiller index a more reliable indicator than median price indices, but it lags months behind (37-page methodology).
It’s Home-Price Inflation. By measuring how many dollars it takes to buy the same house over time, the Case-Shiller index is a measure of home price inflation. The indices were set at 100 for the year 2000. So today’s index values of 425 for Miami and 419 for San Diego and Los Angeles are up respectively by 325% and 319% since 2000. Miami is thereby the #1 Most Splendid Housing Bubble in terms of home price inflation since 2000, followed by San Diego and Los Angeles.
To be included in this list of the Most Splendid Housing Bubbles, the metro must have experienced a home price inflation since 2000 of at least 180%.
By comparison, Consumer-Price Inflation, which tracks price changes of goods and services that are consumed by consumers was 82% over the same period since January 2000, according to the Consumer Price index (my latest on CPI: Beneath the Skin of CPI Inflation).
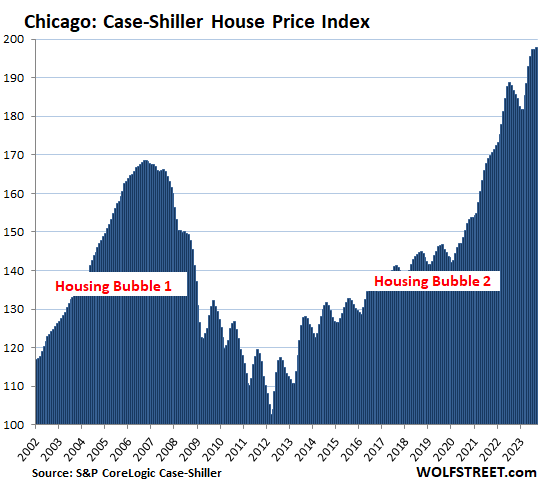
The remaining 6 of the 20 markets in the Case-Shiller index (Chicago, Charlotte, Minneapolis, Atlanta, Detroit, and Cleveland) had far less home price inflation than 180% since 2000, and don’t qualify for this list of the Most Splendid Housing Bubbles. But in 2022 and 2023, these metros were the ones with the biggest home price increases in percentage terms.
Chicago is among the 6 metros that don’t qualify for this list, with an index value of 198, which is up by “only” 98% from 2000. But here it is anyway:
- Month to month: +0.3%
- Year over year: +6.0%.
- Set new high.
STAY INFORMED! Receive our Weekly Recap of thought provoking articles, podcasts, and radio delivered to your inbox for FREE! Sign up here for the HoweStreet.com Weekly Recap.
Wolf Richter November 28th, 2023
Posted In: Wolf Street
Next: Real Estate Cycle Hitting Hard »