


[Taken from May 2023 Timing Letter]
Is the U.S. economy a dead man walking?
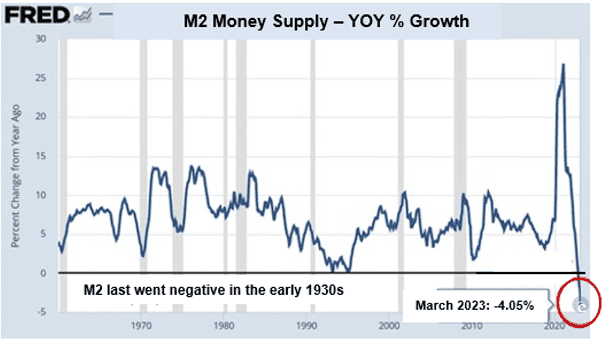
As illustrated in my May 2023 Timing Letter, U.S. money supply (M2) is falling at its fastest year-over-year rate since the 1930s, and is sending a highly negative signal for the economy, stocks, and real estate.
Historically reliable recession indicators have been going off for the last 15 months, but I found this one particularly alarming.
Here’s Why:
Growth in the M2 money supply has only gone negative on a year-over-year basis five times in the last 153 years.
- During the 1870s Depression, YOY M2 growth fell by 2% and the unemployment rose to 14%;
- During the Panic of 1893, YOY M2 growth fell by 3% and unemployment rose to 18%;
- During the 1921 Depression, YOY M2 growth fell by 2% and unemployment rose to 11%
- During the 1930s Depression, YOY M2 growth fell by 12% and unemployment rose to 25%.
The Art of Economic Survival
Like the art of war, the art of economic survival teaches us not to rely on the unlikeliness of a coming threat, but to be ready for it if it comes.
My suggestions?
Tighten your belt, ratchet down your spending – especially on things you don’t need with money you don’t have – increase your cash balances, deleverage, and be extra vigilant to where your money is invested.
It’s not called “panicking” if you’re one of the first people out the door.
That graph shows money supply GROWTH. The money supply was hugely expanded during the pandemic. It’s only right that it be reduced to pre-pandemic levels. A more informative and appropriate chart would be one that shows money supply instead of money supply growth.