ALWAYS CONSULT YOUR INVESTMENT PROFESSIONAL BEFORE MAKING ANY INVESTMENT DECISION

March 14, 2023 | Services Inflation Rages at Four-Decade High: Fueled by Rents, Auto Insurance, Repairs, Airfares, Hotels, Pet Services, Food Services, Delivery

Wolf Richter


The Consumer Price Index (CPI) for February showed once again that inflation rages in services at the worst levels in four decades, while inflation in many goods categories continue to back off:
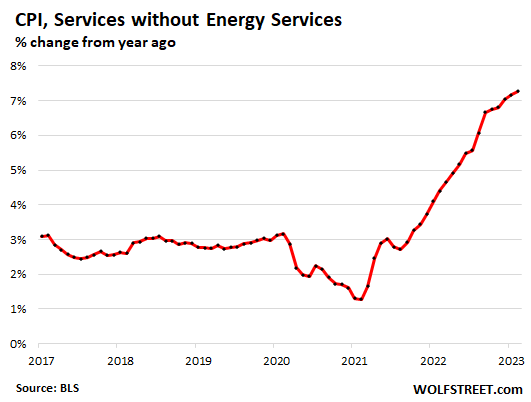
- Services without energy services: annual inflation jumped by 7.3%, a four-decade high, driven by housing, food services (food away from home), auto insurance, repair services, airline fares, pet services, hotels, and delivery services.
- Food at home: inflation rose at a slower pace in February from January (+0.3%). But year-over-year, still +10.2%.
- Energy inflation overall fell month to month (-0.6%), which whittled down the year-over-year inflation rate to +5.2%. Gasoline prices -2% from a year ago.
- Durable goods prices fell again month-to-month (-0.4%) and year-over-year (-1.8%), driven by price declines in used vehicles and consumer electronics.
- Core CPI: accelerated to +0.5% month-to-month, third month in a row of acceleration. Year-over-year: +5.5% (from 5.6%).
- Overall CPI (CPI-U): +0.4% month-to-month, +6.0% year-over-year.
Services inflation without energy services jumped to four-decade high.
The CPI for services inflation without energy services jumped by 7.3% in February year-over-year, the worst increase since 1982 and the third month in a row above 7%, according to the CPI data released today by the Bureau of Labor Statistics.
In services is where inflation is now raging and entrenched. Nearly two-thirds of consumer spending goes into services:
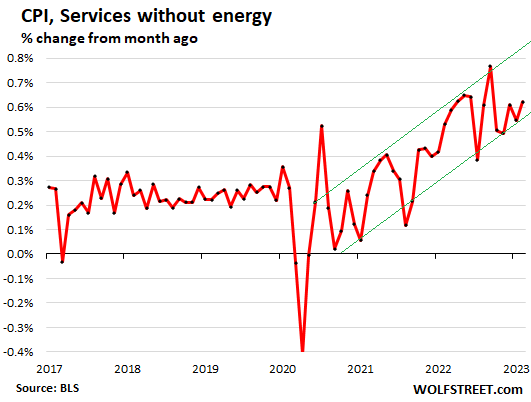
Month-to-month, services inflation without energy services jumped by 0.6% in February from January. It has been in the 0.5% to 0.8% range for 12 months. In services is where inflation gets sticky. The green lines are food for thought:
| Services less energy services | Weight in CPI | MoM | YoY |
| Overall | 58.1 | 0.6% | 7.3% |
| Airline fares | 0.6% | 6.4% | 26.5% |
| Motor vehicle insurance | 2.5% | 0.9% | 14.5% |
| Motor vehicle maintenance & repair | 1.1% | 0.2% | 12.5% |
| Pet services, including veterinary | 0.5% | 1.8% | 10.5% |
| Rent of primary residence | 7.5% | 0.8% | 8.8% |
| Food services (food away from home) | 4.8% | 0.6% | 8.4% |
| Owner’s equivalent of rent | 25.4% | 0.7% | 8.0% |
| Postage & delivery services | 0.1% | 0.2% | 7.7% |
| Hotels, motels, etc. | 1.1% | 2.3% | 6.7% |
| Recreation services, admission to movies, concerts, sports events | 3.1% | 1.2% | 6.3% |
| Other personal services (dry-cleaning, haircuts, legal services…) | 1.4% | 1.4% | 5.6% |
| Water, sewer, trash collection services | 1.1% | 0.8% | 5.2% |
| Video and audio services, cable | 1.0% | 1.6% | 5.1% |
| Medical care services | 6.6% | -0.7% | 2.1% |
| Education and communication services | 4.9% | 0.2% | 2.9% |
| Tenants’ & Household insurance | 0.4% | -0.1% | 0.8% |
| Car and truck rental | 0.1% | -0.5% | -0.8% |
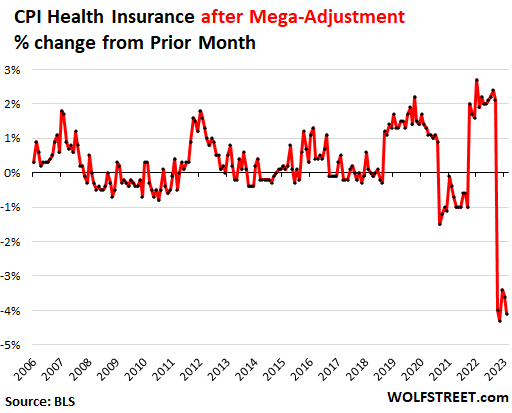
Note: Health insurance mega-downward adjustment, part of “Medical care services.”
BLS undertakes annual adjustments in how it estimates the costs of health insurance and then spreads those adjustments over the following 12 months. The first mega-adjustment hit in October and every month since (more details here).
In other words, for the 12 months through September 2022, CPI overestimated health insurance inflation (+28% yoy in September 2022), and it now corrects for this overestimation by spreading the a massive adjustment over 12 months through September 2023.
Without that mega-downward adjustment, services CPI would have been even worse for the past four months.
Due to this downward adjustment, the CPI for health insurance plunged by 4.1% in February from January. The five months of mega-adjustments reduced the year-over-year rate of the CPI for health insurance from the pre-adjustment +28% in September to -4.7% in February.
But, but, but… the PCE price index, to be released later in March, which the Fed prefers, figures health insurance inflation differently and has had no adjustments. And in the PCE price index, services inflation has been aggressive.
Here are the month-to-month changes of the health insurance CPI after the adjustments:
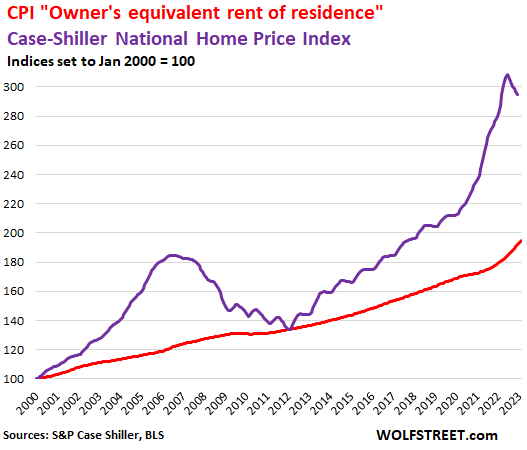
The CPI for housing as a service.
The CPI for housing as a service – “rent of shelter” – which in February weighed 34% of total CPI, is based on rent factors, primarily “Rent of primary residence” (weight: 7.5% of total CPI) and “Owner’s equivalent rent of residences” (weight: 25.4% of total CPI).
“Rent of primary residence” tracks actual rents paid by tenants in houses and apartments, including rent-controlled units. The survey follows the same large group of housing units over time and tracks what tenants are actually paying in these units. So this reflects actual rents paid by tenants.
Not “asking rents.” Other rent indices, such as the Zillow rent index, track “asking rents,” which are advertised rents of still vacant units on the rental market. When asking rents are too high to fill the units, landlords may lower the asking rent. There was a boom in asking rents during the pandemic. But rentals don’t turn over that much, and proportionately not many people actually ended up paying those asking rents.
“Owner’s equivalent rent of residences” tracks the costs of homeownership as a service, based on what a large panel of homeowners report their home would rent for.
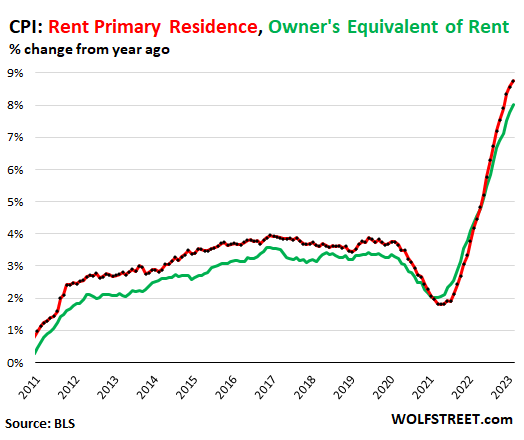
Both rent factors jumped:
- Rent of primary residence: +0.8% for the month, + 8.8% year-over-year, worst since 1982 (red)
- Owner’s equivalent +0.7% for the month, +7.8% year-over-year, worst in the data (green)
Home prices, based on the Case-Shiller Home Price Index, peaked with the report called “June” then started to decline [my version by city: The Most Splendid Housing Bubbles in America]. The most recent data point is the three-month moving average of October, November, and December (purple in the chart below).
The red line represents “owner’s equivalent rent of residence.” Both lines are index values, not percent-changes of index values:
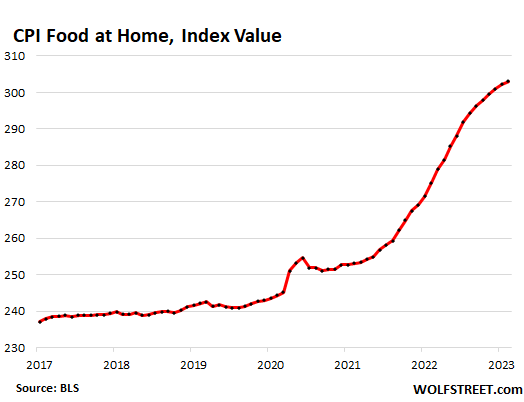
Food inflation.
The CPI for “food at home” – food bought at stores and markets – rose by 0.3% in February from January, less bad than in prior months. Year-over-year, the CPI for food at home rose by 10.2%, the 12th month in a row with double-digit year-over-year increases, but on a downward trend.
This chart of CPI for food at home as an index value (not percent change) gives you a feel for the cumulative spike in food prices over the past two years: +20% since February 2021.
Inflation in many categories has retreated, but heated up in some. The CPI for eggs had spiked on supply problems due to the avian flu, but consumers went on buyers’ strike, demand plunged, and prices have started to settle down:
| Food at home by category | MoM | YoY |
| Overall Food at home | 0.3% | 10.2% |
| Cereals and cereal products | -0.1% | 14.2% |
| Beef and veal | 0.6% | -1.4% |
| Pork | 0.7% | 1.5% |
| Poultry | 0.1% | 9.5% |
| Fish and seafood | 1.5% | 4.6% |
| Eggs | -6.7% | 55.4% |
| Dairy and related products | 0.1% | 12.3% |
| Fresh fruits | 0.4% | 0.4% |
| Fresh vegetables | -0.7% | 5.3% |
| Juices and nonalcoholic drinks | 1.0% | 12.3% |
| Coffee | 0.3% | 11.4% |
| Fats and oils | 0.4% | 19.4% |
| Baby food & formula | 0.5% | 9.8% |
| Alcoholic beverages at home | -0.1% | 4.3% |
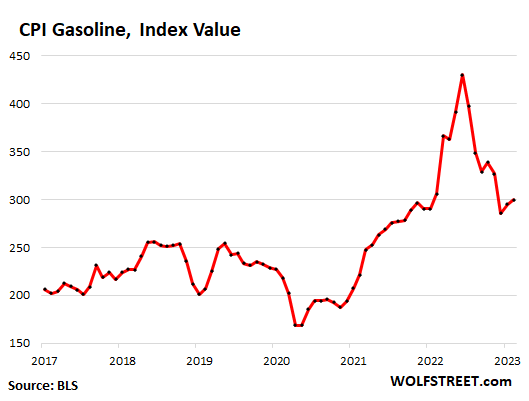
Energy prices:
| CPI for Energy, by Category | MoM | YoY |
| Overall Energy CPI | -0.6% | 5.2% |
| Gasoline | 1.0% | -2.0% |
| Utility natural gas to home | -8.0% | 14.3% |
| Electricity service | 0.5% | 12.9% |
| Heating oil, propane, kerosene, firewood | -6.4% | 5.7% |
The CPI for gasoline as index value (not percent change) depicts a crazy two-year spike that has only partially unwound:
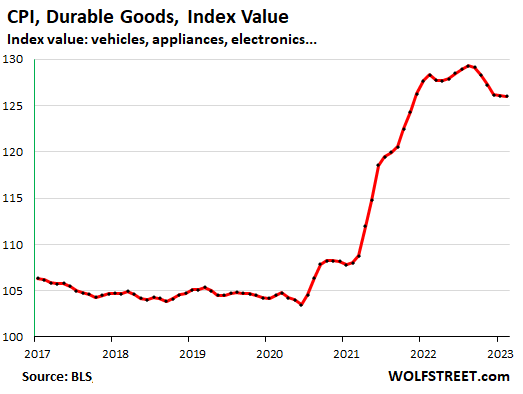
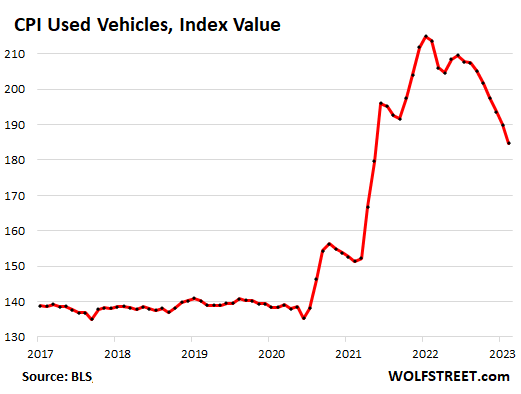
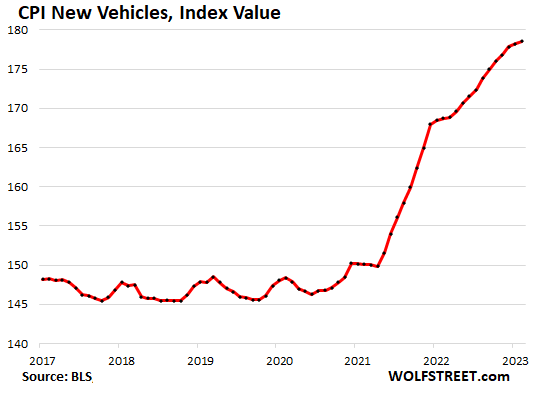
Durable goods prices.
The CPI for durable goods dipped for the sixth month in a row, by 0.4% month to month. On an annual basis, it fell by 1.8%, the second month in a row of annual declines, after a flat reading in December.
| Durable goods by category | MoM | YoY |
| Durable goods overall | -0.4% | -1.8% |
| Information technology (computers, smartphones, etc.) | -0.9% | -12.0% |
| Used vehicles | -2.8% | -13.6% |
| Sporting goods (bicycles, equipment, etc.) | 0.2% | 1.1% |
| New vehicles | 0.2% | 5.8% |
| Household furnishings (furniture, appliances, floor coverings, tools) | 0.8% | 6.3% |
The CPI for durable goods, expressed as index value (not as percent change) shows the mega-spike in prices starting in late 2020 through mid-2022. Prices started to drop last fall, driven by sharp declines in used vehicles and consumer electronics:
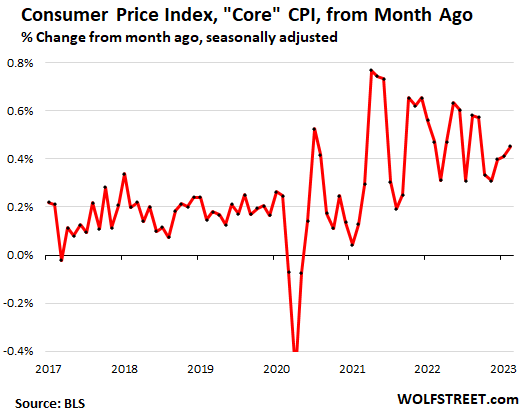
“Core” CPI.
Year-over-year, core CPI, which excludes the volatile food and energy products, jumped by 5.5%, but that was just a tad less than the 5.6% increase in January.
Month-over-month, core CPI jumped by 0.5%, the third month in a row of acceleration, driven by raging inflation in services, and despite the drop in durable goods inflation. This is not going in the right direction:
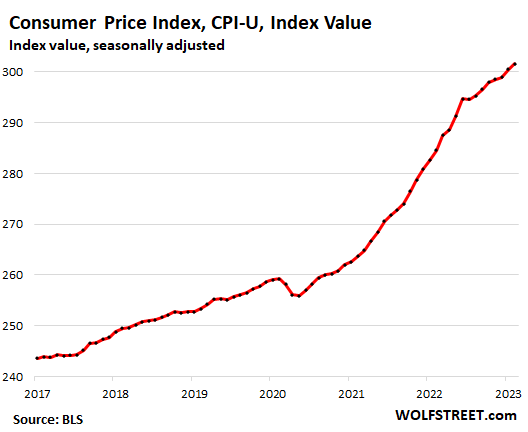
Overall CPI: +14.4% in two years:
In the overall CPI as index value representing price levels — not the percent change of the index value — we see that overall price levels have soared by 14.4% over the past two years:
STAY INFORMED! Receive our Weekly Recap of thought provoking articles, podcasts, and radio delivered to your inbox for FREE! Sign up here for the HoweStreet.com Weekly Recap.
Wolf Richter March 14th, 2023
Posted In: Wolf Street