ALWAYS CONSULT YOUR INVESTMENT PROFESSIONAL BEFORE MAKING ANY INVESTMENT DECISION

December 6, 2022 | The Bulk of Losses Come After The Fed Stops Hiking

Danielle Park


December 14 is expected to mark the US Fed’s 7th consecutive rate hike this cycle with a 50bp increase that will take the fed funds rate to 4.25-4.50%, the highest since December 2007. Chair Powell says they intend to hike more in 2022. We shall see!
As of last Friday’s close, the 10-year minus 3-month US Treasury yield spread reached -83 bps. This degree of curve inversion has only happened three times in the previous 60 years, as shown below: 2000 (recession followed in 2001), 1979-82 (recessions in 1980, 1981-82) and 1974 (recession 1973-75). A 60bp inversion in February 2007 preceded the “great” recession (December 2007 to June 2009).
Higher short-term rates increase cash and bond yields to the benefit of savers. For debtors, real estate and equity owners, the opposite is true.
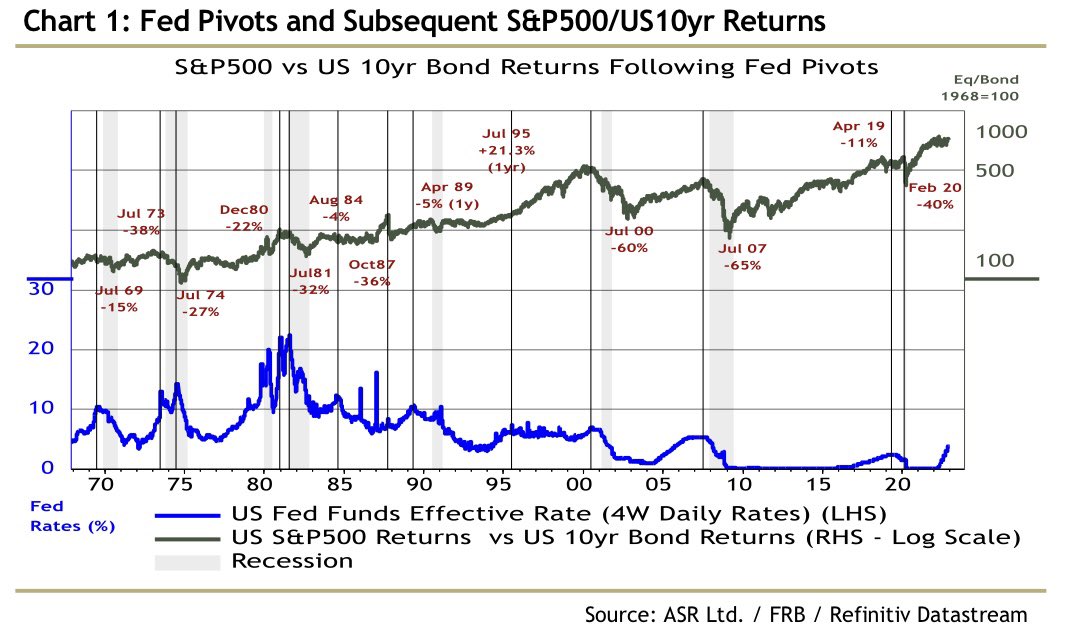
All four of the previous steepest yield inversions preceded the deepest bear markets of the last 40 years when stocks underperformed government bonds by 32 to 65% (as shown below courtesy of Absolute Strategy Research) after the US Fed had paused its tightening efforts (the last pause meeting before the first cut is marked below).
Worse this time, after a 40% leap in the M2 money supply from 2020-21, the last seven months have marked the sharpest decline (-1.5%) since at least 1959. As shown below (courtesy of Zerohedge), the upside is that inflation (CPI) is set to follow M2 lower.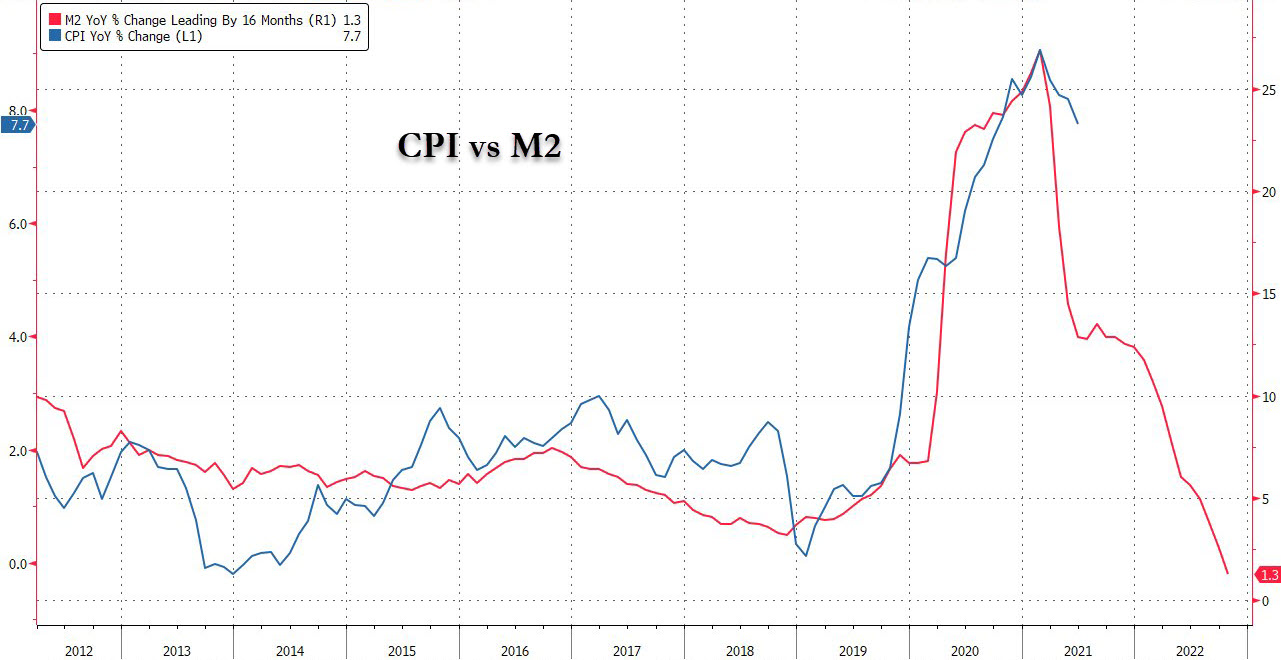
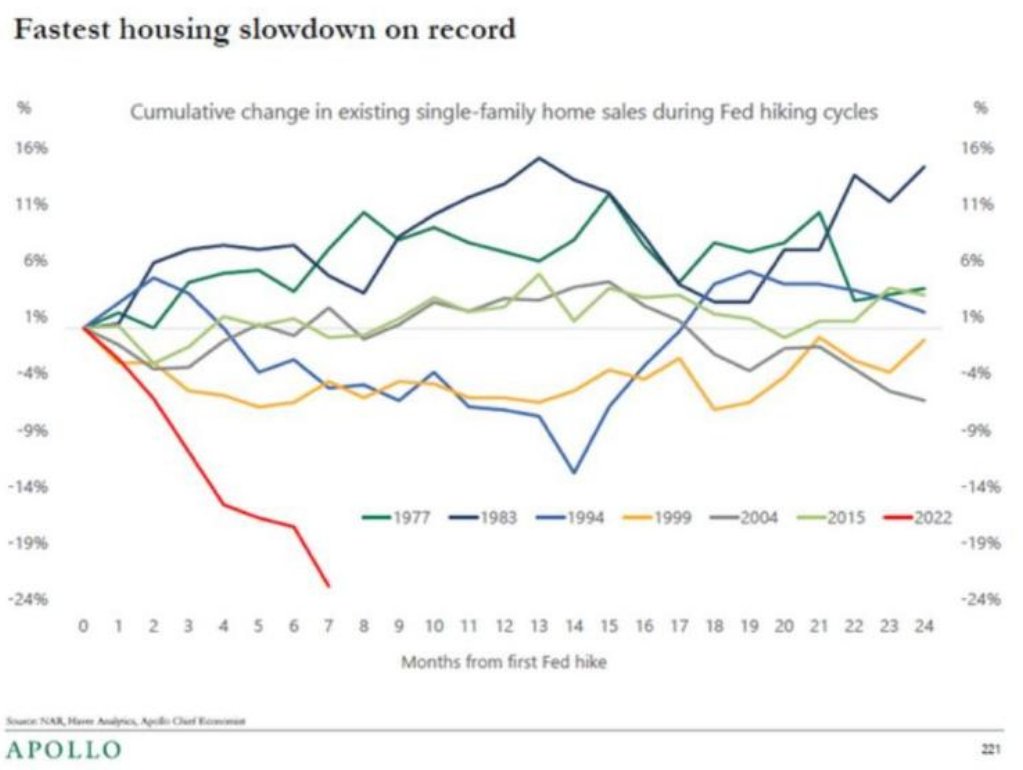
Plunging liquidity in the financial system is sparking the fastest decline in single-family home sales of any Fed tightening cycle on record (2022 in red below courtesy of Macro Alf), along with cascading strife through real estate-focused funds and investment products.
This makes macro sense because, as shown below, courtesy of Charlie Bilello, the US median housing payment now takes 46% of the median household income compared with 42% at the last housing bubble peak in 2006. After 2006, US home prices fell 26% nationally until median housing payments reached 26.7% of the median household income. Median prices stayed less than 33% of household income until the 2021 explosion.
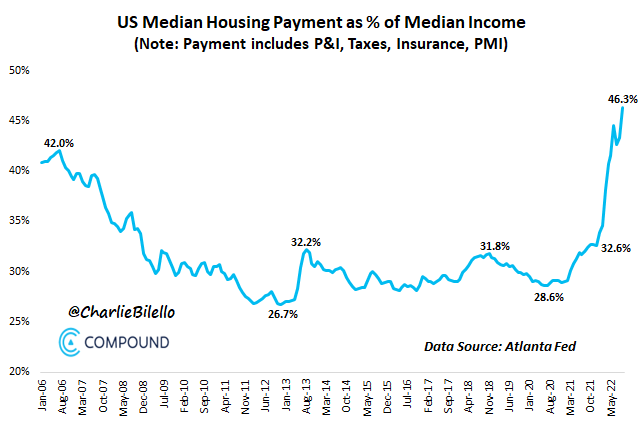
This time a median price drop of 26% would only take US national home prices back to where they were in the fall of 2020. That would be a modest retreat in the big picture.
STAY INFORMED! Receive our Weekly Recap of thought provoking articles, podcasts, and radio delivered to your inbox for FREE! Sign up here for the HoweStreet.com Weekly Recap.
Danielle Park December 6th, 2022
Posted In: Juggling Dynamite
Next: The COVID Scam Continues »