ALWAYS CONSULT YOUR INVESTMENT PROFESSIONAL BEFORE MAKING ANY INVESTMENT DECISION

May 23, 2024 | Home Sales Whacked by Mortgage Rates. Active Listings & Price Reductions Jump to Highest in Years. But Sales of High-End Homes Surge

Wolf Richter


Sales of existing homes of all types were still dogged by the 7% mortgage rates, but a shift has been taking place that took amplitude in April: Many more higher-end homes came on the market and sold, while fewer mid-range homes sold. This shift impacted all kinds of metrics, from inventory for sale to the median price.
So the seasonally adjusted annual rate of sales of single-family houses, townhouses, condos, and co-ops fell by 1.9% in April from March, to an annual rate of 4.14 million homes. Compared to the Aprils in prior years:
- April 2023: -1.9%
- April 2022: -25.7%
- April 2021: -30.5%
- April 2019: -20.8%
- April 2018: -23.8%.
The seasonally adjusted annual rate of sales late last year had been the lowest since the depth of the Housing Bust in 2010: (historic data via YCharts):
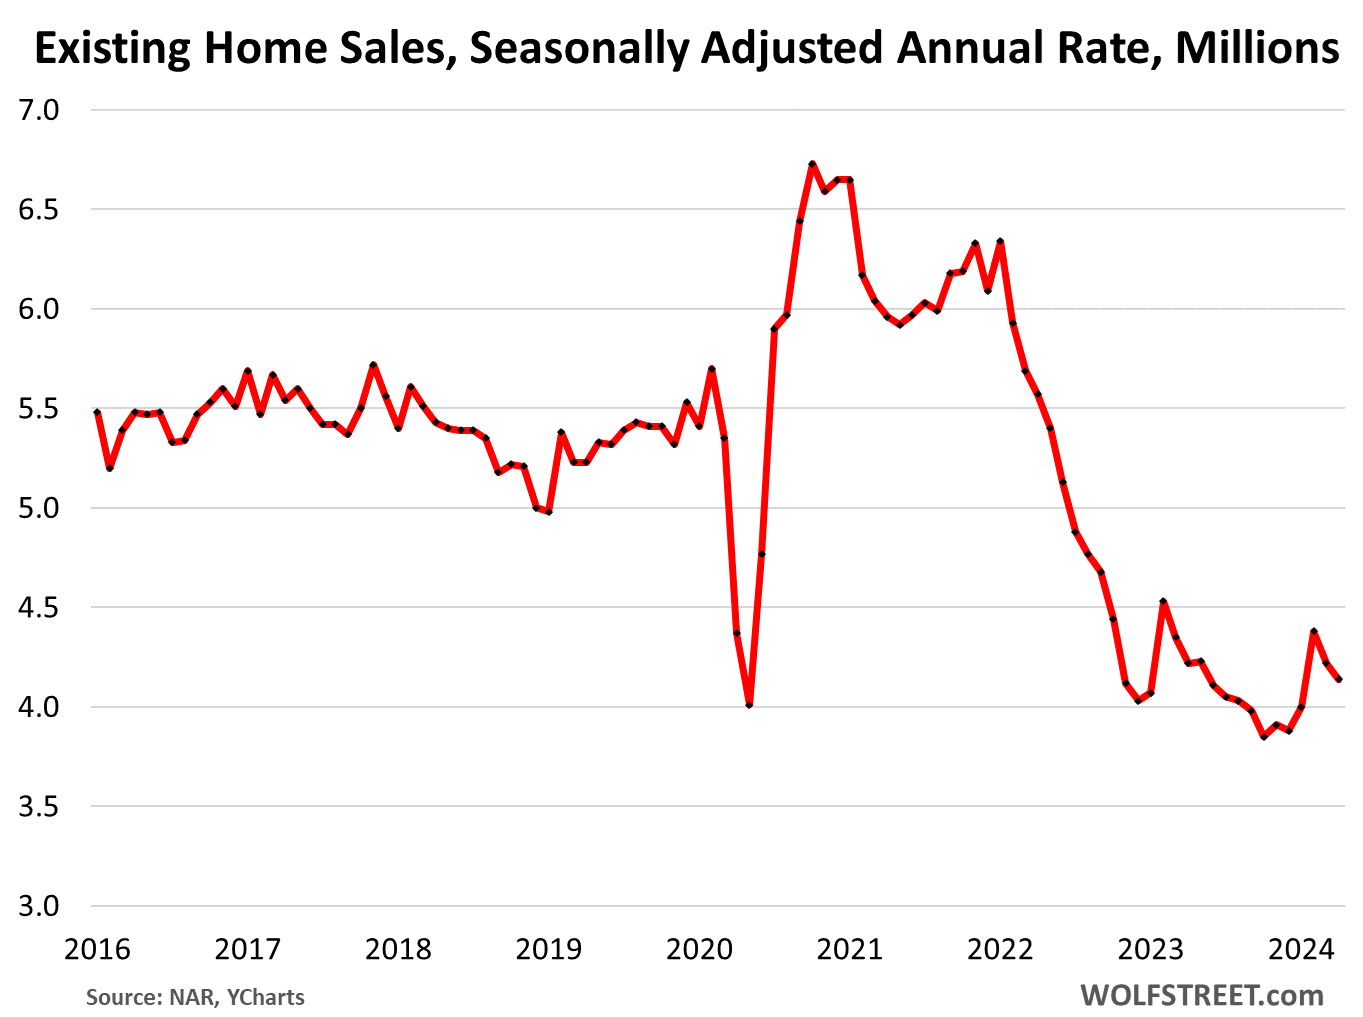
The entire housing market has shrunk by about 20% because a large portion of homeowners with 3% mortgages are neither buying nor selling, they’re just sitting tight and have vanished as demand, and have vanished in equal number as supply, and so sales and supply are down in equal measure, and the churn is down. Realtors make money off the churn, coming and going, and for Realtors, this situation adds another layer of problems to their livelihood.
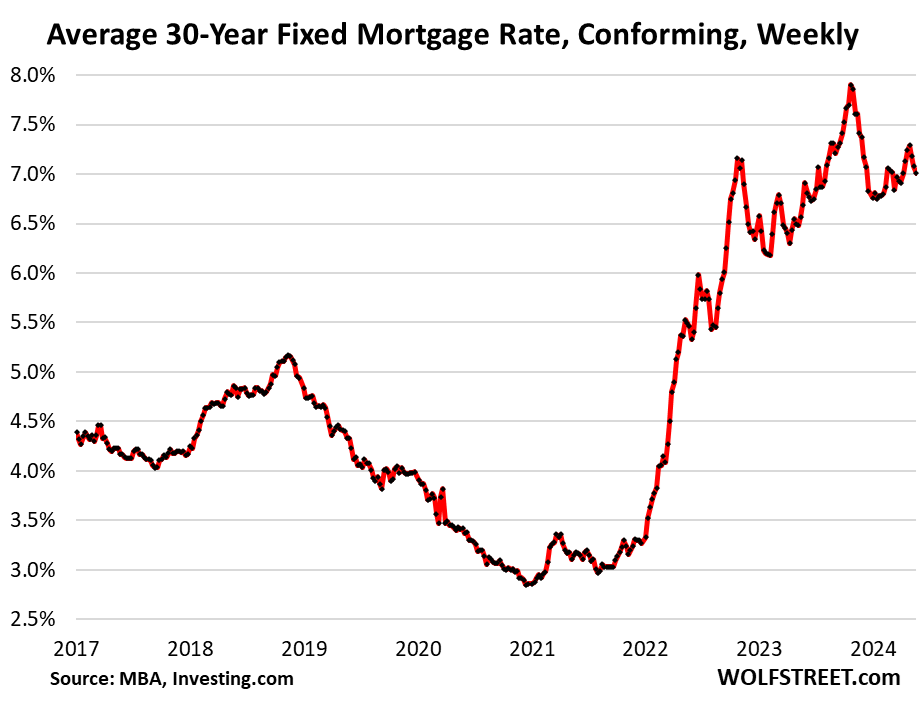
The average 30-year fixed mortgage rate was above 7% in the latest reporting week, according to the Mortgage Bankers Association today:
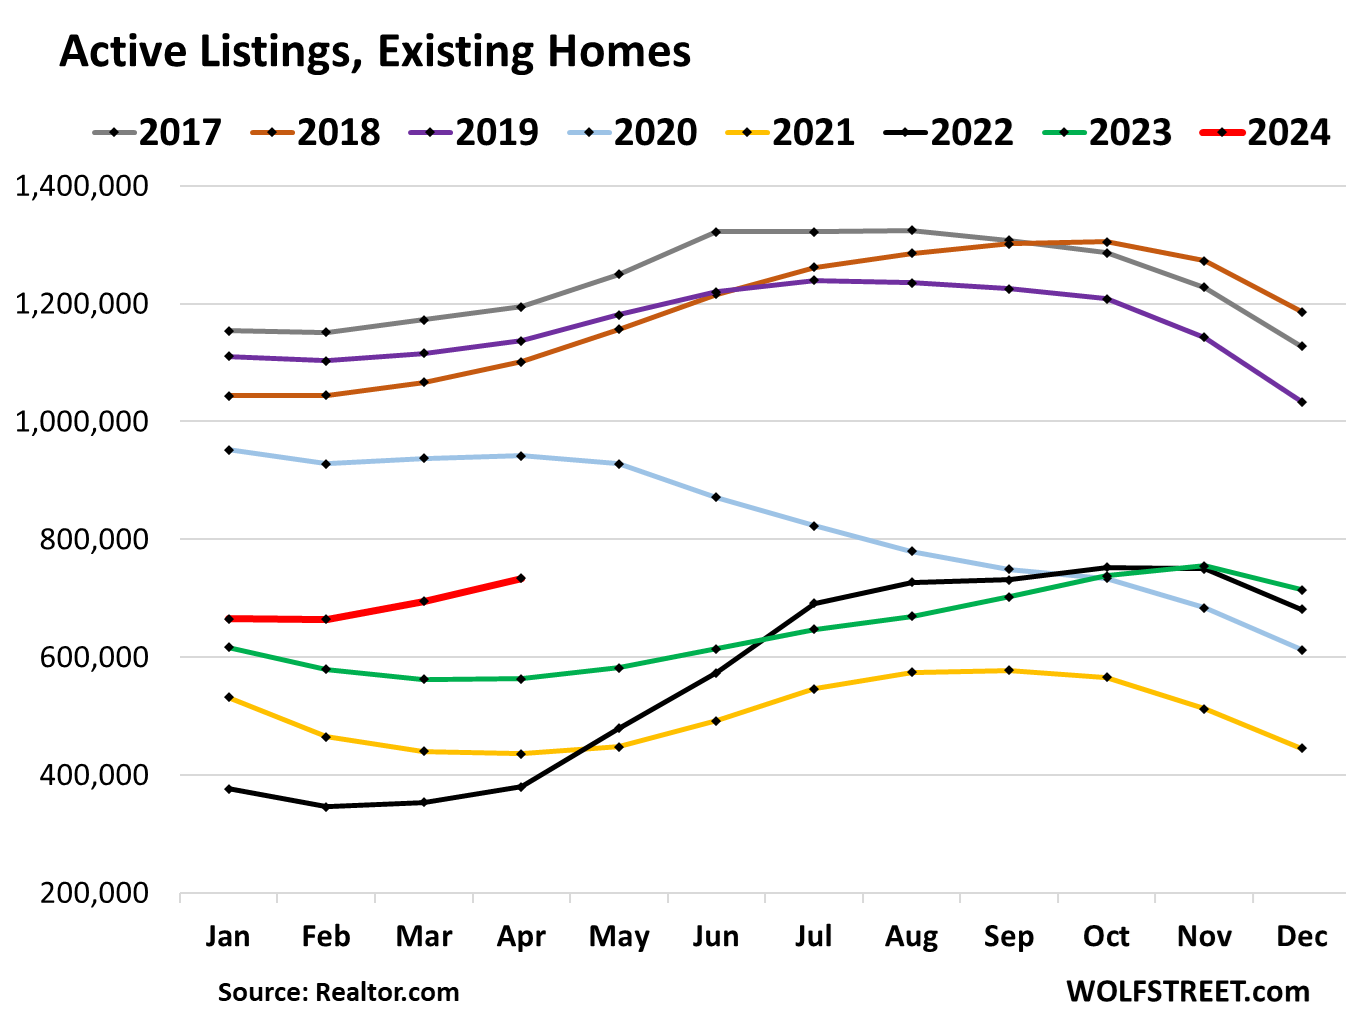
Active listings have been surging, as new listings are coming on the market amid slow sales. In April, active listings rose to 734,000, the highest level since before the pandemic, and up by over 30% from a year ago, according to data from Realtor.com. Compared to April in prior years:
- April 2023: +30.4% (green)
- April 2022: +93.3% (black)
- April 2021: +68.6% (yellow)
- April 2019: -35.4% (purple)
- April 2018: -33.3% (brown)
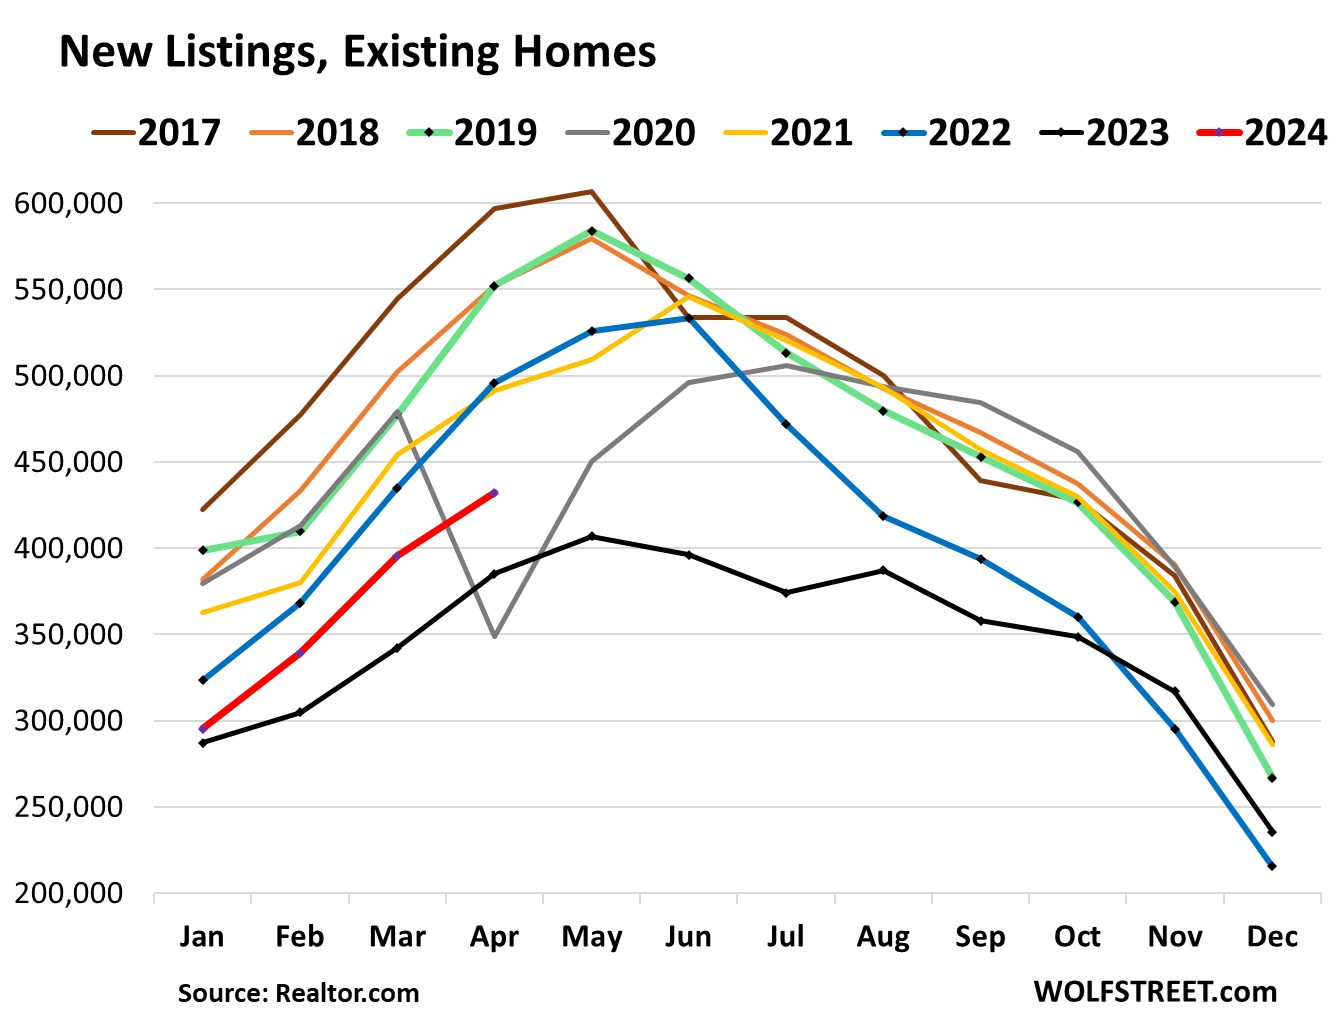
New listings rose by 9.2% from the prior month and by 12.2% from a year ago, to 432,000. This recovery of new listings and the sharp drop in demand has been fueling the continued rise of active listings, in a market where demand and supply both have shrunk by about 20% as many of the 3% mortgage holders have vanished from the market as buyers and as sellers (data via Realtor.com):
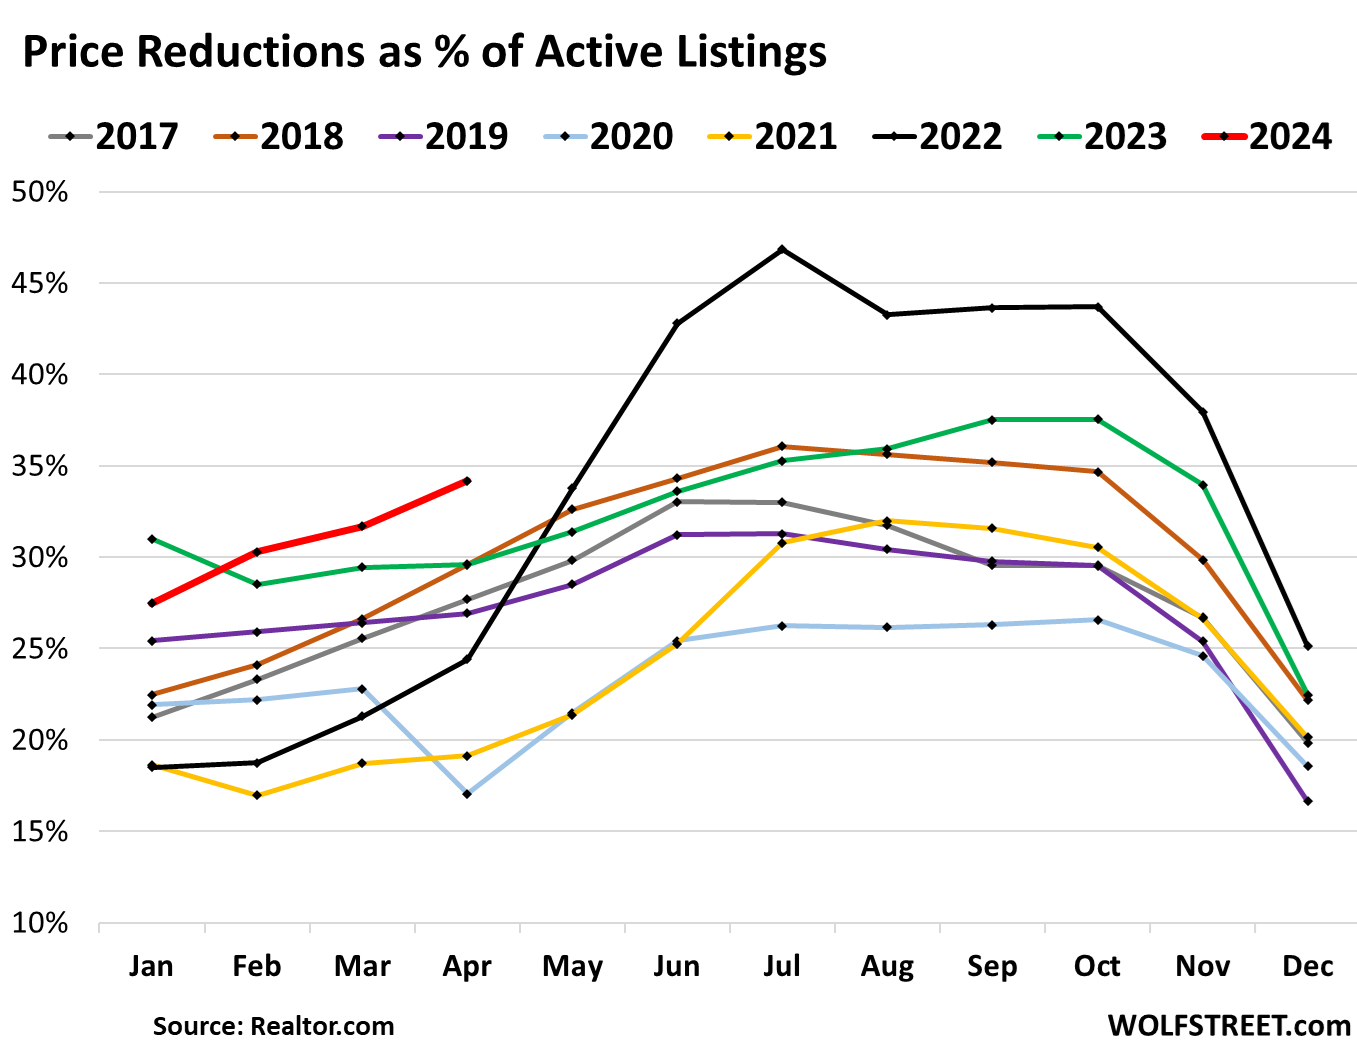
Price reductions jumped to 34% of active listings, the highest for any April in the data released by Realtor.com going back through 2017, as sellers are grappling with their aspirational prices and reality:
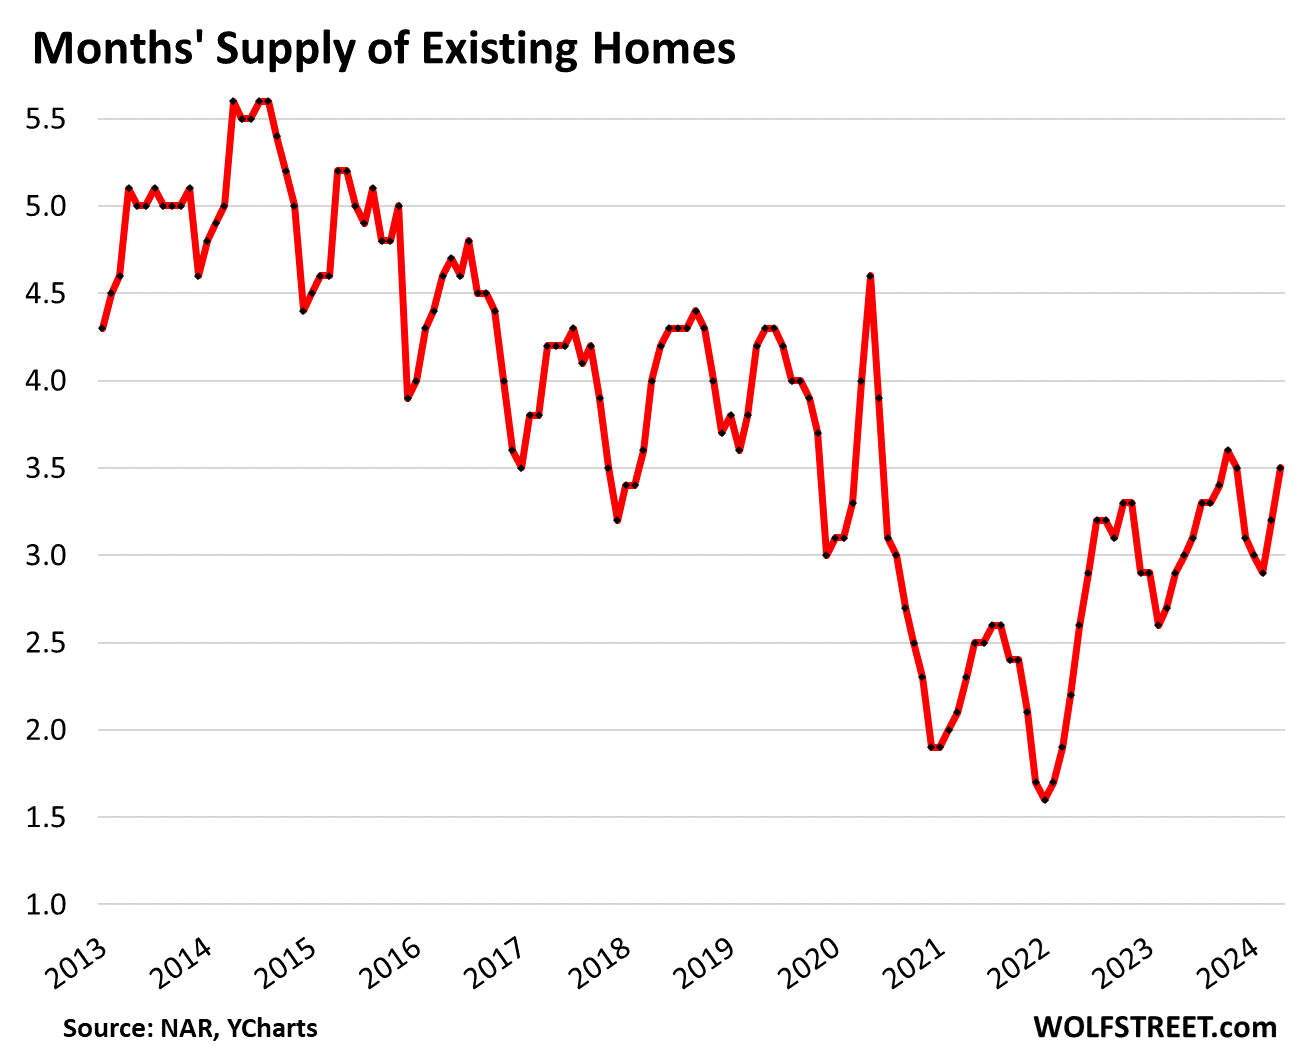
Supply jumped to 3.5 months, the highest for any April since 2020, as inventory for sale rose 16% year-over-year, to 1.21 million homes, while sales were down by 1.9% from April 2023, and by 20% to 30% from Aprils in earlier years, according to NAR data.
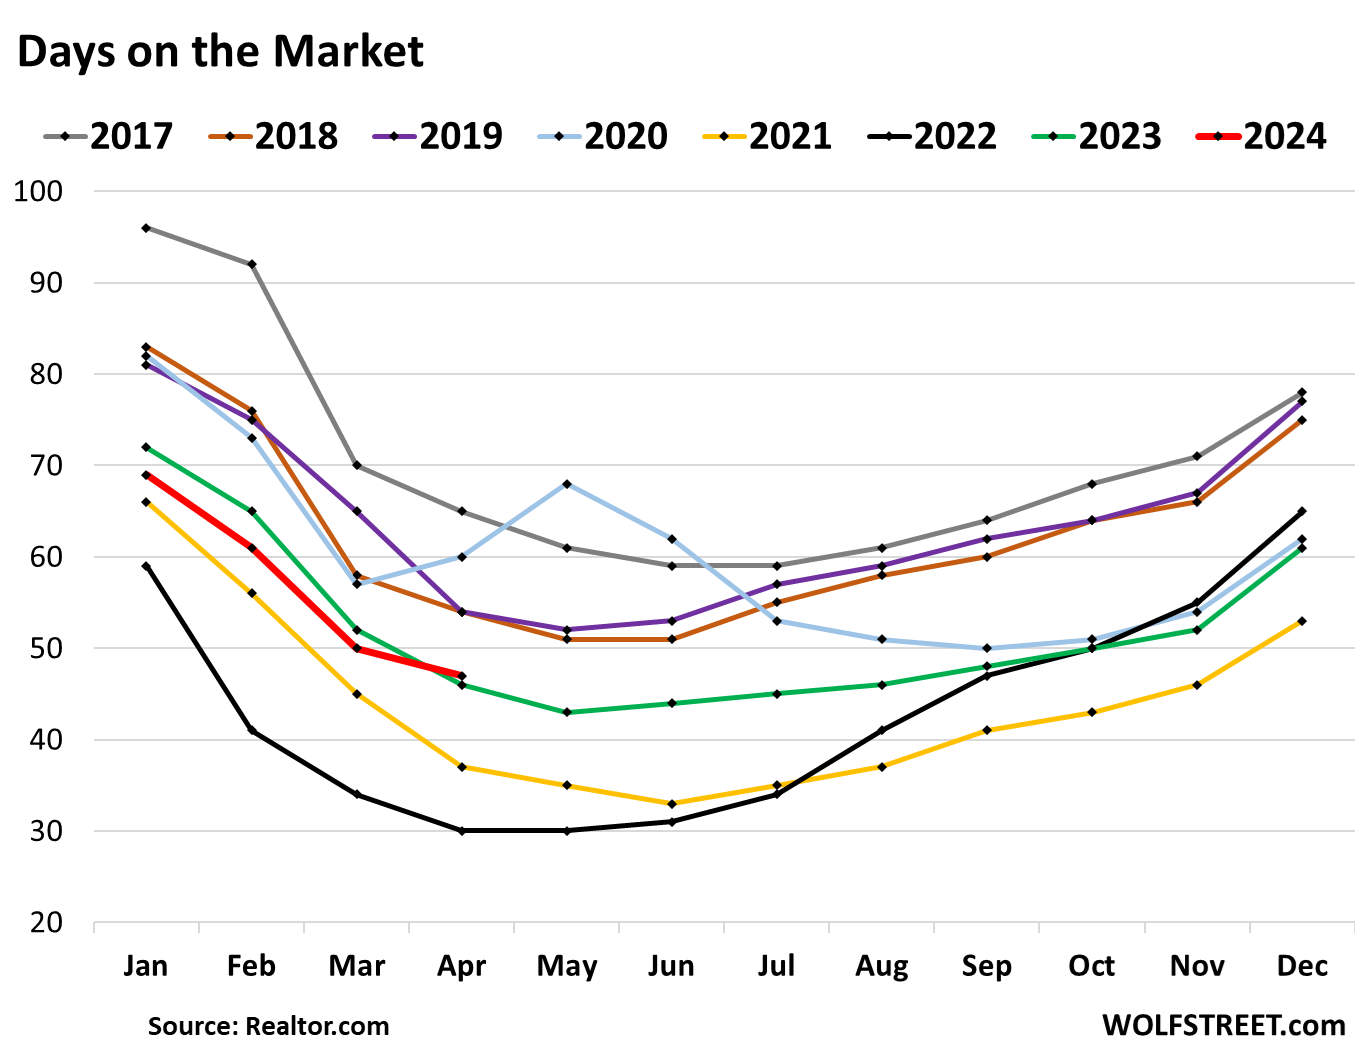
Days on the market – until the home is either sold or pulled off the market – followed seasonal patterns and declined to 47 days in April, but that was the longest for any April since 2020.
This metric is a function of both, how quickly a home sells, and how quickly it gets pulled off the market without selling (data via Realtor.com):
Change in the mix of homes that sold skewed the median price higher.
“Home sales changed little overall, but the upper-end market is experiencing a sizable gain due to more supply coming onto the market,” the NAR pointed out in its report. It said that inventory of homes of over $1,000,000 surged by 34% year-over-year.
Even as total sales “changed little overall”:
- Sales of homes of over $1,000,000: +40% YoY
- Sales of homes of $750,000 to $1,000,000: +24% YoY
- Correspondingly fewer homes sold in the mid- and lower-range.
So the mix of homes that sold changed, with relatively fewer lower- to mid-range homes selling, and a lot more homes at the higher end: $750,000 and up, and particularly $1,000,000 and up.
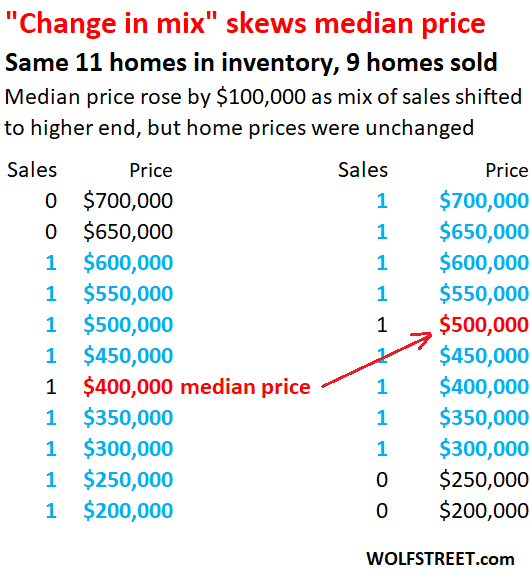
Since NAR brought it up, we have to talk about how a change in the mix skews the median price. To illustrate this principle, we once again have to look at our favorite market where 11 homes were in inventory at the beginning of the month, and 9 of those homes then sold.
The median price is the price in the middle of those 9 homes that sold. To get the median price, we make a list of the 9 homes that sold in order of price: The price of the fifth home from the top (or fifth home from the bottom) is the price in the middle = median price.
In the left column, the bottom nine homes sold, and the top two (black) didn’t sell. The median price is the price in the middle of the 9 homes that sold: $400,000.
In the right column, same homes, the top two higher-end homes sold, but the bottom two didn’t sell. So this shift in mix shifted the price in the middle up to $500,000, but the actual home prices didn’t change:
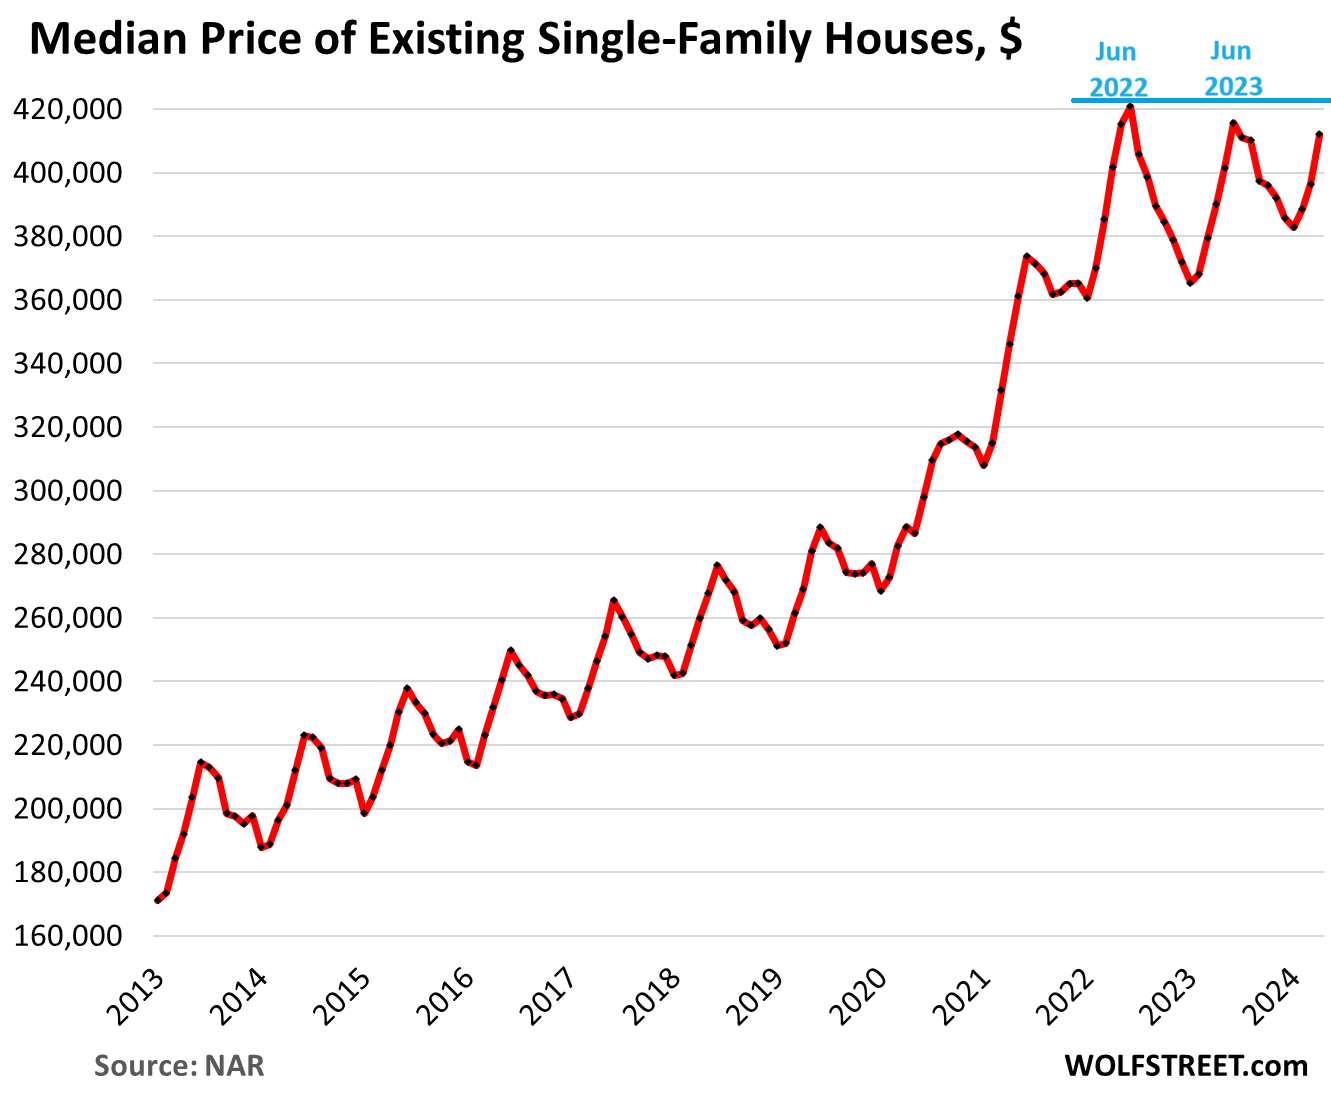
The median price of single-family houses whose sales closed in April rose to $412,100, up by 5.6% year-over-year, amid this large-scale shift in sales to homes above $750,000, and particularly to homes above $1,000,000 that the NAR pointed out. The April median price was 2.1% below peak in June 2022 ($420,900):
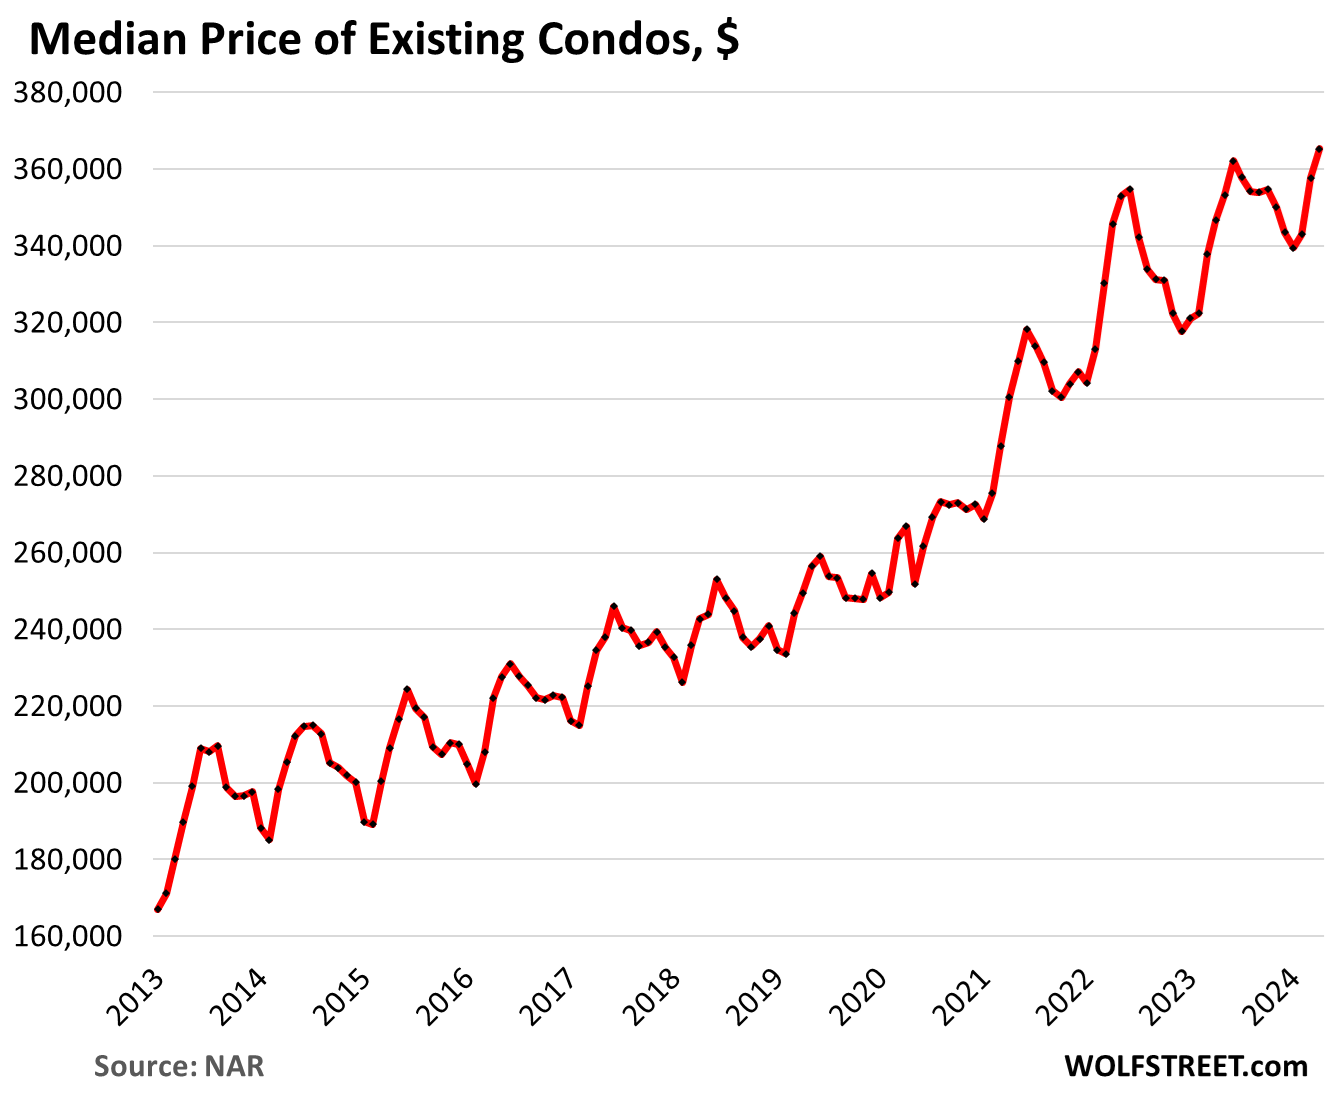
The median price of condos whose sales closed in April rose to $365,300, a new record, amid similar shifts in sales to the higher end.
In comparing house prices (chart above) and condo prices (chart below), we note that in 2013 and 2014, the median prices of single-family houses and condos were roughly the same. For example, in June 2013, the median condo price was $209,000 and the median house price $213,000. But then condo prices increased more slowly from there into the pandemic. In April, the median condo price was nearly $50,000 below the median house price:
STAY INFORMED! Receive our Weekly Recap of thought provoking articles, podcasts, and radio delivered to your inbox for FREE! Sign up here for the HoweStreet.com Weekly Recap.
Wolf Richter May 23rd, 2024
Posted In: Wolf Street