ALWAYS CONSULT YOUR INVESTMENT PROFESSIONAL BEFORE MAKING ANY INVESTMENT DECISION

April 27, 2024 | Fed’s Wait-and-See on Rate Cuts Further Supported by Extra-Hot “Core Services” PCE Inflation & Hot “Core” PCE Inflation

Wolf Richter


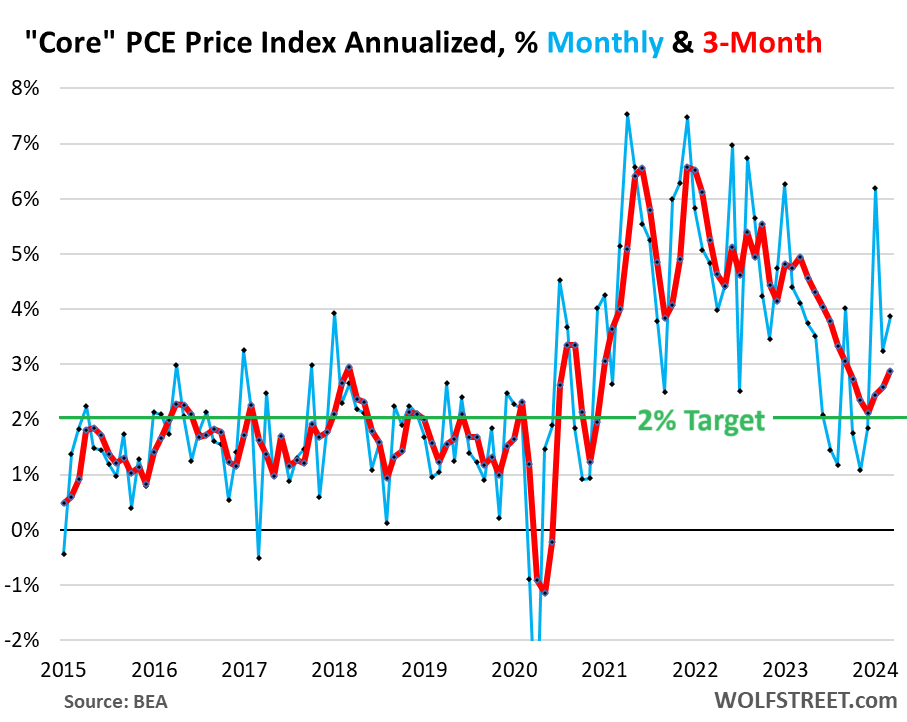
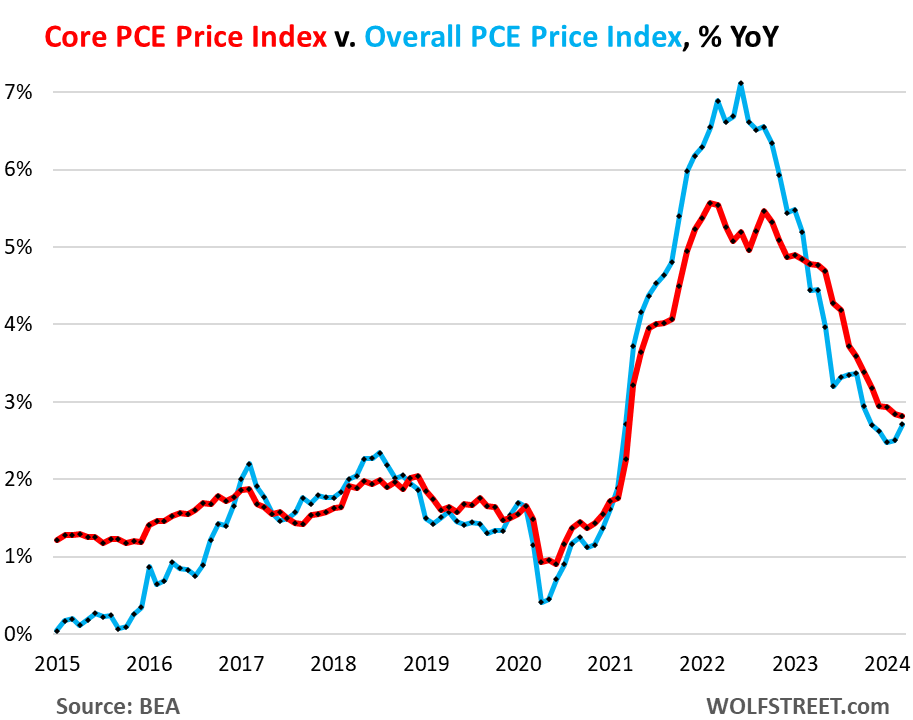
The core PCE price index, which excludes the volatile components of food and energy and is the inflation index the Fed is focused on, jumped by 3.9% annualized in March from February, nearly double the Fed’s target of 2%, according to the Bureau of Economic Analysis today (blue in the chart).
The three-month annualized core PCE price index, which irons out some of the month-to-month volatility and which Powell cites all the time, accelerated to 2.9%, the highest since September (red), and moving decidedly away from the Fed’s 2% inflation target.
This was driven by the usual suspect, a sharp acceleration in core services to 5.5% (three-month annualized) that we’ll get to in a moment:
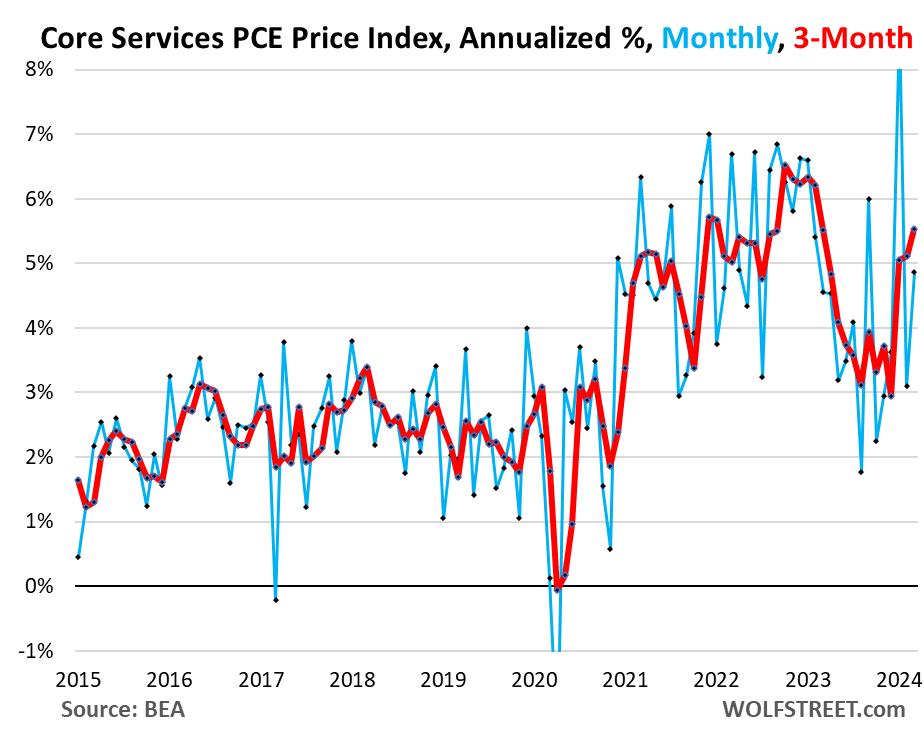
Core Services PCE price index, which excludes energy services, has been hot and is getting hotter. This is where inflation is entrenched, and where the majority of consumer spending takes place. And Fed speakers from Powell on down have pointed at this issue endlessly.
Core services inflation had calmed down somewhat by mid-2023, but then refused to calm down further, getting stuck in the 3.5% range annualized for five months. And in January, it began spiking in a very disconcerting manner.
The core services PCE price index jumped by 4.9% annualized In March, from February (blue). The three-month reading jumped by 5.5% annualized, the worst since February 2023.
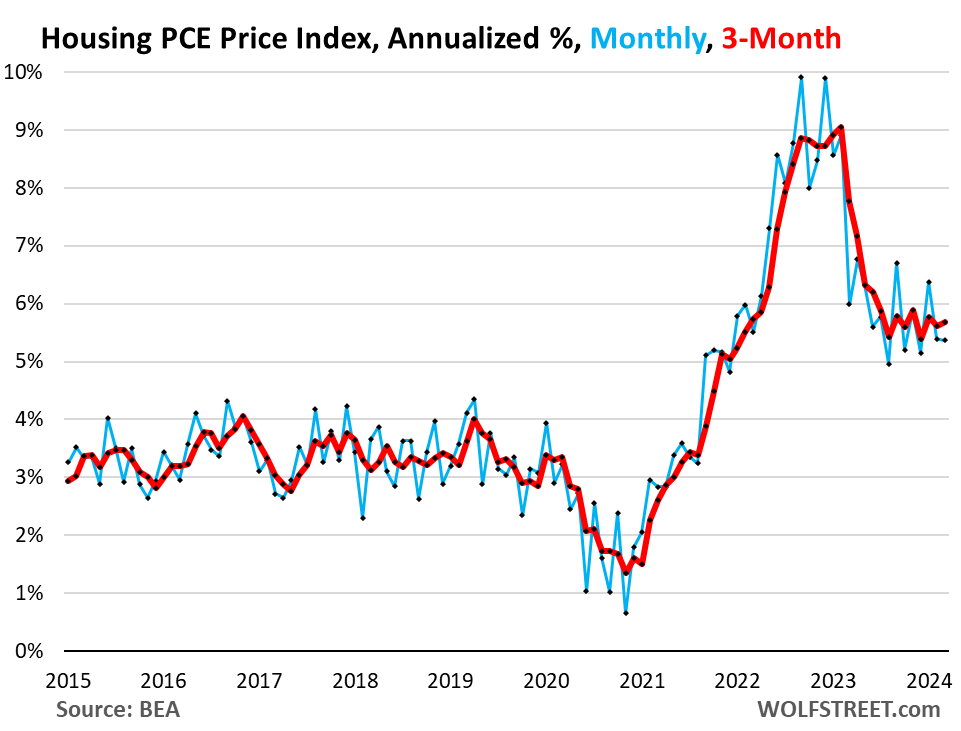
Housing PCE price index jumped by 5.4% annualized in March from February. The three-month reading jumped by 5.7% and has been in this range for eight months in a row.
The housing index is broad-based and includes factors for rent in tenant-occupied dwellings; imputed rent for owner-occupied housing, group housing, and rental value of farm dwellings.
Other core services are super-volatile month to month, so here are the PCE price indices on a six-month annualized basis. Five of the seven categories accelerated in March on a six-month basis; only two decelerated:
- Healthcare: +3.5% (acceleration)
- Transportation services: +5.4% (acceleration). Motor vehicle maintenance and repair, car rentals, parking fees, tolls, airline fares, etc.
- Financial services & insurance: +6.0% (acceleration).
- Non-energy utilities: +5.3% (acceleration).
- Other core services: +3.8% (acceleration). Broadband, cellphone, other communications; delivery; household maintenance and repair; moving and storage; education and training; legal, accounting, and tax services; dues; funeral and burial services; personal care and clothing services; social services such as homes for the elderly and rehab services, etc.
- Recreation services: +4.1% (deceleration). Cable, satellite TV & radio, streaming, concerts, sports, movies, gambling, vet services, package tours, maintenance and repair of recreational vehicles, etc.
- Food services & accommodation: +3.1% (deceleration). Restaurants, hotels, motels, vacation rentals, cafeterias, cafes, delis, etc.
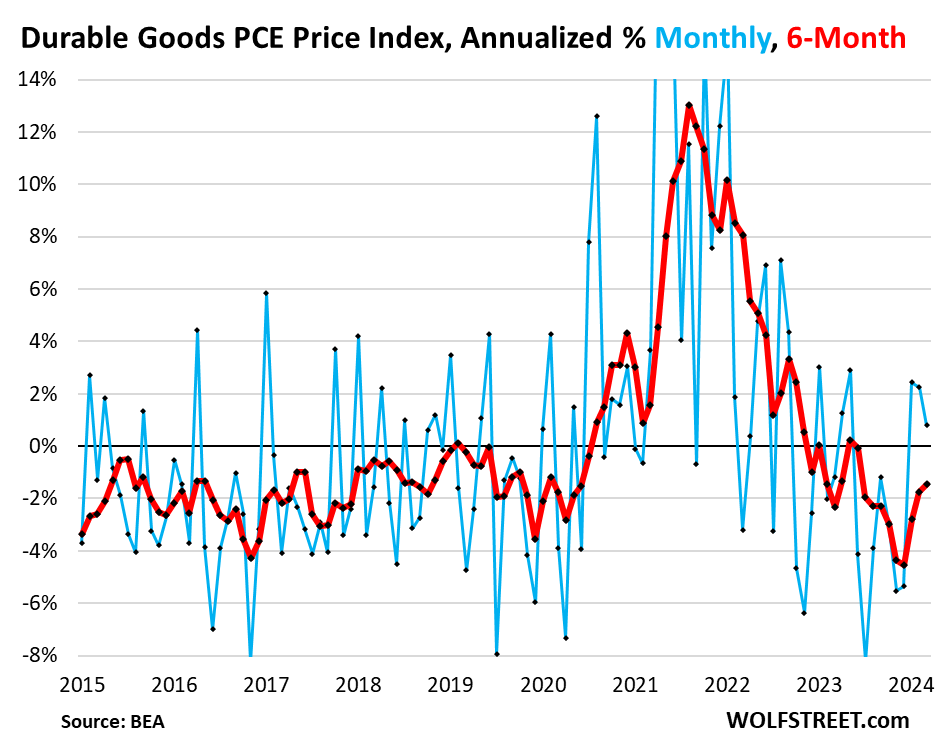
Durable goods PCE price index rose by 0.8% annualized in March from February, the third month in a row of positive readings, after the pandemic spike began to unwind with a series of negative readings (blue in the chart below). This raised the 6-month index to -1.4% (red).
Durable goods inflation is now normalizing, which reduces the counterbalance to hot inflation in services. The big negative inflation readings in 2023 of durable goods and energy had caused the very welcome cooling of inflation. But energy costs have been rising for months, and durable goods are rising again:
The overall PCE price index rose by 3.9% annualized in March from February, nearly double the Fed’s 2% target.
Year-over-year, it accelerated to 2.7%, second year-over-year acceleration in a row (blue in the chart below). The core PCE price index on a year-over-year basis rose by 2.8%, same as in February (red).
The majority portion of the year-over-year readings is composed of the “base effect” – the base of the calculation is the number a year ago – and what happened over the first six months of the 12-month time span. And those six months covered the sharp deceleration of inflation in mid-2023.
As seen in the month-to-month and three-month data above, the acceleration of inflation began happening in late 2023 and took off in leaps in 2024. It will take a while for these movements to dominate the year-over-year readings, which is why we look at monthly and three- or six-month readings because they give us a better feel of the current inflation trends. But with a lag, they will make their way into the year-over-year readings:
STAY INFORMED! Receive our Weekly Recap of thought provoking articles, podcasts, and radio delivered to your inbox for FREE! Sign up here for the HoweStreet.com Weekly Recap.
Wolf Richter April 27th, 2024
Posted In: Wolf Street
Next: This Week in Money »