ALWAYS CONSULT YOUR INVESTMENT PROFESSIONAL BEFORE MAKING ANY INVESTMENT DECISION

March 26, 2024 | The Most Splendid Housing Bubbles in America, March 2024 Update: Biggest Price Drops from 2022 Peak: San Francisco, Seattle, Portland, Denver, Phoenix, Dallas, Las Vegas

Wolf Richter


The home price index for the 20 metros that the S&P CoreLogic Case-Shiller Home Price Index covers declined by 0.1% from the prior month, the third month in a row of declines. Year-over-year, the index was up 6.6%.
Year-over-year, wait a minute… today’s “January” 2024 reading is three months off the October 2023 peak, while January 2023 was seven months off the June 2022 peak. Year-over-year comparisons are meaningful when the index is very seasonal, and comparisons match the high in the current year to the high in the prior year, and the low in the current year to the low in the prior year. But this is not the case here. The highs are in different seasons (June v. October), because they were caused by factors other than the slight (if any) seasonality of the Case-Shiller index.
So the year-over-year change (+6.6%) compares today’s “January” reading that is three months off the October peak to January 2023 that was seven months off the June peak and was the bottom of a non-seasonal trough. For that exact same reason, the year-over-year changes will diminish over the next few months.
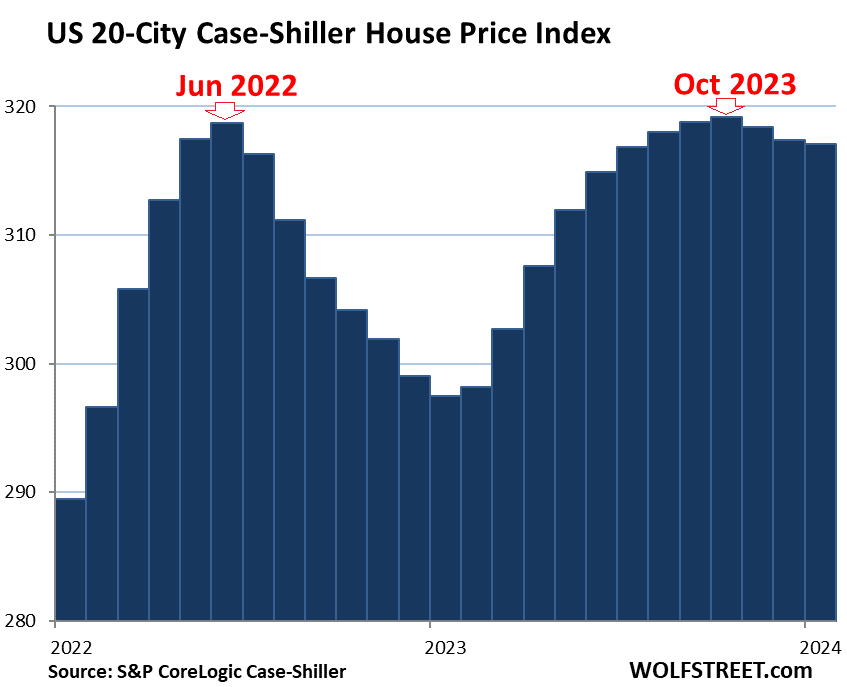
Today’s S&P CoreLogic Case-Shiller Home Price Index for “January” is a three-month moving average of home prices whose sales were entered into public records in November, December, and January. The fact that it is a three-month moving average irons out some of the seasonality.
The index uses the “sales-pairs method,” comparing the sales price of the same house over time, thereby eliminating the issues – including seasonality due to the seasonal change in mix – associated with median prices (see “Methodology” toward the end of the article).
The long view of the 20-Cities Index shows the mind-blowing surge over the past few years; and it shows a bizarre non-seasonal double top that has never occurred in the history of the index, with the first top in June 2022 and the second top in October 2023.
You can also see that there is little seasonality in the index going back over 20 years:
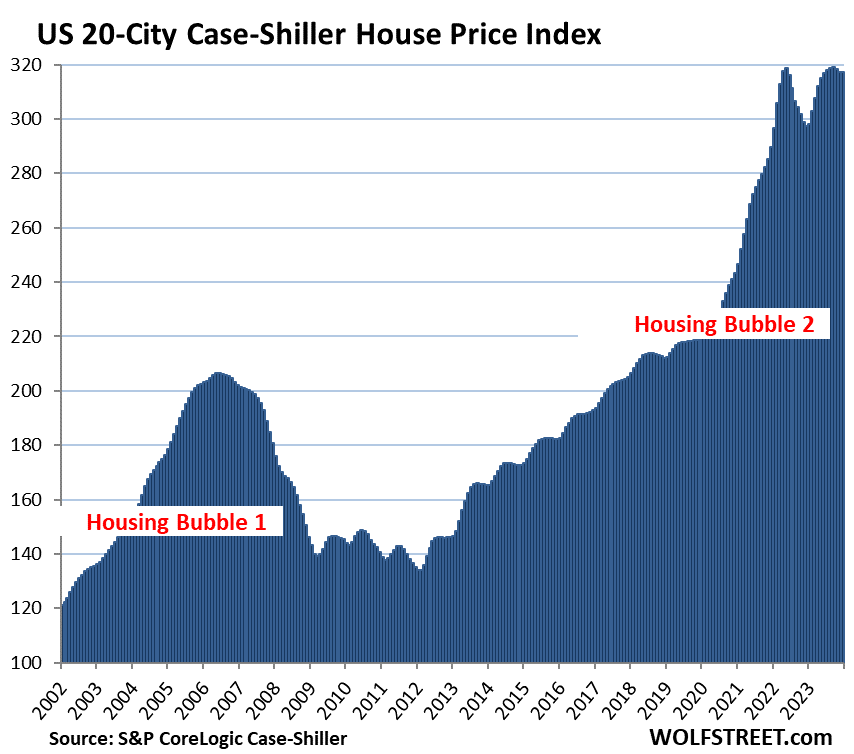
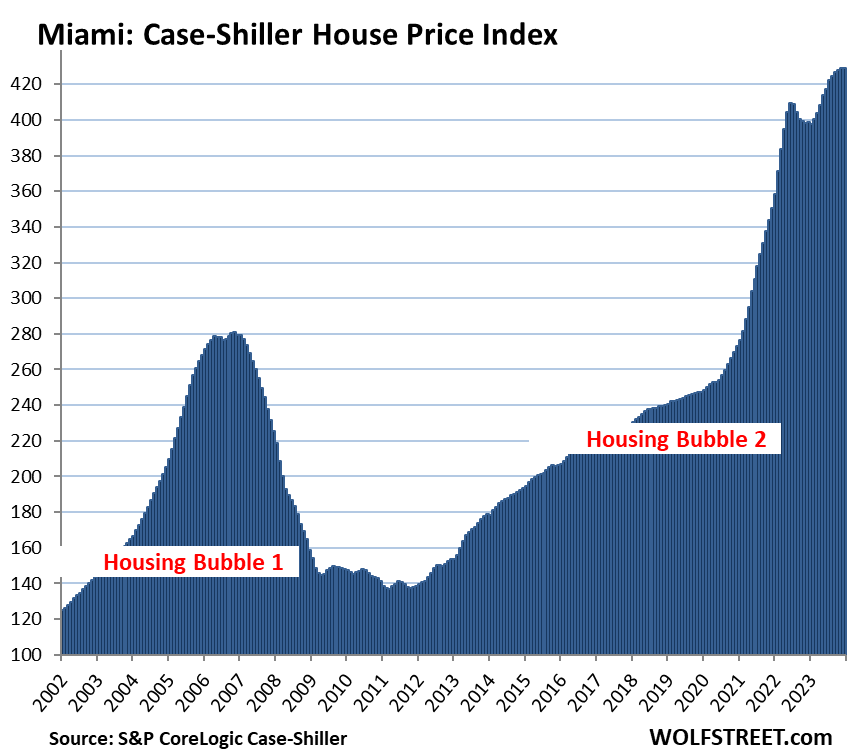
To qualify for the Most Splendid Housing Bubbles, the metro must have experienced home-price inflation since 2000 of at least 180%. The indices were set at 100 for the year 2000. Today’s index value for Miami, which we’ll get to in a moment, of 429 is up 329% since 2000, making Miami the most splendid housing bubble on this list.
Home-Price Inflation. By measuring how many dollars it takes to buy the same house over time via the “sales pairs” method, the Case-Shiller index is a measure of home-price inflation. So Miami had 329% home price inflation since 2000. By comparison, consumer price inflation, as measured by CPI, was 83% over the same period.
Prices were below their 2022 peaks in 9 metros of the 20 metros in the Case-Shiller index (% from their respective peak in 2022, month of peak):
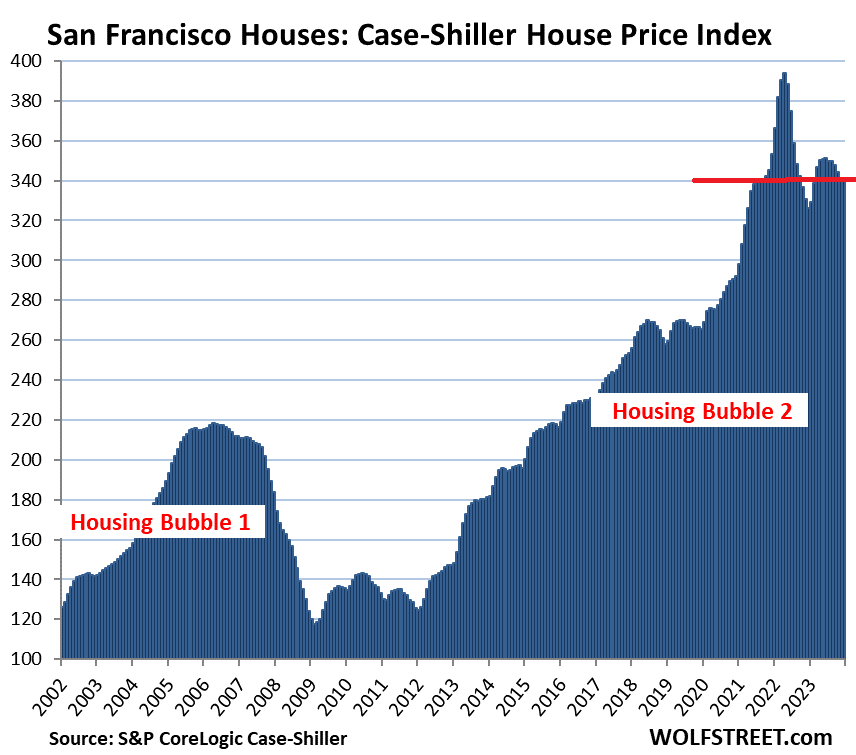
- San Francisco Bay Area: -13.4% (May 2022)
- Seattle: -12.6% (May 2022)
- Portland: -7.9% (May 2022)
- Denver: -7.1% (May 2022)
- Phoenix: -6.5% (June 2022)
- Dallas: -5.8% (June 2022)
- Las Vegas: -5.1% (July 2022)
- San Diego: -1.5% (May 2022)
- Los Angeles: -0.3% (May 2022)
A few more points:
- Month-to-month declines occurred in 17 of the 20 metros.
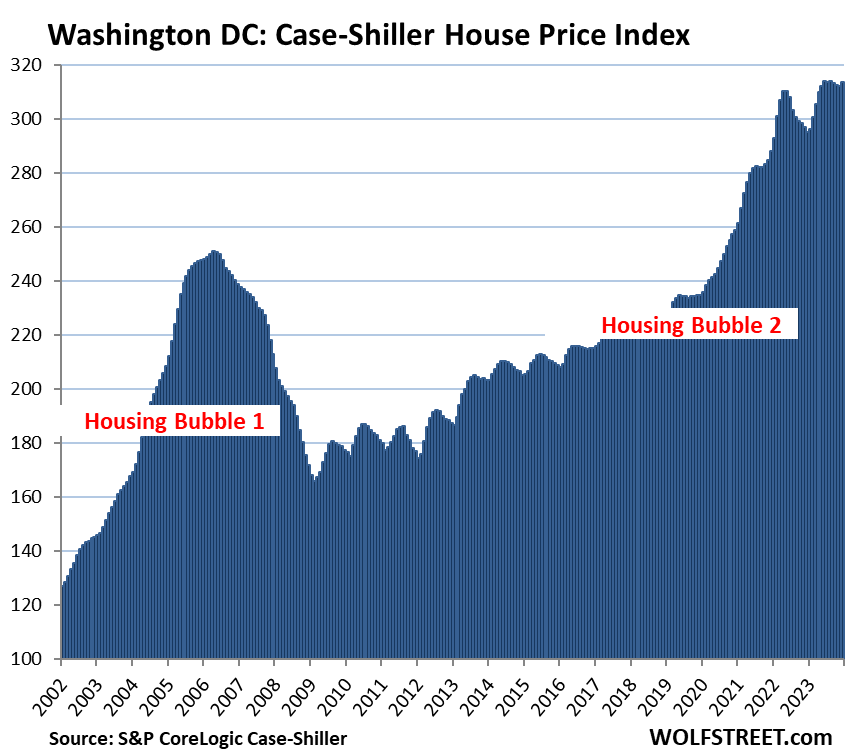
- Month-to-month increases occurred in 3 of 20 metros: Washington DC, Los Angeles, and San Diego.
- The indexes for Los Angeles and San Diego remained a tad below the 2022 peaks.
- One metro set a new high in January: Washington DC.
The most splendid housing bubbles by metro.
San Francisco Bay Area single family houses: the San Francisco metro here covers a five-county portion of the nine-county Bay Area (San Francisco, San Mateo, Contra Costa, Alameda, and Marin).
- Month to month: -0.1%
- Year over year: +4.5%
- From the peak in May 2022: -13.4%.
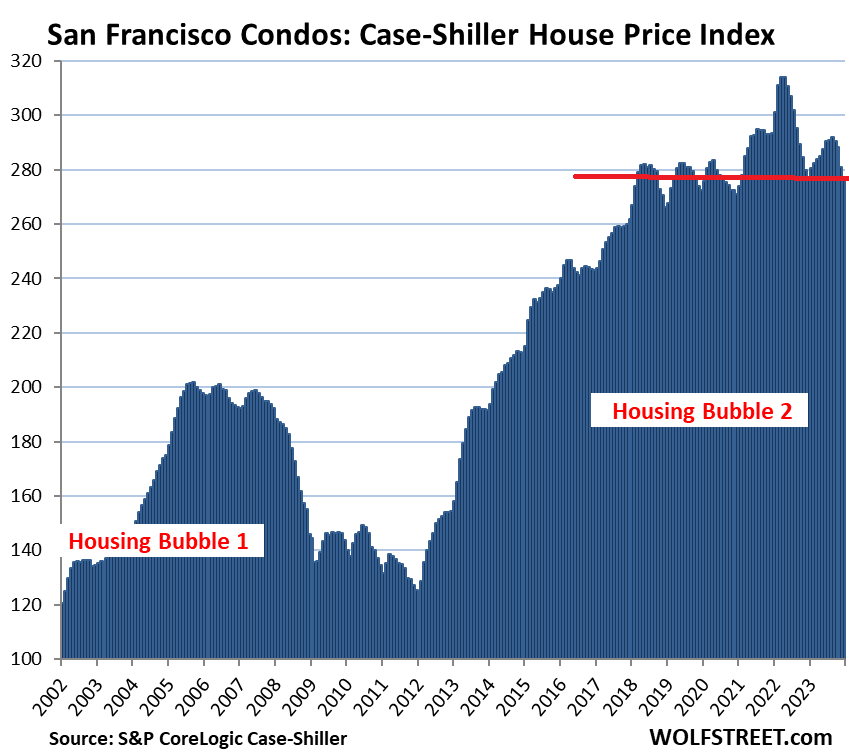
San Francisco Bay Area condos: Condos are a big part of the market in the Bay Area. In San Francisco itself, they dominate the market (data for a five-county portion of the Bay Area).
- Dropped to a level first seen 6 years ago, in April 2018
- Month to month: -1.5%
- Year over year: -0.1%
- From the peak in May 2022: -11.9%.
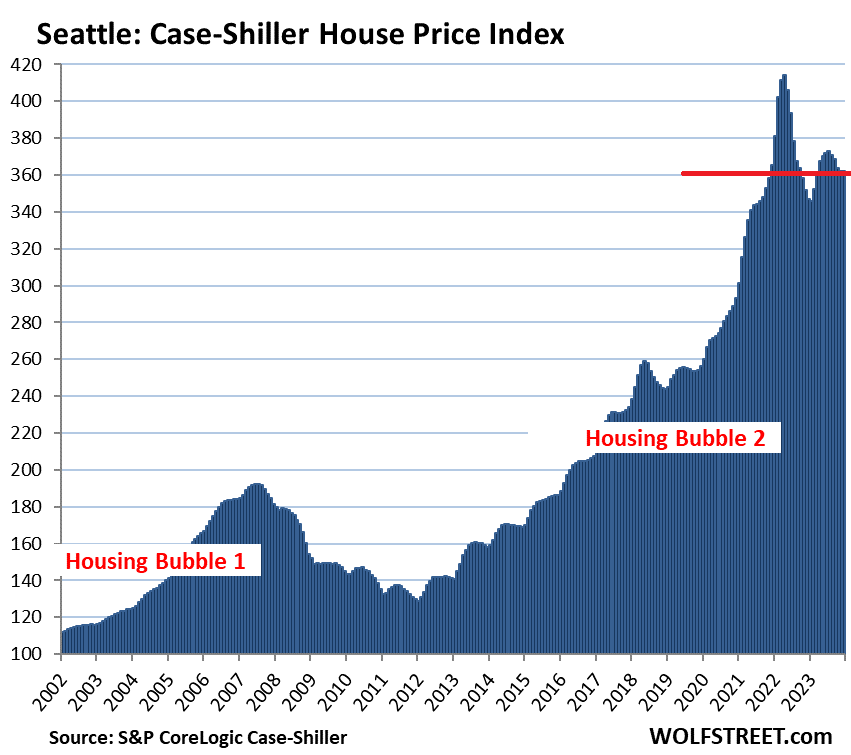
Seattle metro:
- Month to month: -0.02%.
- Year over year: +4.4%.
- From the peak in May 2022: -12.6%.
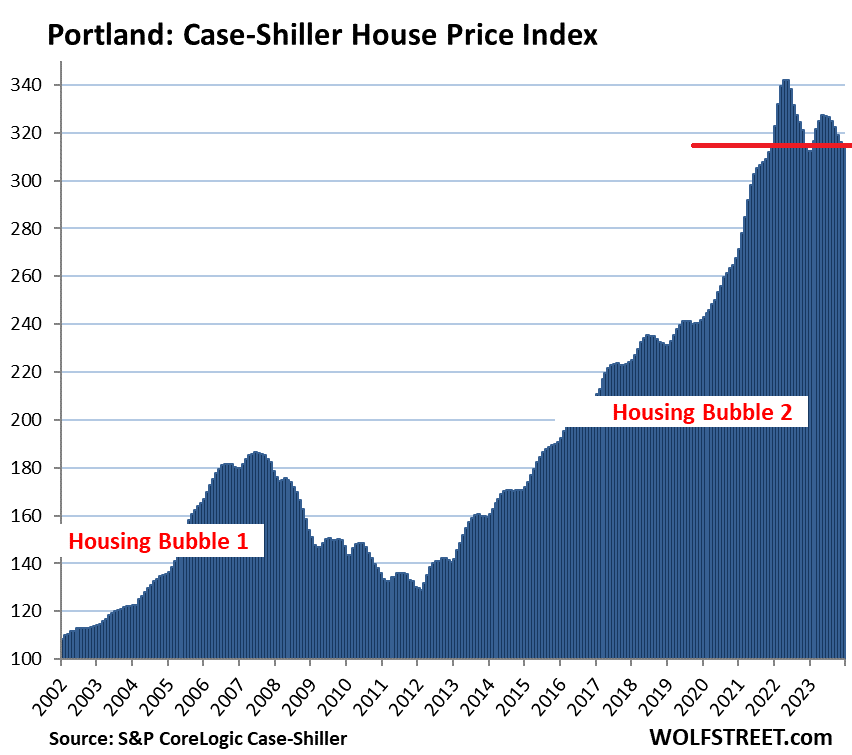
Portland metro:
- Month to month: -0.2%.
- Year over year: +0.9%.
- From the peak in May 2022: -7.9%.
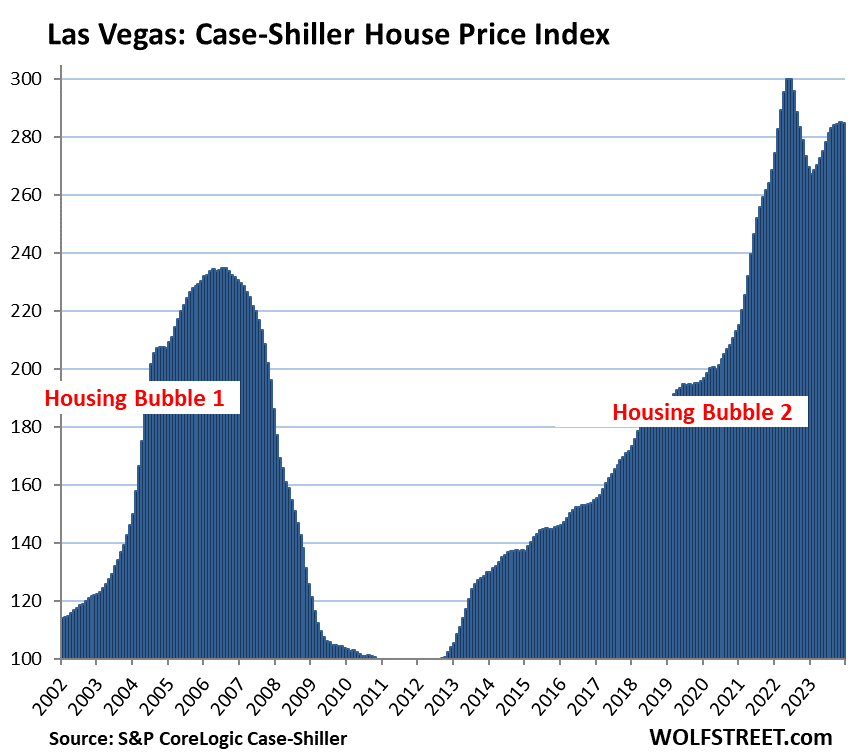
Las Vegas metro:
- Month to month: -0.1%.
- Year over year: +5.6%.
- From the peak in July 2022: -5.1%.
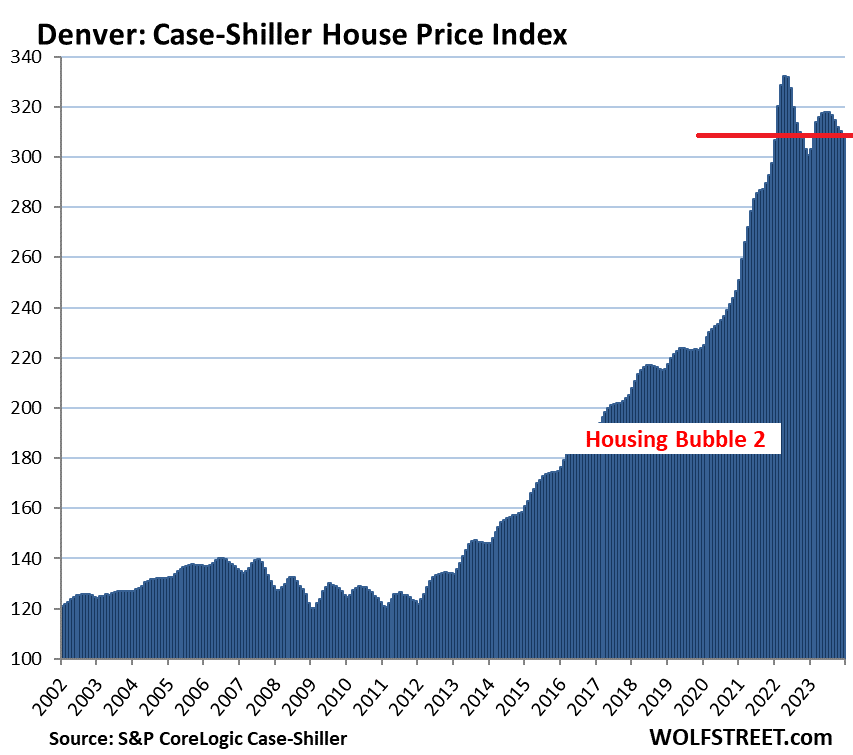
Denver metro:
- Month to month: -0.5%.
- Year over year: +2.7%.
- From the peak in May 2022: -7.1%.
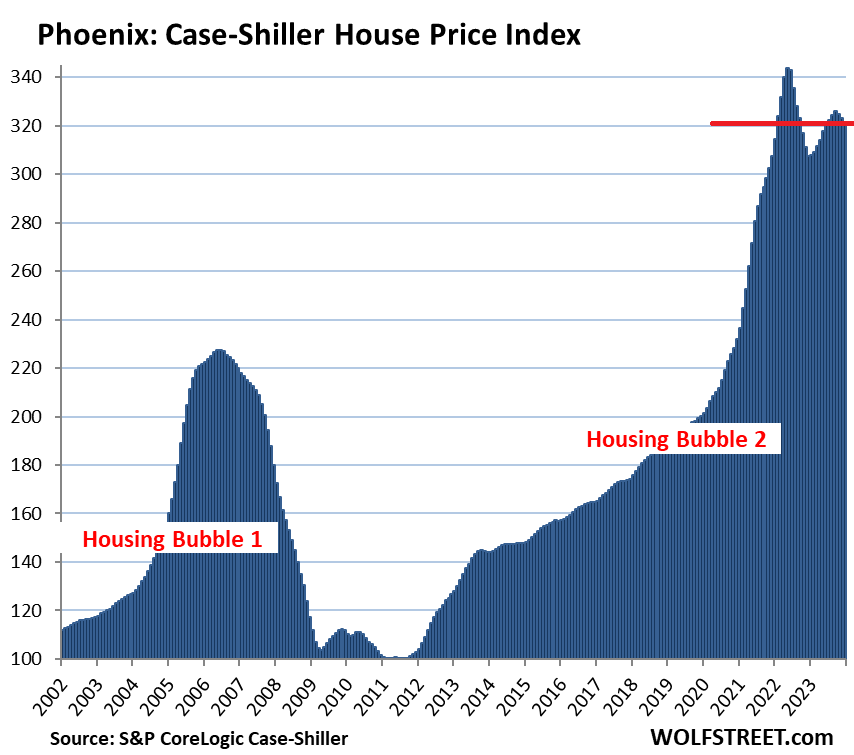
Phoenix metro:
- Month to month: -0.5%.
- Year over year: +4.6%.
- From the peak in June 2022: -6.5%.
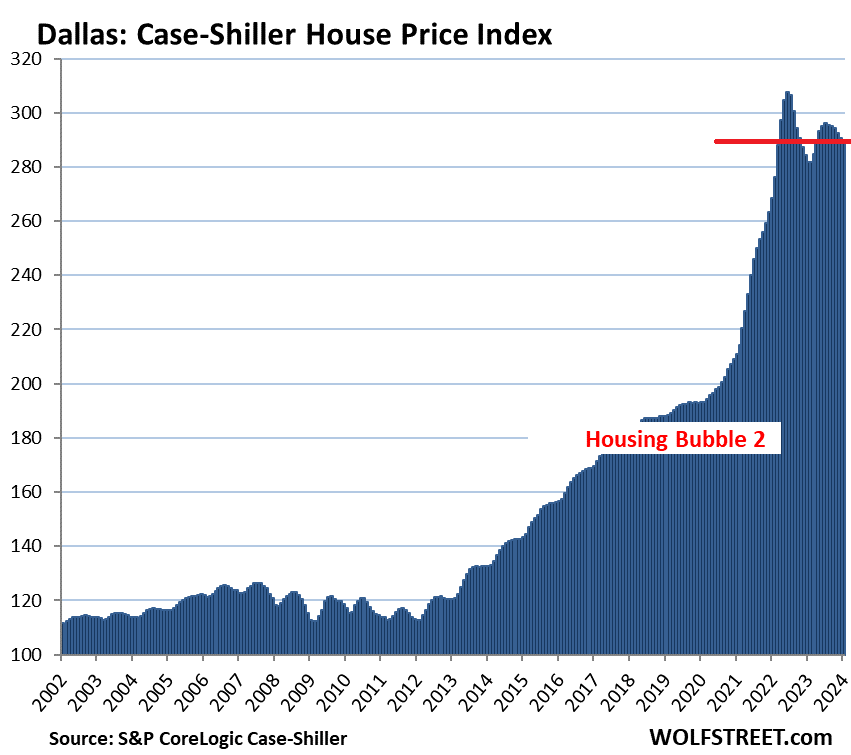
Dallas metro:
- Month to month: -0.2%.
- Year over year: +2.9%.
- From the peak in June 2022: -5.8%.
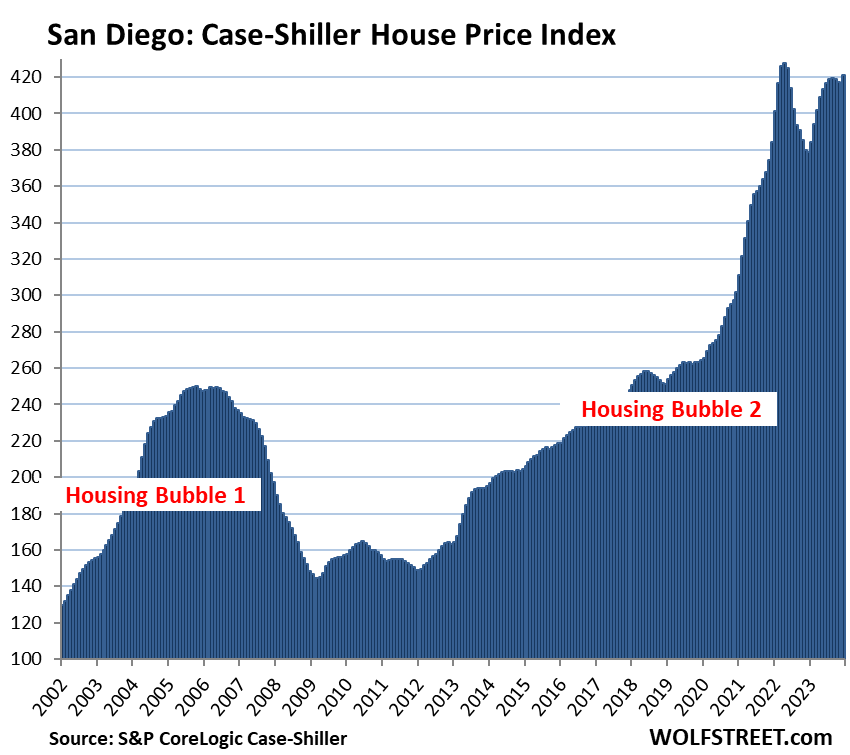
San Diego metro:
- Month to month: +1.8%.
- Year over year: +11.2%.
- From the peak in May 2022: -1.5%.
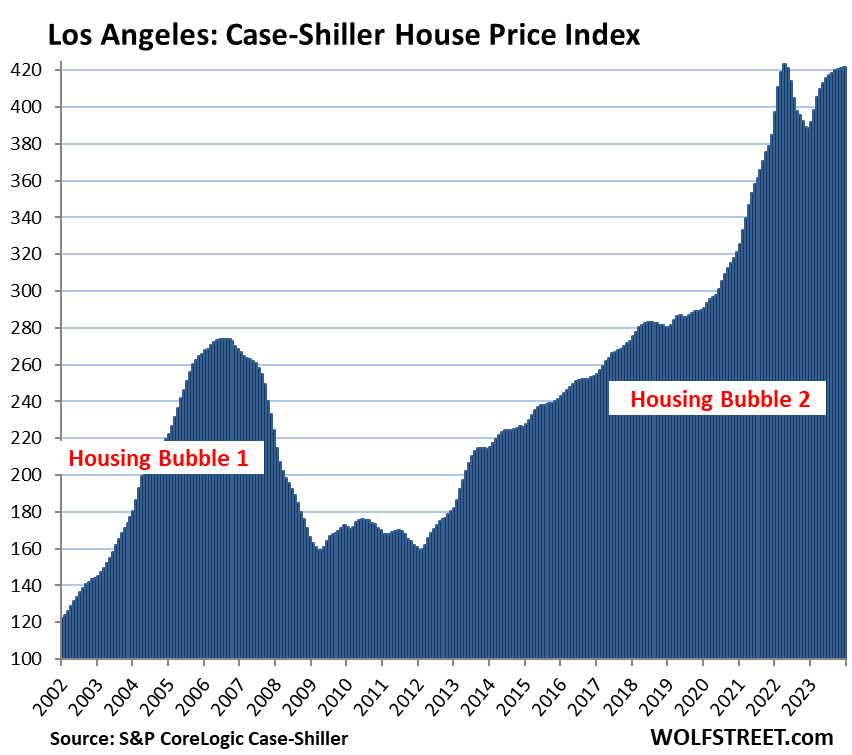
Los Angeles metro
- Month to month: +0.1%.
- Year over year: +8.6%.
- From the peak in May 2022: -0.3%.
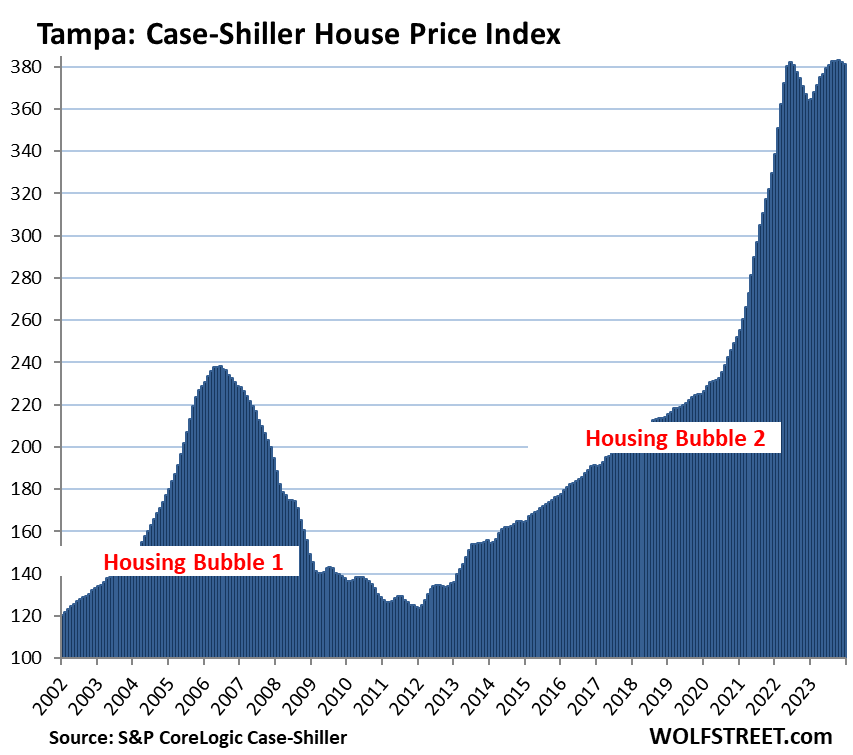
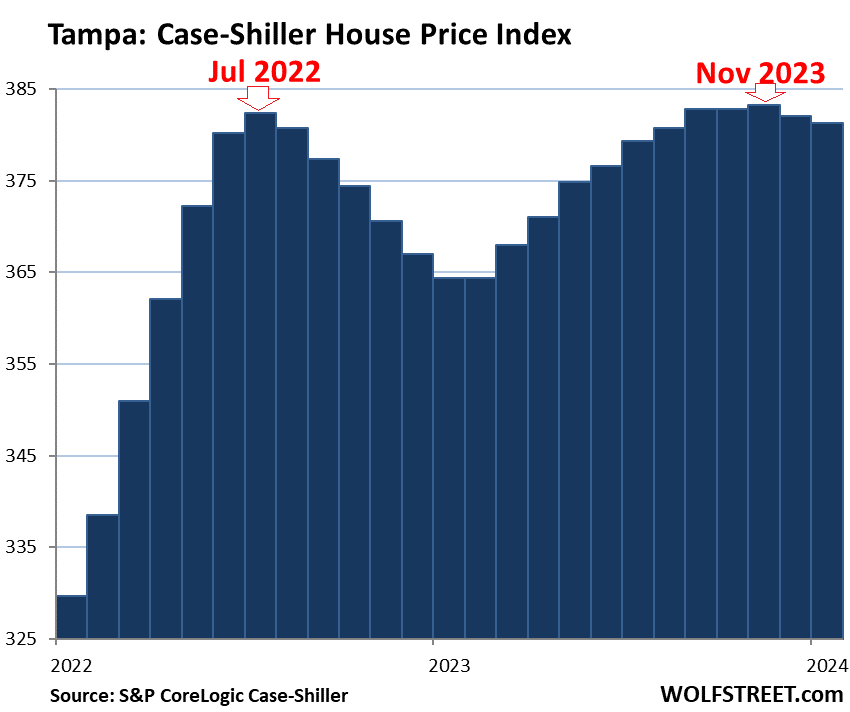
Tampa metro:
- Month to month: -0.2%.
- Year over year: +4.6%.
- From high in November 2023: -0.5%.
And the close-up of Tampa. It repeats the common theme here: The two highs were in different seasons, and not caused by seasonal factors, thereby creating these odd year-over-year comparisons that will revert over the next few months.
Washington D.C. metro:
- Month to month: +0.5%.
- Year over year: +6.3%.
- Set new high.
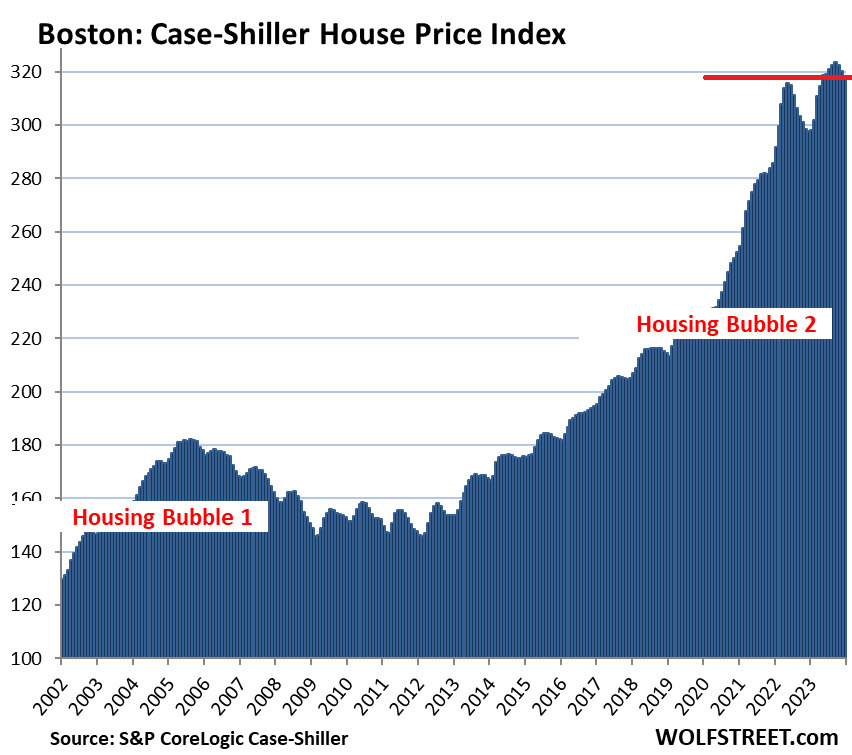
Boston metro:
- Month to month: -0.5%.
- Year over year: +7.0%.
- From high in October 2023: -1.5%.
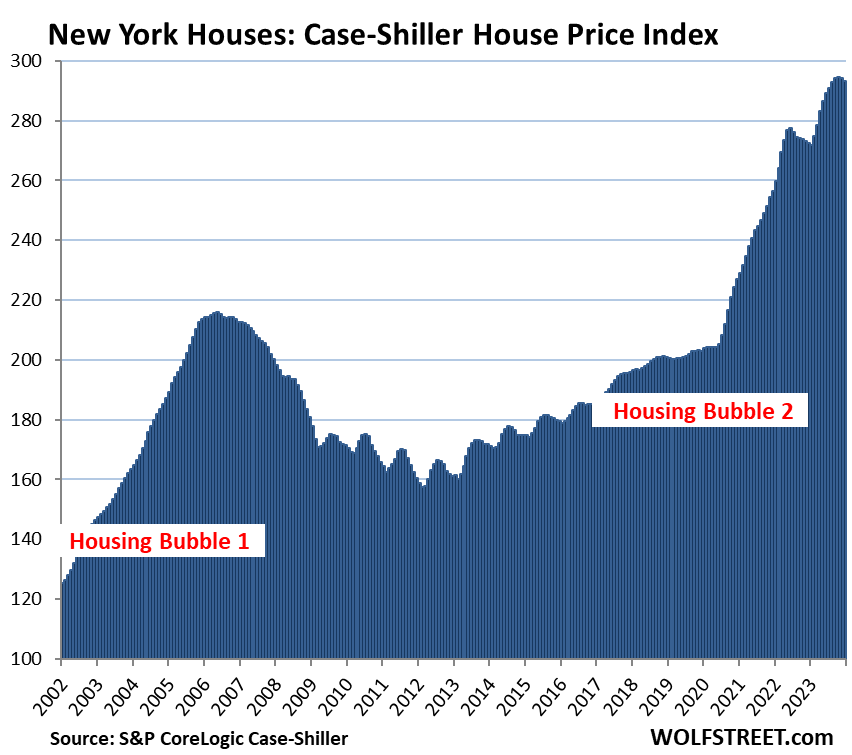
New York metro:
- Month to month: -0.3%.
- Year over year: +7.6%.
- From high in November 2023: -1.4%.
Miami metro:
- Month to month: -0.1%
- Year over year: +7.5%.
- “December” had set a new high.
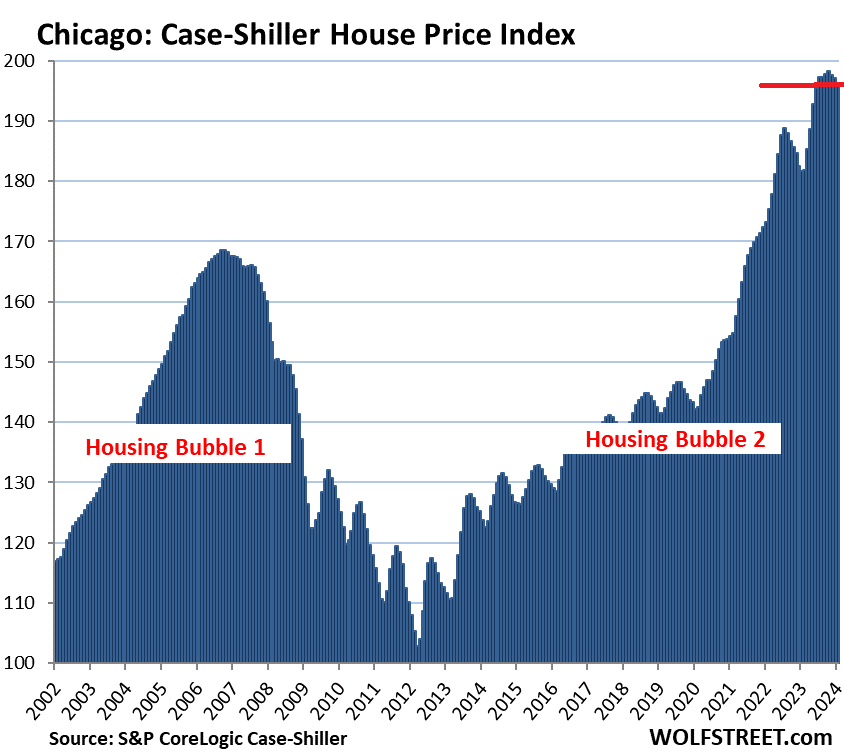
The remaining 6 of the 20 metros in the Case-Shiller index (Chicago, Charlotte, Minneapolis, Atlanta, Detroit, and Cleveland) had less home-price inflation than 180% since 2000, despite the price spikes in recent years.
Chicago, with an index value of 196 is up by 96% from 2000, and therefore is a far cry from qualifying for this list of the Most Splendid Housing Bubbles, but prices shot up majestically between May 2020 and October 2023, and so here is Chicago anyway:
- Month to month: -0.5%
- Year over year: +8.0%.
- From high in October 2023: -1.1%.
Methodology. The Case-Shiller Index uses the “sales pairs” method, comparing sales in the current month to when the same houses were sold previously. The price changes are weighted based on how long ago the prior sale occurred, and adjustments are made for home improvements and other factors. This “sales pairs” method makes the Case-Shiller index a more reliable indicator than median price indices (37-page methodology).
STAY INFORMED! Receive our Weekly Recap of thought provoking articles, podcasts, and radio delivered to your inbox for FREE! Sign up here for the HoweStreet.com Weekly Recap.
Wolf Richter March 26th, 2024
Posted In: Wolf Street