ALWAYS CONSULT YOUR INVESTMENT PROFESSIONAL BEFORE MAKING ANY INVESTMENT DECISION

April 12, 2023 | Services Inflation Rages, Durable Goods Prices Rise Again after 6 Months of Declines. Food Inflation Backs Off, Energy Plunges

Wolf Richter


he Consumer Price Index (CPI) for March, released today by the Bureau of Labor Statistics, was marked by plunging energy prices and surging services prices. Food inflation slowed, and month to month actually dipped for the first time in nearly three years. But durable goods inflation month-to-month suddenly rose again, after having been negative for six months, reminding us that inflation is a game of Whac A Mole:
- Services without energy services: annual inflation jumped by 7.1% from a year ago, after the four-decade high of 7.3% in February, driven by housing, food services (food away from home), auto insurance, repair services, airline fares, pet services, and hotels.
- Food at home: inflation dipped in March from February (-0.3%), the first dip since November 2020. Year-over-year, prices increased at the slowest rate since January 2022 (+8.4%).
- Energy inflation plunged month to month (-3.5%), and year-over-year (-6.4%), driven by a plunge in prices of gasoline and natural gas.
- Durable goods prices rose month-to-month (+0.4%), the first rise since last August. Year-over-year, the index dipped at the slowest pace this year (-1.0%), on a smaller price decline in used vehicles and price increases in new vehicles and household furnishings and appliances.
- Core CPI: rose 0.4% month-to-month, in the same range for the fourth month in a row. Year-over-year, core CPI accelerated again (+5.6%), after decelerating since September.
- Overall CPI (CPI-U): +0.1% month-to-month, +5.0% year-over-year.
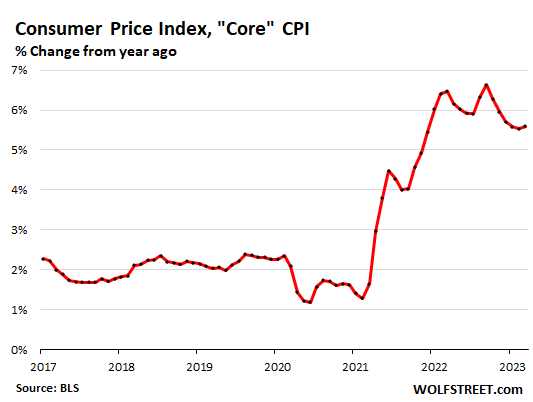
“Core” CPI.
Core CPI – without the volatile food and energy products that consumer buy – jumped by 5.6% year-over-year, hotter than the 5.5% increase in the prior month, and the first year-over-year increase since September:
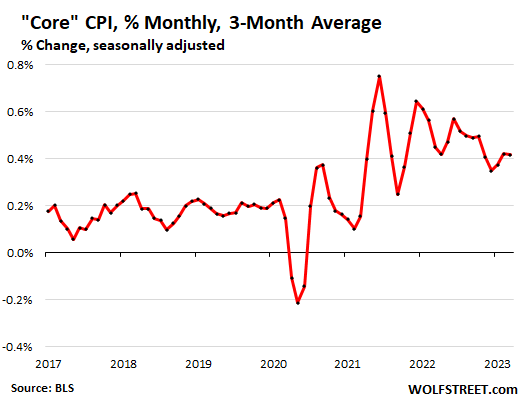
Month-over-month, core CPI jumped by 0.4%, driven by raging inflation in services, and now suddenly by a jump in durable goods inflation.
To see the trends amid these big monthly ups and downs, here is the three-month moving average of core CPI.
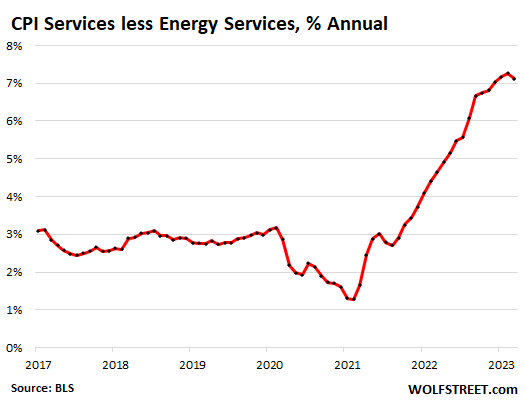
Core Services inflation (without energy services).
The CPI for services inflation without energy services jumped by 7.1% from a year ago, after the 7.3% jump in February. This was the fourth month in a row at 7%-plus, the highest range since 1982. Nearly two-thirds of consumer spending goes into services.
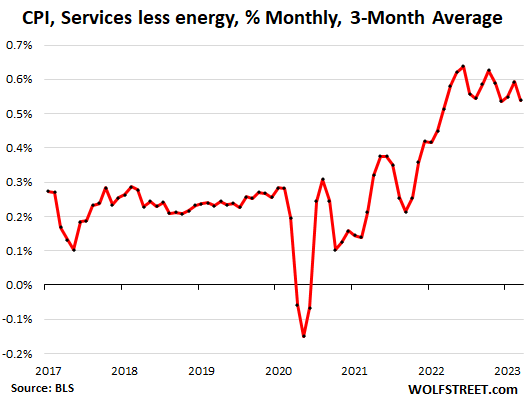
Month-to-month, services inflation without energy services jumped by 0.4% in March, down from the 0.6% jump in February. Month-to-month moves are volatile. The trends show up better in the three-month moving average of the month-to-month changes, and you can see that it has slowed in recent months just a tiny bit from last summer and remains at about double the rate before the pandemic:
| Major Services without Energy | Weight in CPI | MoM | YoY |
| Services without energy | 62.1% | 0.4% | 7.1% |
| Airline fares | 0.6% | 4.0% | 17.7% |
| Motor vehicle insurance | 2.6% | 1.2% | 15.0% |
| Motor vehicle maintenance & repair | 1.1% | 0.3% | 13.3% |
| Pet services, including veterinary | 0.5% | 0.5% | 8.6% |
| Food services (food away from home) | 4.8% | 0.6% | 8.8% |
| Rent of primary residence | 7.5% | 0.5% | 8.8% |
| Owner’s equivalent of rent | 25.4% | 0.5% | 8.0% |
| Postage & delivery services | 0.1% | 0.3% | 6.7% |
| Hotels, motels, etc. | 1.0% | 3.1% | 8.1% |
| Recreation services, admission to movies, concerts, sports events | 3.1% | 0.0% | 5.9% |
| Other personal services (dry-cleaning, haircuts, legal services…) | 1.4% | 0.5% | 5.3% |
| Water, sewer, trash collection services | 1.1% | 0.3% | 5.4% |
| Video and audio services, cable | 1.0% | 0.9% | 5.8% |
| Medical care services & insurance | 6.5% | -0.5% | 1.0% |
| Education and communication services | 4.9% | 0.3% | 3.3% |
| Tenants’ & Household insurance | 0.4% | 0.0% | 0.9% |
| Car and truck rental | 0.1% | -3.8% | -8.9% |
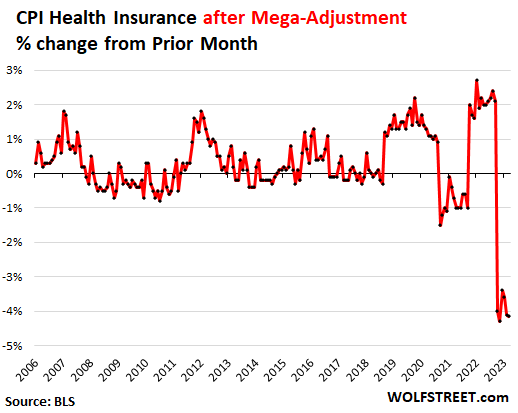
Reminder: Health insurance mega-adjustment understates CPI, core CPI, services CPI, and Medical Services CPI for another six months.
BLS undertakes annual adjustments in how it estimates the costs of health insurance and then spreads those adjustments over the following 12 months. For the 12 months through September 2022, CPI overestimated health insurance inflation (+28% yoy in September 2022). That over-estimation has been getting deducted every month, starting with the first mega-adjustment in October 2022 (more here),and this will continue through September 2023.
This mega-adjustment of the CPI for health insurance understates overall CPI, core CPI, services CPI, and Medical Services CPI.
So the CPI for health insurance plunged by 4.2% in March from February by 10.7% year-over-year.
The Fed’s favored inflation measure, the PCE price index, figures health insurance inflation differently and didn’t suffer these adjustments.
The CPI for housing as a service.
The CPI for housing as a service is based on rent factors, primarily “Rent of primary residence” (weight: 7.5% of total CPI) and “Owner’s equivalent rent of residences” (weight: 25.4% of total CPI).
“Rent of primary residence” tracks actual rents paid by tenants in houses and apartments, including rent-controlled units. The survey follows the same large group of housing units over time and tracks what tenants in them are actually paying in these units.
Not “asking rents.” Other rent indices, such as the Zillow rent index, track “asking rents,” which are advertised rents of vacant units on the market. The huge double-digit spike last year in asking rents never fully made it into the CPI indices because rentals don’t turn over that much, and proportionately not many people actually ended up paying those spiking asking rents. Now those asking rents have backed off from that spike, but this backing off won’t be fully reflected either since the spike wasn’t fully reflected to begin with.
“Owner’s equivalent rent of residences” tracks the costs of homeownership as a service, based on what a large panel of homeowners report their home would rent for.
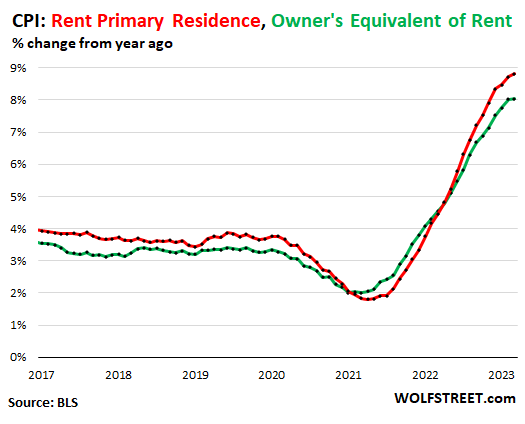
Both rent factors jumped:
- Rent of primary residence: +0.5% for the month, + 8.8% year-over-year, worst since 1982 (red)
- Owner’s equivalent +0.5% for the month, +8.0% year-over-year. Along with February (+8.0%), the worst in the data (green)
We can now see that the month-to-month increases are less hot than they were, and that year-over-year the two measures are now peaking.
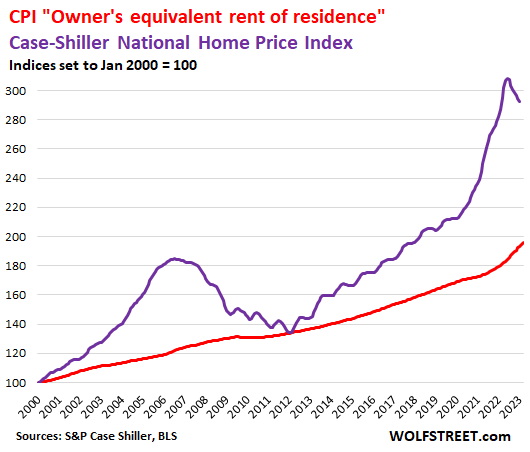
Compared to Home prices: The Case-Shiller Home Price Index peaked with the report called “June” then started to decline [by city: The Most Splendid Housing Bubbles in America]. The most recent data point is the three-month moving average of November, December, and January (purple in the chart below).
The red line represents “owner’s equivalent rent of residence.” Both lines are index values, not percent-changes of index values:
Food inflation.
The CPI for “food at home” – food bought at stores and markets – fell by 0.3% in March from February, the first month-to-month decline since November 2020.
Year-over-year, the CPI for food at home rose by 8.4%, the least-hot increase since January 2022, after 12 months in a row of double-digit increases. Most major categories booked month-to-month declines. Egg prices, which had spiked during the avian flu price distortions, are making their way back to earth.
| Food at home by category | MoM | YoY |
| Overall Food at home | -0.3% | 8.4% |
| Cereals and cereal products | 0.6% | 12.8% |
| Beef and veal | -0.3% | -1.9% |
| Pork | -1.1% | -0.6% |
| Poultry | -0.4% | 7.5% |
| Fish and seafood | -1.2% | 2.6% |
| Eggs | -10.9% | 36.0% |
| Dairy and related products | -0.1% | 10.7% |
| Fresh fruits | -1.7% | -1.5% |
| Fresh vegetables | -1.7% | 1.4% |
| Juices and nonalcoholic drinks | 0.3% | 11.7% |
| Coffee | -0.4% | 10.3% |
| Fats and oils | -0.6% | 15.9% |
| Baby food & formula | -0.4% | 7.6% |
| Alcoholic beverages at home | -0.2% | 3.9% |
Energy prices:
The biggest part here is the plunge in gasoline prices after the crazy two-year spike that is now getting unwound.
| CPI for Energy, by Category | MoM | YoY |
| Overall Energy CPI | -3.5% | -6.4% |
| Gasoline | -4.6% | -17.4% |
| Utility natural gas to home | -7.1% | 5.5% |
| Electricity service | -0.7% | 10.2% |
| Heating oil, propane, kerosene, firewood | -2.5% | 10.8% |
Durable goods prices: first increase in six months.
In a very unwelcome development, the CPI for durable goods rose month-to-month for the first time after six months of declines. This increase reduced the year-over-year decline to -1.0%. It may indicate that the decline of durable goods prices has already bottomed out.
Durable goods were a big force in pushing down core CPI, while services were pushing up core CPI. If durable goods prices are taking off again, it would be a very unwelcome development, but would be typical for entrenched inflation, which is like a game of Whac A Mole. By the time you hammer one down, another one pops up again.
The CPI for durable goods, expressed as index value (not as percent change) shows the spike in late 2020 through mid-2022. Prices started to drop last fall, driven by sharp declines in used vehicles and consumer electronics. But in March, prices rose again:
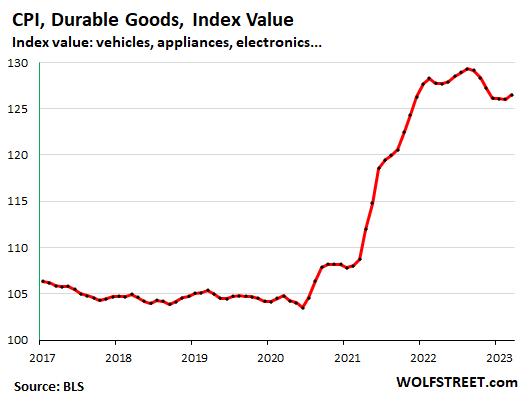
I want to point out that wholesale auction prices of used vehicles have been rising for four months. There is normally a lag of a couple of months before changes in wholesale prices show up in retail price measures, such as CPI. The wholesale-price increase hasn’t shown up yet in CPI. This may still play out over the next few months.
| Durable goods by category | MoM | YoY |
| Durable goods overall | 0.4% | -1.0% |
| Information technology (computers, smartphones, etc.) | -0.4% | -11.5% |
| Used vehicles | -0.9% | -11.2% |
| Sporting goods (bicycles, equipment, etc.) | -0.6% | 1.1% |
| New vehicles | 0.4% | 6.1% |
| Household furnishings (furniture, appliances, floor coverings, tools) | 0.4% | 5.8% |
STAY INFORMED! Receive our Weekly Recap of thought provoking articles, podcasts, and radio delivered to your inbox for FREE! Sign up here for the HoweStreet.com Weekly Recap.
Wolf Richter April 12th, 2023
Posted In: Wolf Street