ALWAYS CONSULT YOUR INVESTMENT PROFESSIONAL BEFORE MAKING ANY INVESTMENT DECISION

February 16, 2023 | The Most Splendid Housing Bubbles in Canada: February Update on the Housing Bust

Wolf Richter


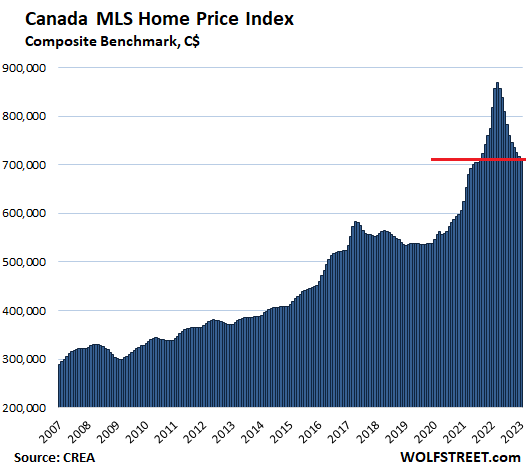
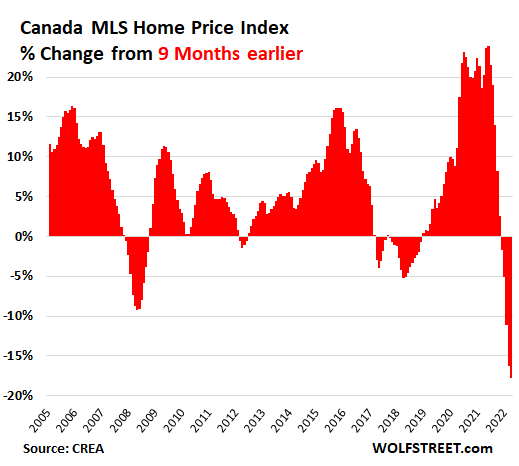
ome sales in Canada plunged by 37% in January, compared to a year earlier, amid rising inventory. Home prices dropped by 0.5% in January from December, by 12.6% year-over-year, and by 17.8% from the peak in March 2022, the 10th month-to-month decline in a row, according to the Canada Composite Home Price Index by the Canadian Real Estate Association (CREA).
At C$713,700, the Composite Benchmark Index for all types of homes has now plunged by C$167,400 in 10 months to the lowest level since August 2021.
This is the hangover after the drunken party instigated by the Bank of Canada’s money-printing binge and interest-rate repression. It started in March 2020, instantly turned buyers’ brains to mush, and lasted until March 2022, when the BoC’s lift-off rate hike took away the booze.
Over those 10 months since lift-off, the BoC has now raised its main policy rate by 425 basis points to 4.5%. After the January meeting, BoC Governor Tiff Macklem said that the BoC would pause to judge the effectiveness of the rate hikes and think carefully about the next steps. But with inflation still at 6.3%, “the question really we’re asking ourselves is, ‘Have we done enough?,’ We’re pausing to assess whether we’ve done enough,” he said.
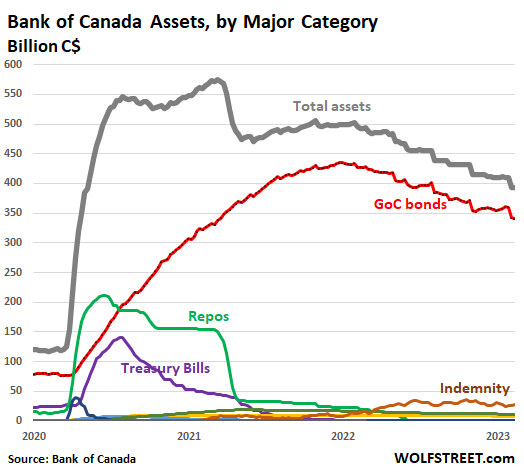
The BoC started QT long before the Fed and has by now shed 32% of its total assets (gray line). It has trimmed its Government of Canada bonds by 21.5%. It has gotten rid of nearly all its other assets. It started warning about the housing bubble in the spring of 2021 when it began unloading assets:
Unlike the US, Canada’s housing market blew through the Financial Crisis with just a few feathers ruffled and then entered one of the world’s biggest housing bubbles.
In terms of home prices, the 10-month drop of 17.8% was by far the deepest and fastest 10-month drop in CREA’s data going back to 2005. But this is now a real housing bust in the making. Homes are being repriced on a large scale from ridiculous highs:
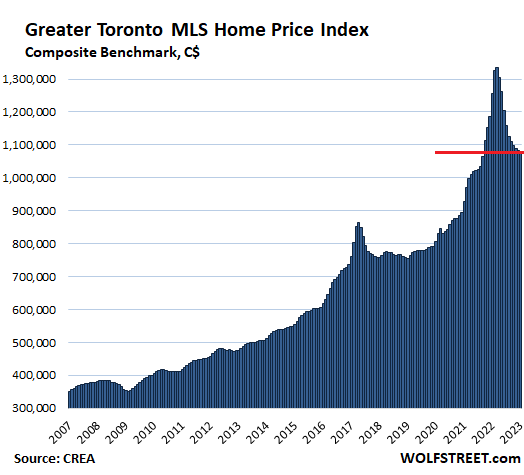
Greater Toronto Area: The MLS Home Price Index composite benchmark price declined 0.2% for the month to C$1.079 million:
- From peak in March 2022: -19.2%
- Year-over-year: -14.2%
- Drop in 10 months from peak in March 2022: -C$256,100
- Jump in 10 months to peak in March 2022: C$316,500
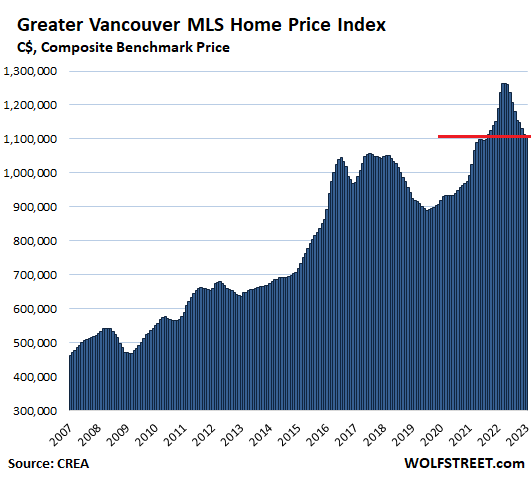
Greater Vancouver: The MLS Home Price Index composite benchmark price dropped 0.3% for the month to C$1.11 million:
- From peak in April 2022: -12.1%
- Year-over-year: -6.6%
- Drop in 9 months from peak in April 2022: -C$153,300
- Jump in 9 months to peak in April 2022: +C$169,700
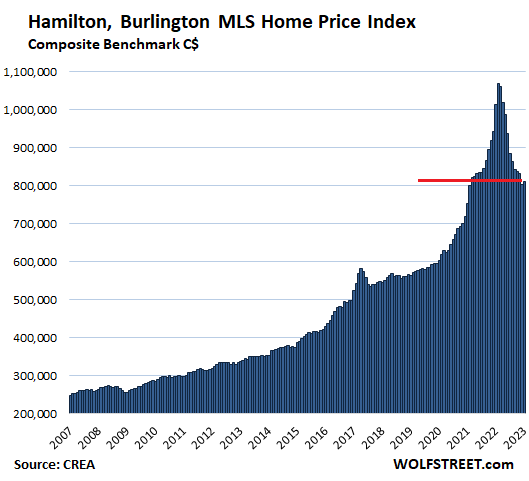
Hamilton-Burlington metro: After plunging 3.3% in December from November, and by about 25% from the peak in February 2022, the MLS Home Price Index composite benchmark price rose 0.8%, to C$809,800.
From the beginning of the Bank of Canada’s money-printing binge in March 2020, the index had spiked 70% in 23 months. And so far, over those 11 months, home prices plunged faster (-C$259,000) than they’d spiked during the last 11 month of the run-up (+C$248,300).
- From peak in February 2022: -24.2%
- Year-over-year: -20.0%
- Drop in 11 months from peak in February 2022: -C$259,000.
- Jump in 10 months to peak in February 2022: +C$248.300
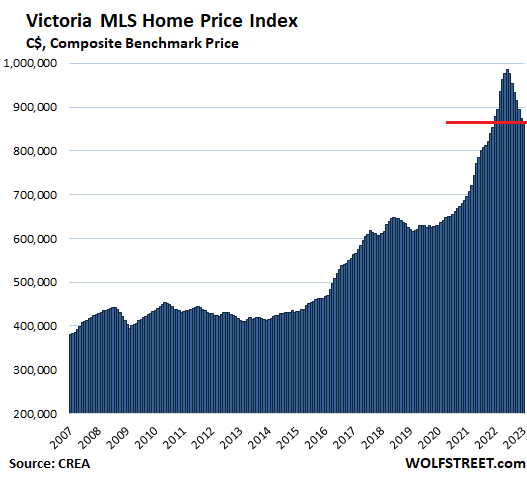
Victoria: The composite benchmark price dropped by 0.7% for the month to C$866,700:
- From peak in June 2022: -12.0%
- Year-over-year: -1.3%
- Drop in 6 months from peak in June 2022: -C$118,800
- Jump in 6 months to peak in June 2022: +C$164,300
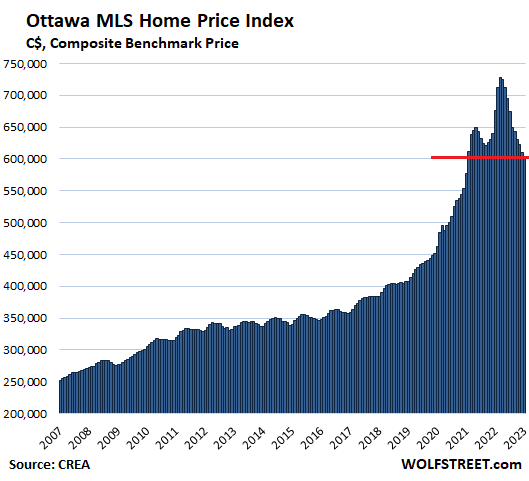
Ottawa: The composite benchmark price dropped 1.1% for the month to C$603,900 – the lowest since February 2021:
- From peak in March 2022: -17.1%
- Year-over-year: -10.7%
- Drop in 10 months from peak in March 2022: -C$124,300 – going down far faster than up
- Jump in 10 months to peak in March 2022: +C$78,800.
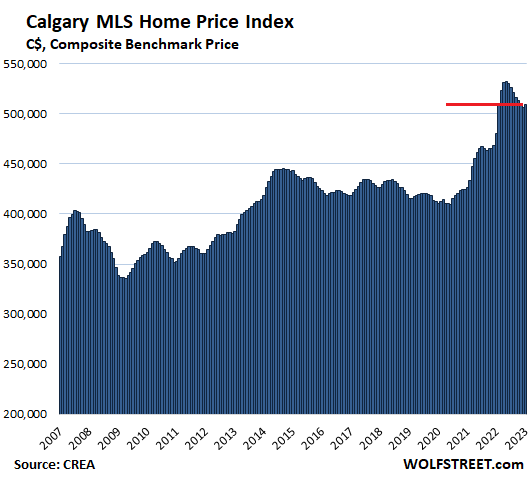
Calgary, Canada’s oil capital: The composite benchmark price rose 0.7% for the month, after seven months of declines, to C$509,900:
- From peak in May 2022: -4.2%
- Year-over-year: +6.1%
- Drop in 8 months from peak in May 2022: -C$22,300
- Jump in 9 months to peak in May 2022: +C$68,900:
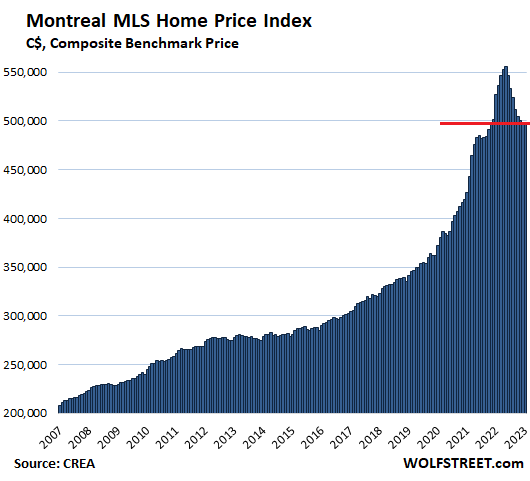
Montreal: The composite benchmark price was unchanged for the month at C$498,000:
- From peak in May 2022: -10.4%
- Year-over-year: -5.5%
- Drop in 8 months from peak in May 2022: -C$57,600
- Jump in 7 months to peak in May 2022: +C$71,800:
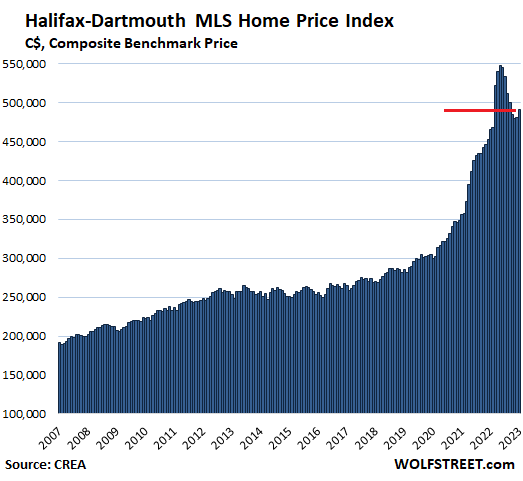
Halifax-Dartmouth: What happened was just nuts. From February 2020 to the peak in May 2022, the benchmark price spiked by 81%, before it began unwinding.
The composite benchmark price, after huge plunges late last year, jumped by 2.1% in January from December, to C$490,700.
- From peak in May: -10.4%
- Year-over-year: +5.4%
- Drop in 8 months since peak in May: -C$57,100
- Jump in 8 months to peak in May: +C$113,100:
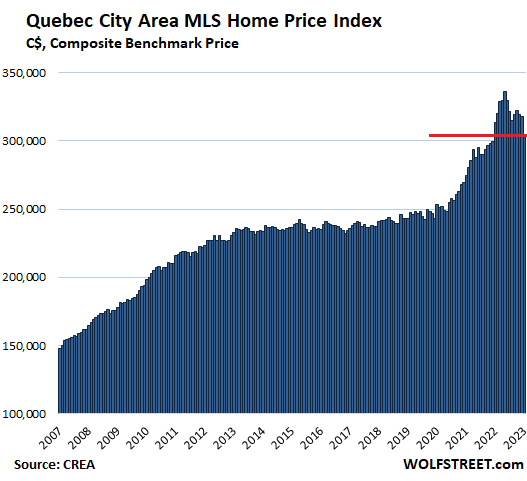
Quebec City Area: The composite benchmark price plunged by 4.2% for the month to C$304,800:
- From peak in May: -9.3%
- Year-over-year: -2.8%
- Drop in 8 months since peak in May: -C$31,200
- Jump in 7 months to peak in May: +C$42,500:
STAY INFORMED! Receive our Weekly Recap of thought provoking articles, podcasts, and radio delivered to your inbox for FREE! Sign up here for the HoweStreet.com Weekly Recap.
Wolf Richter February 16th, 2023
Posted In: Wolf Street