ALWAYS CONSULT YOUR INVESTMENT PROFESSIONAL BEFORE MAKING ANY INVESTMENT DECISION

January 31, 2023 | The Most Splendid Housing Bubbles in America, January Update: Now Phoenix, Las Vegas, San Francisco, Seattle, San Diego Plunge Fastest

Wolf Richter


Housing Bubble 2 continues to deflate relentlessly, no matter what data set we’re looking at. Today we got the S&P CoreLogic Case-Shiller Home Price Index for “November,” which is a three-month moving average of home sales that were entered into public records in September, October, and November, reflecting deals made largely in August through October.
Prices in all of the 20 metros in the index dropped from the prior month, and all continued their slide from the peak last spring or summer.
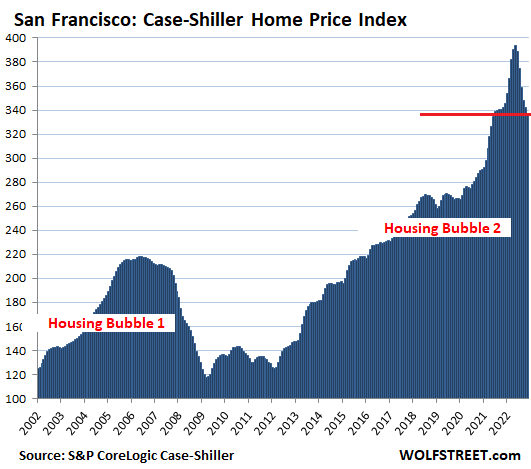
The San Francisco Bay Area is the leader here. The index for single-family houses was down 14% from the peak in May and turned negative year-over-year, having plunged faster in the six months since the peak in May than they’d spiked in the six months up through May.
The Case-Shiller Index is different from median-price indices. It uses the “sales pairs” method, comparing sales in the current month to when the same houses sold previously. The price changes are weighted based on how long ago the prior sale occurred, and adjustments are made for home improvements and other factors (methodology). This “sales pairs” method makes the Case-Shiller index a more reliable indicator than median price indices, but it lags months behind.
Median-price indices reflect the price in the middle of all homes that sold that month, and can therefore be skewed by a change in the mix of homes that are sold, which is a big issue when there is a dramatic change in the market, such as in 2022. But they’re more current.
And the median price indices have plunged a whole lot further. The median price across the US of all types of homes sold in December fell 11.3% from the peak in June, according to the National Association of Realtors, while today’s National Case-Shiller Index (three-month moving average through November), dropped only 3.6% from the peak.
In the San Francisco Bay Area, the median price plunged by 30% in December from the crazy peak in March, and was down 10% year-over-year. The Case-Shiller Index for the Bay Area today (reflecting home sales in September, October, and November) was down 14.4% from the peak, and was down 1.6% year-over-year.
On a month-to-month basis, today’s Case-Shiller Index dropped again in all 20 metros that it covers. The biggest month-to-month drops occurred in:
- Phoenix: -1.9%
- Las Vegas: -1.7%
- San Francisco: -1.6%
- Seattle: -1.5%
- San Diego: -1.4%
- Dallas: -1.1%
- Tampa: -1.0%
From their peaks, which range from May to July, house prices dropped the most in:
- San Francisco Bay Area: -14.3%
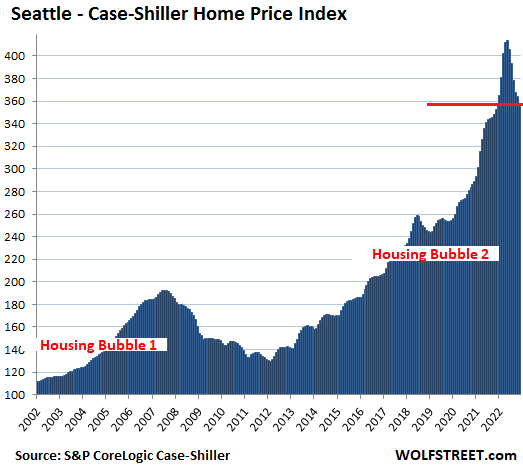
- Seattle metro: -13.5%
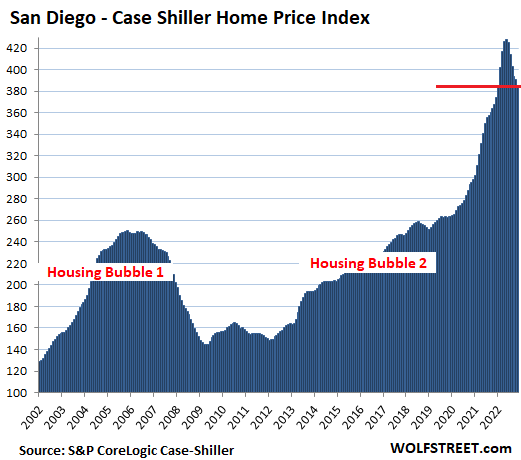
- San Diego metro: -9.9%
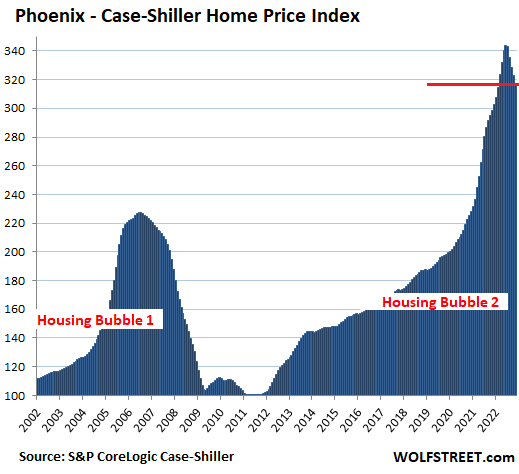
- Phoenix metro: -7.7%
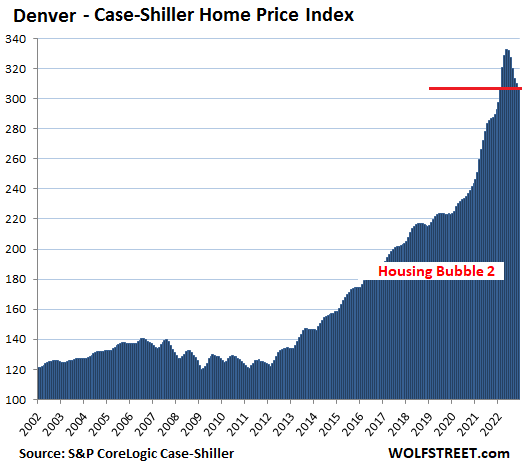
- Denver metro: -7.5%
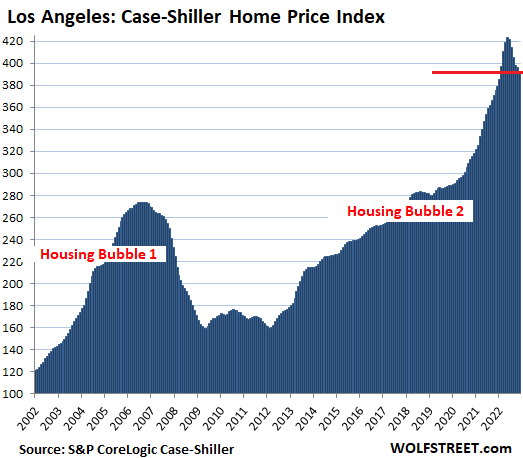
- Los Angeles metro: -7.4%
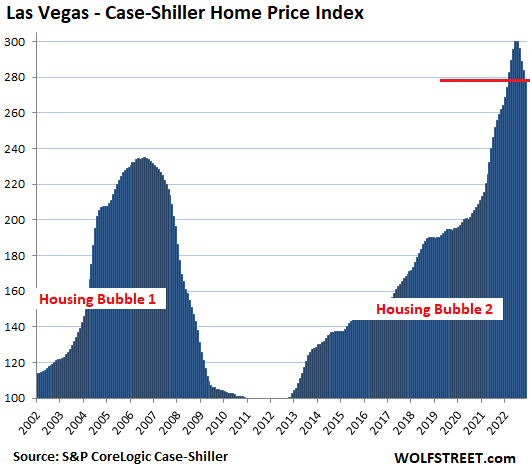
- Las Vegas metro: -7.0%.
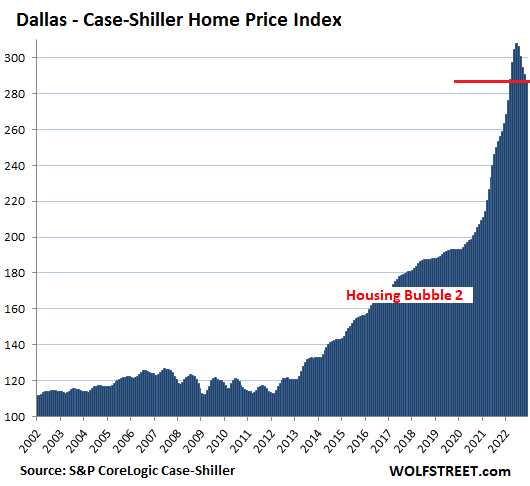
- Dallas metro: -6.6%
San Francisco Bay Area: The index for “San Francisco” covers five counties of the nine-county San Francisco Bay Area: San Francisco, part of Silicon Valley, part of the East Bay, and part of the North Bay.
- Month over month: -1.6%.
- From the peak in May: -14.4%.
- Year over year: -1.6%.
- Lowest since June 2021.
- Prices plunged faster than they’d spiked:
- Down in six months from peak in May: -56.8 points
- Up in six months to peak in May: +53.4 points.
In the Seattle metro.
- Month over month: -1.5%.
- From the peak in May: -13.5%.
- Year over year: +1.5%.
- Down in six months from peak in May: -55.9 points
- Up in six months to peak in May: +61.4 points.
San Diego metro:
- Month over month: -1.4%.
- From the peak in May: -9.9%.
- Year over year: +4.8%.
- Down in six months from peak in May: -42.5 points
- Up in six months to peak in May: +60.1 points.
Phoenix metro:
- Month over month: -1.9%.
- From the peak in June: -7.7%.
- Year over year: +6.3%
- Down in five months from peak in June: -26.4 points
- Up in five months to peak in June: +36.1 points.
Denver metro:
- Month over month: -0.8%.
- From the peak in May: -7.5%.
- Year over year: +6.1%.
- Down in six months from peak in May: -24.8 points
- Up in six months to peak in May: +42.6 points.
Los Angeles metro:
- Month over month: -0.9%.
- From the peak in May: -7.4%.
- Year over year: +4.4%.
- Down in six months from peak in May: -31.2 points
- Up in six months to peak in May: +47.8 points.
Las Vegas metro:
- Month over month: -1.7%.
- From the peak in July: -7.0%.
- Year over year: +6.6%
- Down in four months from peak in July: -21.1 points
- Up in four months to peak in July: +25.5 points.
Dallas metro:
- Month over month: -1.1%.
- From the peak in June: -6.6%.
- Year over year: +10.9%
- Down in five months from peak in June: -20.3 points
- Up in five months to peak in June: +39.4 points.
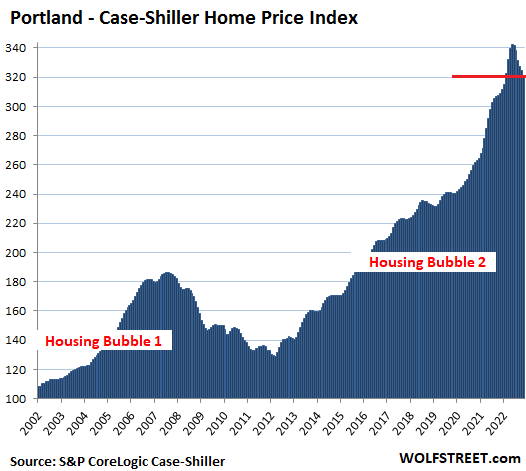
Portland metro:
- Month over month: -0.9%.
- From the peak in May: -6.1%.
- Year over year: +3.9%.
- Down in six months from peak in May: -20.9 points
- Up in six months to peak in May: +33.1 points.
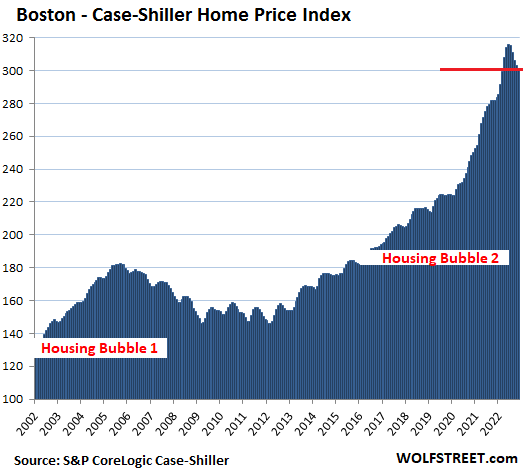
Boston metro:
- Month over month: -0.7%.
- From the peak in June: -4.6%.
- Year over year: +6.9%
- Down in five months from peak in June: -14.6 points
- Up in five months to peak in June: +30.2 points.
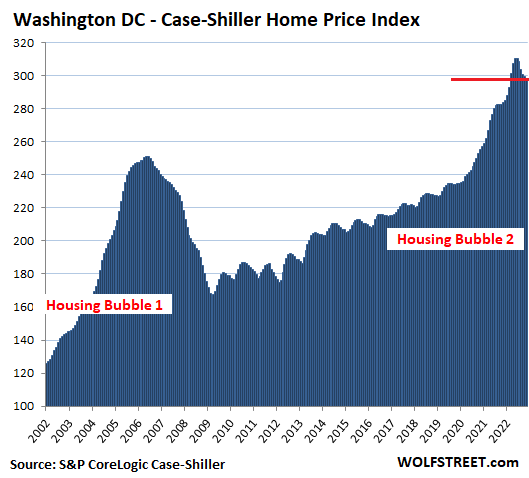
Washington D.C. metro:
- Month over month: -0.3%.
- From the peak in June: -3.9%.
- Year over year: +5.3%
- Down in five months from peak in June: -12.1 points
- Up in five months to peak in June: +22.4 points.
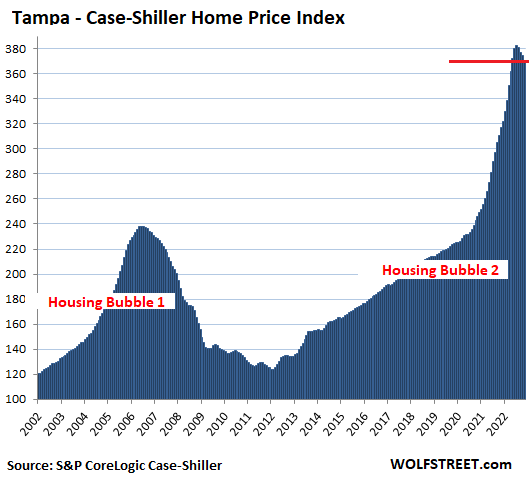
Tampa metro:
- Month over month: -1.0%.
- From peak in July: -3.1%
- Year over year: +16.9%
- Down in four months from peak in July: -11.8 points
- Up in four months to peak in July: +31.4 points.
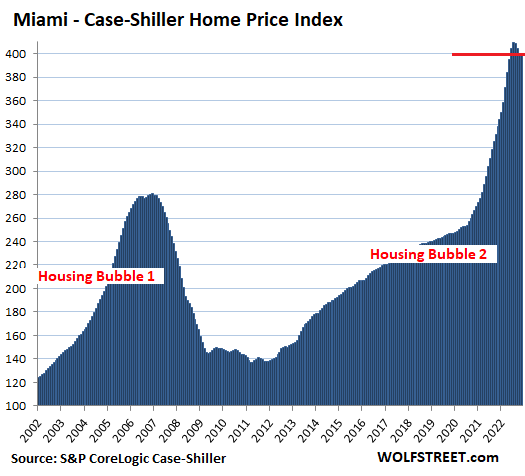
Miami metro:
- Month over month: -0.2%.
- From peak in July: -2.3%
- Year over year: +18.4%
- Down in four months from peak in July: -9.6 points
- Up in four months to peak in July: +37.8 points.
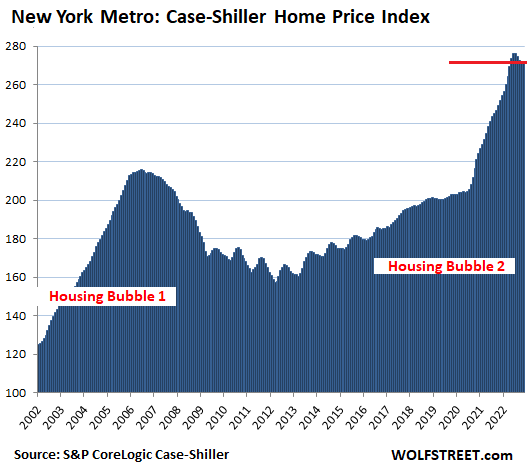
In the New York metro:
- Month over month: -0.1%.
- From peak in July: -1.6%
- Year over year: +8.1%
- Down in four months from peak in July: -4.3 points
- Up in four months to peak in July: +12.1 points.
For the Miami metro in November, the Case-Shiller Index had a value of 400 points. All Case-Shiller indices were set at 100 for the year 2000. This means that despite the recent decline, Miami house prices are up 300% since 2000. This makes it the #1 in terms of price increases since 2000 in the Case-Shiller Index.
Los Angeles and San Diego occupied at different times the #1 slot, but prices have dropped faster in them than in Miami. The index value for Los Angeles dropped to 392 and for San Diego to 385.
In the New York metro, with an index value of 272, house price inflation since 2000 amounted to 172%. This makes it the bottom end of the Most Splendid Housing Bubbles.
In the remaining six metros in the 20-City Case-Shiller Index, house price inflation since 2000 has been quite a bit less, and they don’t qualify for this lineup. Home prices have dropped in each of them for months. In the “November” index today, prices dropped further, month to month: Chicago (-0.6%), Charlotte (-0.7%), Minneapolis (-0.7%), Atlanta (-0.6), Detroit (-0.4%), and Cleveland (-0.7%).
STAY INFORMED! Receive our Weekly Recap of thought provoking articles, podcasts, and radio delivered to your inbox for FREE! Sign up here for the HoweStreet.com Weekly Recap.
Wolf Richter January 31st, 2023
Posted In: Wolf Street