


The midterm election is historically a negative for the president’s party, and this year is expected to be no different. Exit polls suggest that Republicans are poised to sweep the House and the Senate in today’s mid-term. Bulls insist that this outcome would be a positive for equity markets regardless of the macro backdrop.
Thinking people might consider how a shift in US Senate seats can ameliorate the most significant monetary contraction and real estate-led global downturn–since 2008 (chart of global house price trends below since 2001 courtesy of ISABELNET.com).

Voters cite fixing the economy as job number one, but this economic cycle is not bowing to anyone’s aspirations any time soon. Any interim rebound in still-overvalued asset prices will worsen investment prospects and increase the commitment of the US Fed to hike further for longer. #catch22 indeed.
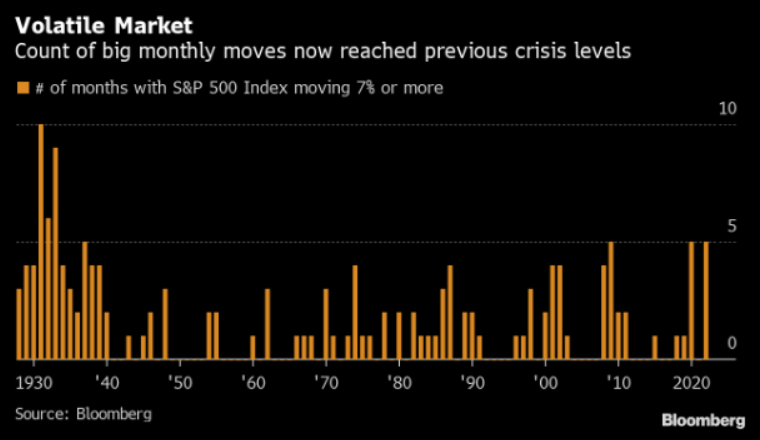
As shown below, market volatility has already been the most since 2008 and the dirty ’30s before that. After five monthly swings greater than 7%, the S&P 500 opens today -20 percent since January and has gone nowhere since June.
Losses thus far have not been enough to squash a speculative predilection among retail investors. Over the past month, retail buyers ploughed another $58 billion into equity exchange-traded funds, the most since March. While 45%% of inflows went to large, mid-cap and broad equity funds, just 7% went into US government bond funds @DataArbor. Flows into US equities outpaced all other regions significantly (chart since 2016, courtesy of ISABELNET.com).

Bullish dreams notwithstanding, the bulk of stock market losses have historically come after the US Fed has stopped tightening and then ‘pivoted’ to loosen monetary conditions once more (S&P 500 price moves shown below since the 1960s courtesy of Thomas Thornton.) No pivot yet: the US Fed says it’s determined to tighten into 2023.

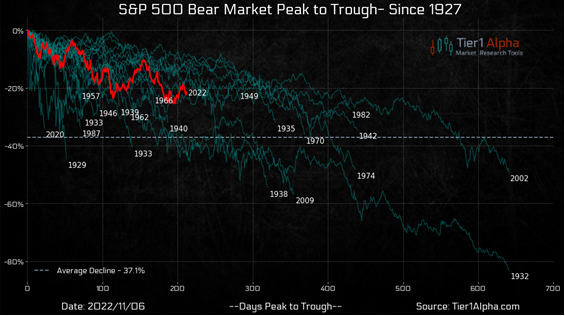
This S&P bear market (red line below courtesy of Tier 1 Alpha) has been in motion for 211 trading days. Historically, since 1927, drawdown periods that did not end within 200 trading days extended to 300 days and beyond.
On the other hand, government bond yields (below in black via The Daily Shot) typically follow the ISM prices paid index witha three-month lag (dashed line top panel) and bank credit (dashed line lower panel). Both signal lower yields over the next 18 months (higher government bond prices) as contracting liquidity lower economic output and, finally, inflation at a lag.
