ALWAYS CONSULT YOUR INVESTMENT PROFESSIONAL BEFORE MAKING ANY INVESTMENT DECISION

October 13, 2022 | Services Now Drive Inflation: Worst in 40 Years Services CPI & “Core CPI” Show Inflation Is Entrenched in Broad Economy. Some Goods Prices Fall, Gasoline Plunges

Wolf Richter


Nearly two-thirds of consumer spending goes to services. And they’re now the driver of inflation. The CPI for services spiked in September for the 13th month in a row, and by the most since 1982, and it accelerated month-to-month. Housing costs spiked, but also all kinds of other services, such as health insurance (+2.1% month-to-month and +28% year-over-year).
“Core CPI,” which excludes food and energy, was the worst since 1982. Food prices spiked again, but spiked slightly less than the prior month which had been the worst since 1979. But some relief came from a decline in prices of used vehicles and consumer electronics, and from gasoline, which plunged.
Overall inflation as measured by the year-over-year Consumer Price Index (CPI-U), released today by the Bureau of Labor Statistics, jumped by 0.4% in September from August, a sharp acceleration from the prior two months, and by 8.2% year-over-year. What held down overall CPI was the plunge in gasoline prices and the drop in used vehicle prices.
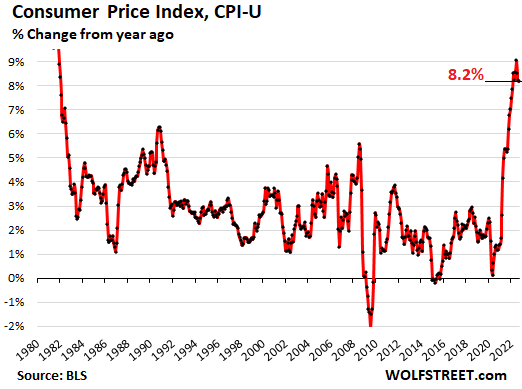
The Social Security COLA for 2023 was also determined with today’s inflation data. It is based on the average of the year-over-year increases in the Consumer Price Index for All Urban Wage Earners and Clerical Workers (CPI-W) in July, August, and September. For 2023, the COLA will be 8.7%, the highest since 1981, but in 2021 and 2022, the COLAs got crushed by raging inflation.
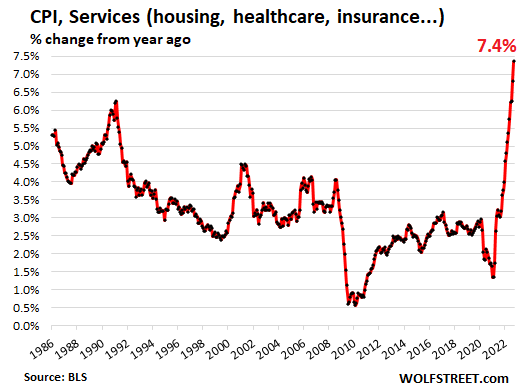
Services Inflation spiked for the 13th month.
The CPI for services spiked by 0.7% in September from August, a sharp acceleration from the prior two months; and by 7.4% year-over-year, the worst increase since August 1982. This is where nearly two-thirds of the money goes that consumer spend, and consumers are getting whacked.
I split services into two groups: categories where prices rose year-over-year and categories where prices fell year-over-year.
Service categories where CPI rose year-to-year.
In some categories, the CPI declined on a month-to-month basis but was still up year-over-year. Note the massive month-to-month increases in insurance, medical services, motor vehicle maintenance, and delivery services. More on the housing CPIs Rent and Owner’s Equivalent of rent in a moment:
| Services, where prices rose YoY | MoM | YoY |
| Health insurance | 2.1% | 28.2% |
| Rent of primary residence | 0.8% | 7.2% |
| Owner’s equivalent of rent | 0.8% | 6.7% |
| Motor vehicle insurance | 1.6% | 10.3% |
| Motor vehicle maintenance & repair | 1.9% | 11.1% |
| Medical care services | 1.0% | 6.5% |
| Delivery services | 2.9% | 16.4% |
| Pet services, including veterinary | 1.6% | 11.0% |
| Airline fares | 0.8% | 42.9% |
| Hotels & motels | -1.2% | 3.1% |
| Other personal services, such as dry-cleaning, haircuts, legal services | 0.3% | 5.9% |
| Admission to movies, theaters, concerts | -1.3% | 0.4% |
| Video and audio services, cable | -0.4% | 2.5% |
| Water, sewer, trash collection services | 0.7% | 4.9% |
Service categories where CPI fell year-over-year:
| Services where prices fell YoY | MoM | YoY |
| Telephone services | 0.0% | -0.3% |
| Car and truck rental | 2.5% | -1.4% |
| Admission to sporting events | -2.9% | -9.5% |
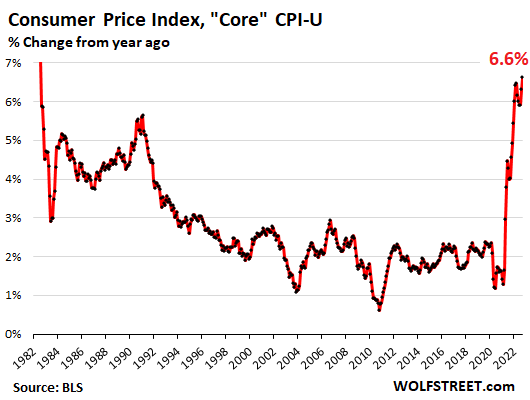
“Core” CPI.
“Core” CPI, which excludes the volatile commodities-dependent food and energy components, jumped by 0.6% in September from August, after having jumped by 0.6% in August, which had been a sharp acceleration from prior months. Year-over-year, core CPI jumped by 6.6%, the worst since August 1982.
Core CPI tracks inflation in the broader economy, beyond the commodities-based components food and energy, and it has been giving the fed the willies:
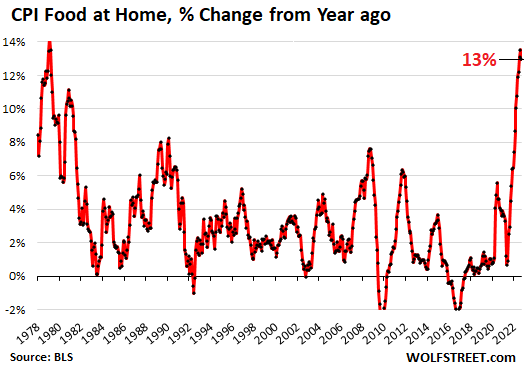
Food inflation still horrible.
The CPI for “food at home” – food bought in stores and at markets – spiked by 0.7% in September from August, same as in the prior month. Notably, some relief was to be had at the beef counter. Year-over-year, the CPI for food at home jumped by 13.0%, a tad less terrible than the 13.5% in August, which had been the worst since February 1979:
Food inflation is particularly insidious because it hits lower-income consumers the most because they spend a bigger part of their budget on food. A 13% spike in food prices wreak havoc on their efforts to put food on the table. And it’s not like they can downshift easily from expensive brands to lower priced foods, store brands, etc. because they’re already buying the lowest-priced foods they can find. The Fed is keenly aware of this and has pointed it out many times:
Beef prices started to drop a few months ago and are now down year-over-year, after the huge spike last year. But prices of pork and poultry spiked, as many consumers have shifted to them, from beef:
| Food inflation | MoM | YoY |
| Cereals and cereal products | 0.9% | 16.2% |
| Beef and veal | -0.1% | -1.1% |
| Pork | 1.8% | 6.7% |
| Poultry | 0.6% | 17.2% |
| Fish and seafood | 0.5% | 8.0% |
| Eggs | -3.5% | 30.5% |
| Dairy and related products | 0.3% | 15.9% |
| Fresh fruits | 0.7% | 8.2% |
| Fresh vegetables | 2.4% | 9.2% |
| Juices and nonalcoholic drinks | 1.2% | 12.7% |
| Coffee | 0.1% | 15.7% |
| Fats and oils | 1.9% | 21.5% |
| Baby food | 1.5% | 11.8% |
| Alcoholic beverages at home | -0.4% | 2.9% |
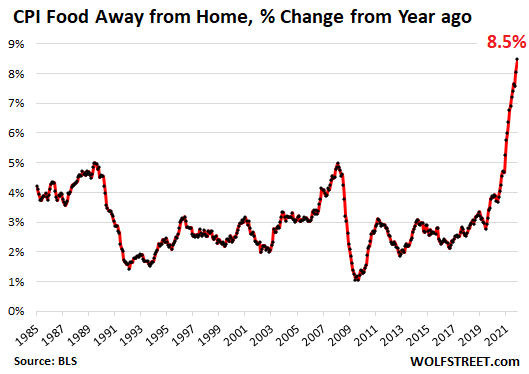
“Food away from home” CPI – at restaurants, vending machines, cafeterias, sandwich shops, etc. – jumped by 0.9% in September from August, and by 8.5% year-over-year, the worst since September 1981.
Food at employee sites and schools spiked by 44.9% in September from August and by 91.4% year-over-year, having nearly doubled!
Gasoline price plunge drives down energy inflation.
The Energy CPI dropped by 2.1% in September from August, on plunging gasoline prices. But natural gas prices spiked, and electricity prices rose.
| Energy | MoM | YoY |
| Overall Energy CPI | -2.1% | 19.8% |
| Gasoline | -4.9% | 18.2% |
| Utility natural gas to home | 2.9% | 33.1% |
| Electricity service | 0.4% | 15.5% |
| Heating oil, propane, kerosene, firewood | -2.8% | 39.9% |
Housing costs surge.
The CPI for “rent of shelter,” which accounts for 32.1% of total CPI, attempts to track housing costs as a service, not as an investment asset to be bought and sold. Its major components:
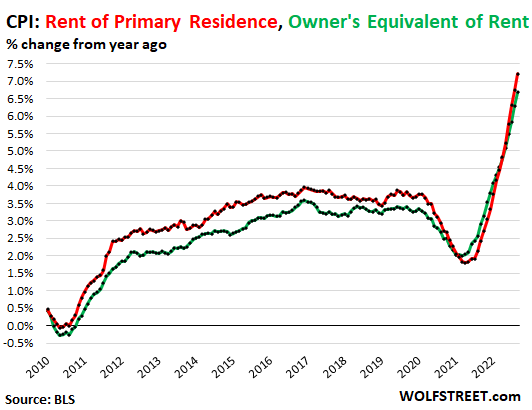
“Rent of primary residence” (accounts for 7.3% of total CPI) jumped by 0.8% in September from August, and by 7.2% year-over-year (red in the chart below). It tracks actual rents paid by a large panel of tenants, including in rent-controlled apartments.
“Owner’s equivalent rent of residences” (accounts for 23.8% of total CPI) jumped by 0.8% for the month and by 6.7% year-over-year (green line). It tracks the costs of homeownership as a service, based on what a large panel of homeowners report their home would rent for.
The “Zillow Observed Rent Index” (ZORI) tracks “asking rents”: advertised rents of apartments and houses listed for rent. Asking rents can jump when landlords feel confident, and if landlords cannot rent out their units, they will cut their asking rents. There has been a lot of volatility in asking rents as landlords tried to arbitrage the pandemic shifts, but not many people actually signed new leases at those asking rents because over a 12-month period, most tenants stay put.
In September, the ZORI rose by 0.3% from August to a record $2,084 per month. That increase of 0.3% was smaller than the increases in prior month. Year-over-year the index was up 10.8% from a year ago – which is still a huge increase.
But caution about the month-to-month changes: they’re very seasonal. Before the pandemic, the ZORI’s month-to-month changes turned negative every year in the fall. Every September, the month-to-month change in the ZORI was either 0% or -0.1%. The biggest negative readings occurred in November and December. By January, the month-to-month ZORI rose again.
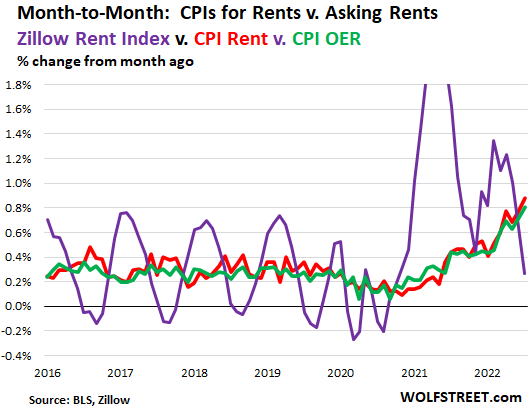
This chart shows the month-to-month changes of ZORI asking rents (purple line), some of which will feed with a delay into “rents” that tenants actually pay and report (red line) and into “owner’s equivalent rent” as estimated by homeowners (green). I discussed this lag between asking rents and actual rents, and what it means for CPI in 2023, here.
The month-to-month increases of the CPI for rent and OER have been accelerating, as some of the asking rent increases have turned into actual rent increases for tenants.
With the ZORI, what we’re seeing is in part the seasonality. But September’s 0.3% increase contrasts with the normal 0% or -0.1% change in September. In other words, asking rents are still increasing substantially faster than they did before the pandemic. And come January, the month-to-month ZORI is going to bounce again:
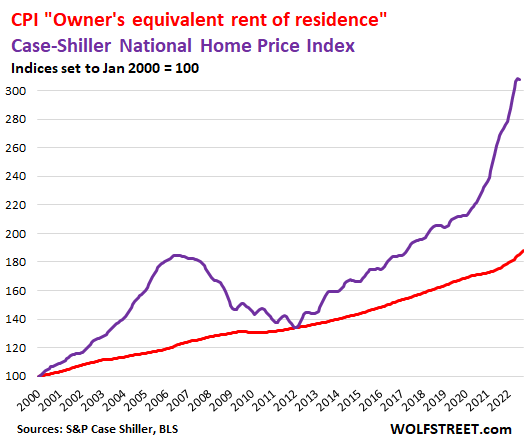
Home prices fell month-to-month for the first time in years, according to the most recent Case-Shiller Home Price Index. This reduced the year-over-year gain to 15.8% year-over-year (purple line below). The Case-Shiller index lags reality on the ground by several months, but already the steepest declines since Housing Bust 1 are cropping up in some markets, as depicted in The Most Splendid Housing Bubbles in America:
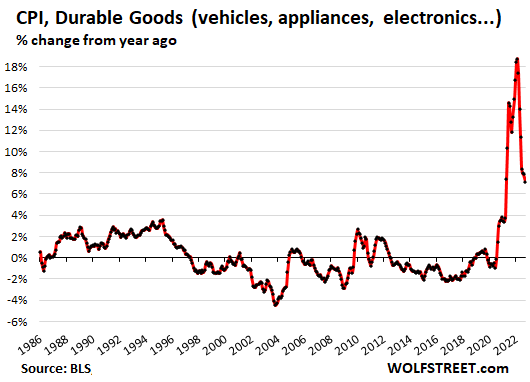
Durable goods CPI.
The CPI for durable goods finally dipped 0.1% in September. Sharp declines from the mega-spike last year have long been predicted, and we’ve seen some of that in used vehicles but not in new vehicles, the largest component in durable goods, where prices just kept surging.
For the actual dollar increases of the best-selling pickup truck and the best-selling car, have a look at the 32-year WOLF STREET Real-World New-Vehicle Price Index, F-150 XLT & Camry LE, 2023 Models, which shows a Ford truck price shocker (up 21% in two years), while Toyota barely raised the price of the Camry.
Durable goods include motor vehicles, appliances, furniture, sporting goods, consumer electronics, etc.
Consumer electronics – laptops, monitors, smartphones, WiFi systems, printers, smart speakers, etc. – almost always have a large negative CPI. This makes sense as manufacturing constantly gets more efficient, which pushes down the prices of the products. And importantly, CPI attempts to track the price changes of the same product, and if the product improved a lot, it’s no longer the same product. Consumer electronics have improved at a rapid pace, and the costs of those improvements are removed from CPI as part of the “hedonic quality adjustments.” Manufacturing efficiencies plus improvements of the products combine into a natural and sound form of “deflation” in consumer electronics.
| Durable goods | MoM | YoY |
| New vehicles | 0.7% | 9.4% |
| Used vehicles | -1.1% | 7.2% |
| Household furnishings (furniture, appliances, floor coverings, tools) | 0.6% | 9.9% |
| Sporting goods (bicycles, equipment, etc.) | 3.0% | -1.1% |
| Information technology (computers, smartphones, etc.) | -0.6% | -10.0% |
Year-over-year, the CPI for durable goods increased by 7.4%, down from the 18% range last year and early this year, but still a huge increase.
STAY INFORMED! Receive our Weekly Recap of thought provoking articles, podcasts, and radio delivered to your inbox for FREE! Sign up here for the HoweStreet.com Weekly Recap.
Wolf Richter October 13th, 2022
Posted In: Wolf Street