ALWAYS CONSULT YOUR INVESTMENT PROFESSIONAL BEFORE MAKING ANY INVESTMENT DECISION

June 12, 2022 | A Trillion Here, a Trillion There…

John Mauldin


Complaining about federal debt is a time-honored American tradition. Remember Ross Perot and his hockey-stick charts? Then there was Harry Figgie’s 1992 best-selling book, Bankruptcy 1995. It was quite a sensation at the time.
Not only did the US government not go bankrupt in 1995, but a few years later it achieved the unimaginable feat of a balanced budget. The 2001 recession, some unwise tax and especially spending choices plus a couple of wars ended that happy trend. The debt kept rising and is still doing so today.
Perot and Figgie weren’t wrong; they were early. Imposing debt on future generations is essentially a tax on future growth and prosperity. We are shifting consumption forward in time, which will mean lower consumption later. And with inflation, consumption at higher prices which means fewer goods and services per dollar spent as compared to earlier years, unless wages and income keep up with costs and inflation, which they don’t.
Pandemic-driven fiscal and monetary policies have changed the debt situation considerably, and for the worse. At some point this becomes unsustainable, and we will have a painful reckoning, which I call the Great Reset.
For the last six years, I have done occasional analyses of the debt situation. I gave you an update on the numbers back in September 2020. Today we’ll review them again, with the benefit of the Congressional Budget Office’s latest forecast.
Before we start, I recommend you reread that 2020 letter, or at least skim through it. You may want to open it in another browser tab. Below I’ll show you refreshed versions of that same data and you will want to look back at how it’s changed.
A lot has happened since then.
Predicting the Future with the CBO
The Congressional Budget Office (CBO) publishes 10-year forecasts for government spending, revenue, and debt. These are forecasts, not promises. They have all the routine limitations of not knowing the future, plus a few more. CBO has to assume current law will remain unchanged for 10 more years. Of course, we know it won’t. Congress changes tax and spending policies all the time. Some tax breaks “expire” but are routinely extended each year. This obviously screws with CBO budgeting.
CBO also has to make assumptions about future GDP, population, interest rates, inflation, health care costs, and more. Further, the agency is forbidden by law from including recessions in its economic projections. It doesn’t account for pandemics, wars, or other expensive surprises.
We should thus take CBO forecasts with many grains of salt, but they aren’t useless. They are a great starting point for further analysis. The just published Budget and Economic Outlook: 2022 to 2032 is worth studying. Go to that page and you’ll find the report plus links to source data. It is a number junkie’s dream. I happen to be one, as is my research associate Patrick Watson, so we like watching the changes.
Now, for the next few paragraphs, we are going to take a stroll down memory lane to look at some of the CBO projections I have written about in this letter. Some are not so bad but some are WAY off. As in miles and miles. I am not trying to make fun of the CBO. Its staff does their best but predicting an unknowable future basically using backward-looking data and forward-looking estimates is all but impossible. My own track record has similar howlers.
The chart below appeared in a letter I wrote in April 2019. It showed the 2018 deficit to be $779 billion. Ok, except that we added $1.362 trillion to the debt that year. That is such a difference I checked three different sources, here, here, and here. They all differ slightly but they are all in the $1.3 trillion range. Off balance budget numbers and other items obviously added to the “official” deficit.
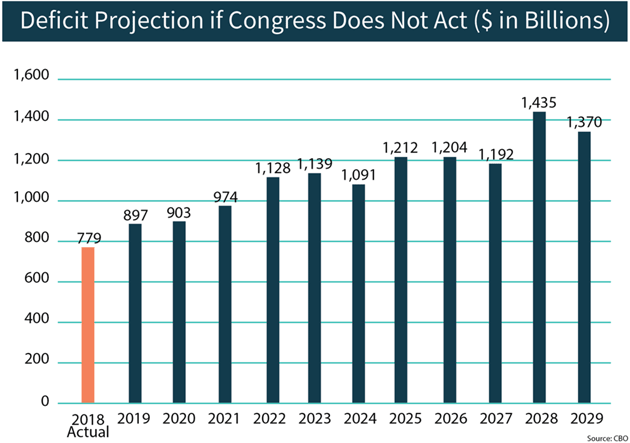
Source: US House Budget Committee Republicans
Let’s go back to April 2013 in my Assume a Perfect World letter.
“David Malpass writes Thursday in The Wall Street Journal that Obama’s 2013 budget projections make a prediction of 3.6% growth by 2016, with tax revenues up by 50%. But Obama may seem to be conservative if we look at the projections of the Congressional Budget Office.
“The next chart is from work done by Veronique de Rugy. It shows that the CBO projects that growth in 2013 will slow to 1.4% and then TRIPLE to 4.2% over the next three years! In the years 2015‒2017 they project the US to grow 4% annually on average. And that is real growth they’re foreseeing, not nominal growth.
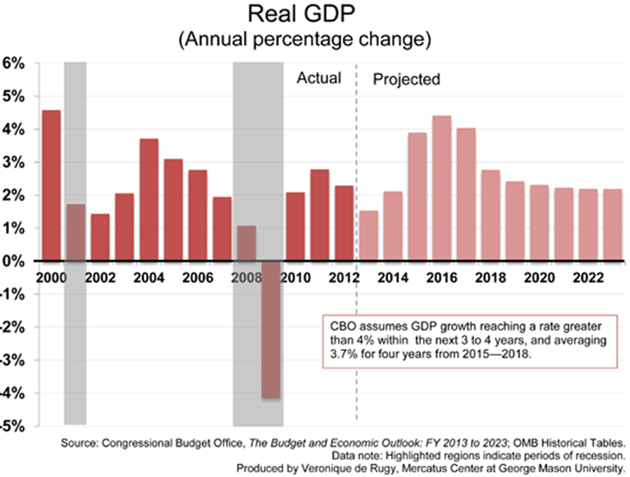
Source: Veronique de Rugy
“I read that and went straight to the latest CBO report to check. But there on page 40 and following were the actual numbers.
“The next chart is from page 41 of that 77-page report, which contains extensive details as to how they arrive at their various expense and revenue projections. I should note that they are consistent in that they do not project low interest rates during their predicted economic boom of the next several years. The Obama administration, on the other hand, assumes in their budget proposal that interest rates will be only 1.2% in 2016, to accompany their 3.6% growth (and inflation of only 2.2%). Now THAT would be a very accommodative Federal Reserve.”
[Turns out they were right about a very accommodative Fed.]
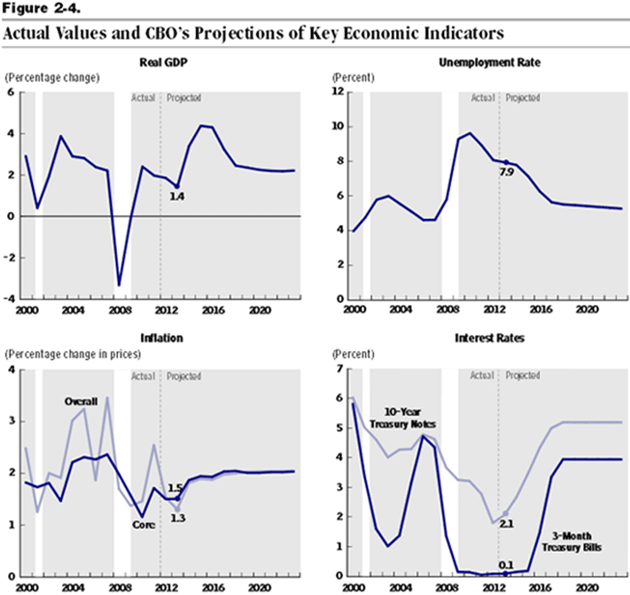
Source: CBO
CBO has actually been remarkably conservative in projecting the government’s interest costs. Actual net interest came in well below their projections the last five years. Here’s a table we pulled together from their data, comparing what CBO said in 2016 vs. what subsequently happened.
I give the CBO credit for projecting a return to normal interest rates. Note they did not expect the incredibly low unemployment rates in 2018‒2019. Again, it is extraordinarily difficult to predict the future even when you have all the CBO’s talent and the data. The economy is an extraordinarily complex, chaotic system in and of itself. Then throw in the machinations of Congress? So let’s stop looking at CBO issues and return to their current projections.
Losing Balance
Here is the latest update of a chart we’ve been producing for several years. We made this because I couldn’t find the data presented this way anywhere else.
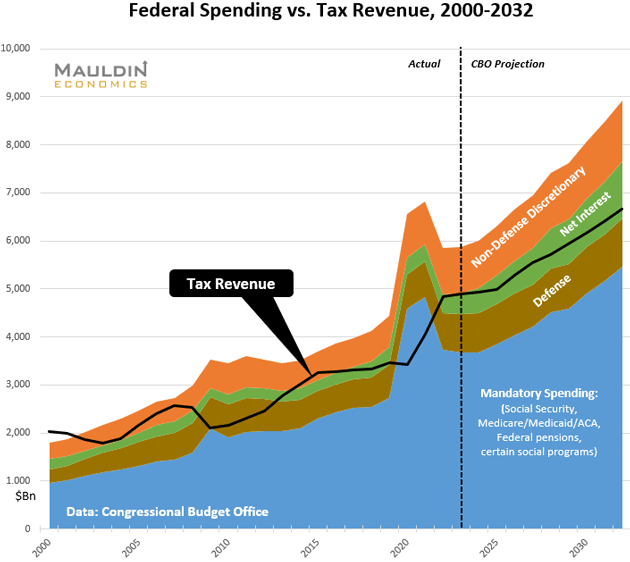
The colored areas represent spending categories. It clearly shows how so-called “mandatory spending” dwarfs everything else. These are the programs like Social Security and Medicare that don’t require annual appropriations. The law requires agencies to give defined amounts to anyone who qualifies. Then there’s defense, net interest, and “Non-Defense Discretionary,” everything else the government does.
The black line is total tax revenue, including individual and corporate income tax, payroll tax, excise taxes, import duties, and so on. You will note it doesn’t cover all the government’s spending (though it briefly did back in 2000‒2001, the “happy trend” I mentioned in my introduction). The amount above the tax revenue line is the deficit, which you will note has been widening with time. It spiked higher in 2020‒2021 due to COVID relief spending.
The interesting thing is that the CBO assumes pandemic-induced tax revenue increases will continue. Maybe they will be right. For budget purposes I sure hope so, because if they’re wrong the debt becomes an even uglier issue.
The area to the right of the dashed line is CBO’s future projection. Again, this includes a bunch of assumptions but it’s a good estimate. The latest shows government spending will approach $9 trillion by 2032. Total tax revenue that year is estimated at $6.6 trillion, leaving about a $2.3 trillion deficit. These growing deficits add up to a growing debt, which is why the green “net interest” part of the graph widens every year.
On one level, this isn’t complicated. Deficits happen when expenses exceed income. This happens in businesses and families, too, in which case you finance the deficit from savings or borrowing. You can’t do that indefinitely, so you find ways to restore balance. The government doesn’t. It simply keeps borrowing, in ever-growing amounts.
Less than Believable
Let’s dig in a little deeper, starting on the revenue side. Here’s how revenue breaks down, showing actual numbers for 2019‒2021, then estimates through 2032.
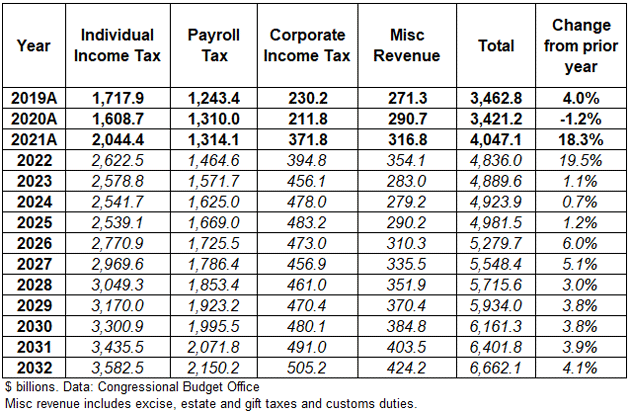
Flip back to my 2020 version of this table and you’ll see some interesting differences. At that point, 2020 revenue was estimated at $3.295 trillion. It ended about $126 billion higher than the estimate. Then 2021 brought an even bigger revenue miss: $4.047 trillion vs. $3.256 trillion estimated in 2020. CBO itself says it can’t fully explain why.
It will be interesting to see if we get the rather large increase in tax revenues for 2022 given that the GDP so far looks to be flat for the first six months. Also, the stock market is not providing a lot of capital gains opportunities. Color me in the skeptical category.
The 2020‒21 increases have some obvious reasons: higher than expected economic growth; higher wages and low unemployment boosted payroll tax collections; strong stock prices generated more capital gains. Inflation makes a difference, too. But I think it mainly shows how hard forecasting is, especially around unprecedented events like the pandemic. No one, even CBO, knew how it would develop.
(I should note, however, CBO did pretty well estimating payroll taxes. Their 2021 estimate ($1,245.8 billion), which I thought was much too aggressive, was actually too conservative. That’s one where I’m happy to have been wrong, because it means American workers earned more wages.)
The long-term projections are less believable. Remember, CBO has to assume current law stays in effect. That means these estimates assume some expiring tax cuts will actually expire, when political reality says they’ll almost certainly be extended, making revenue less than projected. Combine that with spending likely higher than CBO projects, and the result is higher deficits and an even bigger debt.
Scary Exit
Let’s plug in these numbers and see how they affect the debt outlook. This next table shows what the debt should be out to 2032, again with actual revenue and spending for 2020‒2021 and CBO’s estimates thereafter.
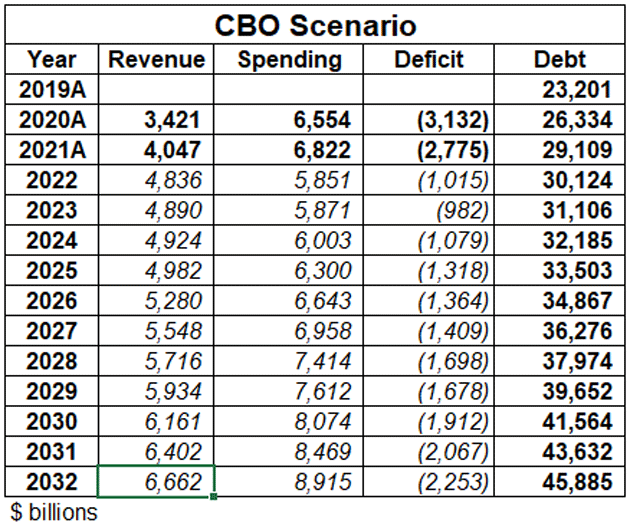
When I showed this same table in September 2020 with CBO estimates as of that time, it projected a $39.499 trillion debt in 2030. Now it’s almost $2.2 trillion higher. (Note, the 2020 estimate didn’t include the second and third COVID relief packages.) CBO now shows estimates out to 2032, at which point their numbers point to a $45.855 trillion debt. The snowballing pace would likely mean $50 trillion by 2035.
As terrible as that is, reality will likely be worse. In my 2020 letter I shared an alternate scenario I consider much more realistic. Here’s an update.
Starting with the CBO’s estimates, we make three adjustments:
- We reset tax revenue starting in 2023, given that a revenue-slashing recession is quite possible (if not likely) that year, if not starting later this year. But for our purposes we will use 2023 as a recession year. We have it fall the same percentage it did in 2008 and then recover at the same annual rates as those post-recession years.
- We add 2% to CBO’s yearly spending projections, which we think is fair and maybe even optimistic. We did that with our first such projection in 2016, and though it missed a few years here and there, the average over the last 6 years has been more than 2% a year given the recession.
- We add $269 billion per year to account for “off-budget” spending. That varies a lot but $269 billion is the average since 2000.
After those adjustments, the table looks like this.
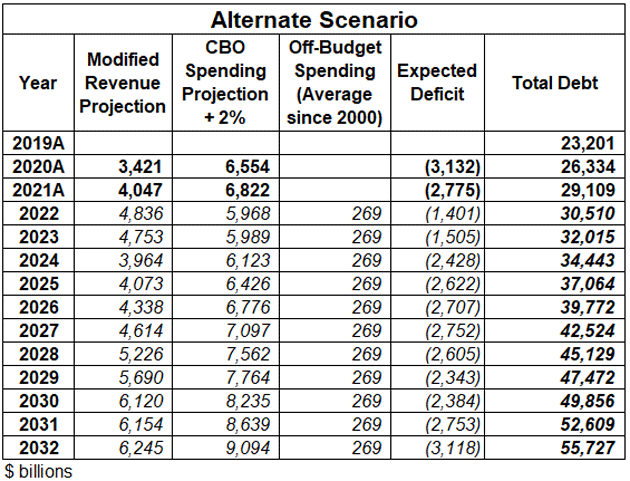
Now the 2030 debt is just slightly under $50 trillion, meaning it will have almost doubled in 10 years. And two years later it will approach $56 trillion.
For those who like their numbers in chart form, here are the CBO-implied debt totals along with our alternate scenario.
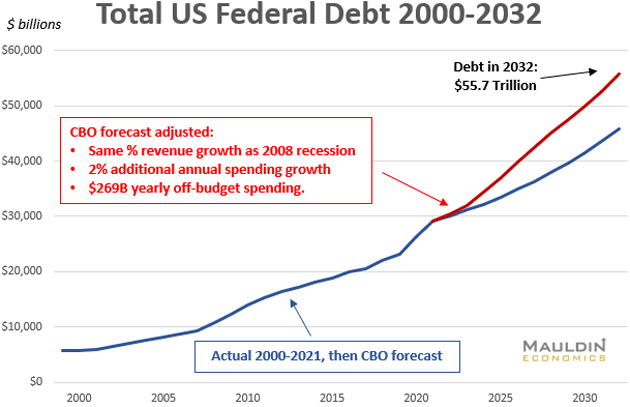
These entirely reasonable adjustments mean that a decade from now the debt will be almost $10 trillion higher than the CBO budget projections indicate. That’s not small change—but I don’t expect it to really happen. Remember, the same trends are underway in many other countries, not to mention within corporations and households. This kind of debt growth simply can’t continue, which means it won’t continue. Something will take us off this path.
Where We Go from Here
After letters like this I’m always asked, “How does this all end?” The true answer is I don’t know. At some point, that amount of debt, combined with the rest of the globe, will start creating cracks in the system. If it is any consolation to those of us living in the US, our options will be much better than they have in Europe.
A lot will depend on who is in control of Congress and the White House when those cracks lead to markets actually breaking. By that, I’m not talking about the stock market but the markets for sovereign debt. At some point, governments all over the world will have trouble raising capital at interest rates that aren’t ruinous.
Governments will have to restructure their spending and taxes in such a way as to gain the confidence of investors. I think that means balancing the budget. In the US, it is politically unthinkable that either party would support anything other than minor reductions in entitlement spending. That might include means testing for Social Security, raising the retirement age, perhaps increasing the Medicare tax on higher incomes. But those changes just tinker around on the margins, and with deficits in the $2 trillion range, don’t really do much.
The only thing that I can imagine raising the amount of revenue we need is a value-added tax or VAT. If you set the VAT high enough, you could actually have it cover Social Security and get rid of the Social Security taxes, which would be a huge boost too both wage earners and small businesses. Nearly all economists agree consumption taxes are better than income taxes.
You could actually lower income taxes on the bottom 60% of the economy significantly or even get rid of them. Larry Lindsey once wrote a whole book about how a 20% VAT could entirely fund the government. This was over a decade ago and in 2028‒30 the size of the government will be much larger so I suspect we will still need other taxes.
But the broader point is there are ways, even if painful, to get through the crisis and actually begin reducing the debt through a combination of small surpluses and nominal growth. I am under no illusion this will happen absent a major crisis of biblical proportions. But, as they say, a crisis is a terrible thing to let go to waste. Especially a major debt crisis.
The exit ramp will likely be quick, steep, and scary. I’ve been calling it a Great Reset, but that term doesn’t adequately reflect what I think is coming. Yes, good things await us on the other side. That won’t make the path from here to there any easier.
What will make it easier are the people who make the journey with you. Your family first of all, then your wider circles. I’ll be here, too, continuing to tap my best sources for information that helps you get through this period.
Speaking of which, in Thoughts from the Frontline I can only skim the surface of these topics. I share much more with Over My Shoulder members, who get research, charts, and other interesting material from us 3‒4 times a week.
Just last Tuesday, for example, we shared a research note from Charles Gave comparing today’s situation with the 1970s Ursus magnus bear market. Quoting Irving Fisher, Charles said over-indebtedness is always the root cause of great bear markets. Then he went on:
“My educated guess is that the next Ursus magnus will arise from a collapse in both European bonds and social democracies, leading to a drop in consumption of the middle class similar to the Asian Financial Crisis.”
That points to another debt problem. European governments are in no better shape than the US. And we haven’t even mentioned China. I try to keep Over My Shoulder members updated on all this. You really should join them, especially since the price is ridiculously low. Learn more here.
Family and Dallas
Tiffani and my granddaughter Lively (now 12 ½ years old) arrive late tonight to spend a few days with Shane and me. That means I will probably go to the water theme park actually inside the gates here, with the lazy river and other water park accouterments. Pretty cool. And then there’s the beach and probably Sunday night at the beach bar, watching the sunset.
As it turns out, I’m going to get on the same fight with them to Miami and it looks like they have upgraded Lively to sit next to her Papa John, which will be fun. I will then go on to Dallas and spend Tuesday with Jay Young and his team at King Operating, before flying back on Wednesday. I am learning more and more about the oil business. The more I learn and the more I think about the supply and demand side of the equation, the more interested I get. I will let you know what I learn.
As noted above, predicting the future is beyond difficult. But I feel confident in saying US government debt is going to rise a lot more than any of us will be comfortable seeing. And with the CPI data coming in hot this morning, I see the Fed hiking more than many thought just a few months ago. Powell’s new middle name may be Volcker by the end of 2023.
And with that, it’s time to hit the send button. My inbox is screaming at me and I have meetings seemingly stacked on top of each other. But it’s fun and it keeps me out of trouble. Have a great week and don’t forget to follow me on Twitter.
Your worried about debt, inflation, and interest rates analyst,
John Mauldin
STAY INFORMED! Receive our Weekly Recap of thought provoking articles, podcasts, and radio delivered to your inbox for FREE! Sign up here for the HoweStreet.com Weekly Recap.
John Mauldin June 12th, 2022
Posted In: Thoughts from the Front Line
Next: Robbing Russians = You Are Next? »