ALWAYS CONSULT YOUR INVESTMENT PROFESSIONAL BEFORE MAKING ANY INVESTMENT DECISION

December 26, 2023 | The Most Splendid Housing Bubbles in America, December 2023 Update

Wolf Richter


Today’s S&P CoreLogic Case-Shiller Home Price Index for “October” is a three-month moving average of home prices whose sales were entered into public records in August, September, and October. That’s the time frame here. It uses the “sales-pairs method,” comparing the sales price of the same house over time, thereby eliminating the issues associated with median prices and average prices (see “Methodology” toward the end of the article). But it lags.
The story here is about the individual metros of the 20 metros covered by the S&P CoreLogic Case-Shiller Home Price Index where home prices soared to ridiculous levels, multiplying by factors of three and four since 2000.
The “most splendid Housing bubbles,” we started calling them since about 2017 to track their astounding surge – and what their fate is now.
Nine of the 20 metros in the Case-Shiller Index were below their peaks in mid-2022. Nine metros had month-to-month declines (Seattle, Denver, Tampa, Washington DC, Portland, San Francisco, San Diego, Dallas, Minneapolis). And 8 of the 20 metros set new highs.
Prices below their 2022 peaks in 9 of the 20 metros in the Case-Shiller index (% from their respective peak, Case-Shiller month of peak):
- San Francisco Bay Area: -11.7% (May 2022)
- Seattle: -10.9% (May 2022)
- Portland: -5.8% (May 2022)
- Las Vegas: -5.3% (July 2022)
- Denver: -5.2% (May 2022)
- Phoenix: -5.1% (June 2022)
- Dallas: -4.4% (June 2022)
- San Diego: -2.1% (May 2022)
- Los Angeles: -0.8% (May 2022)
Prices set new highs in 8 of the 20 metros in the index (% year-over-year):
- New York metro: +7.1%
- Detroit: +8.1%
- Chicago: +6.9%
- Boston: +6.6%
- Miami: +6.7%
- Cleveland: +6.4%
- Charlotte: +6.0%
- Atlanta: +5.3%
The most splendid housing bubbles by metro.
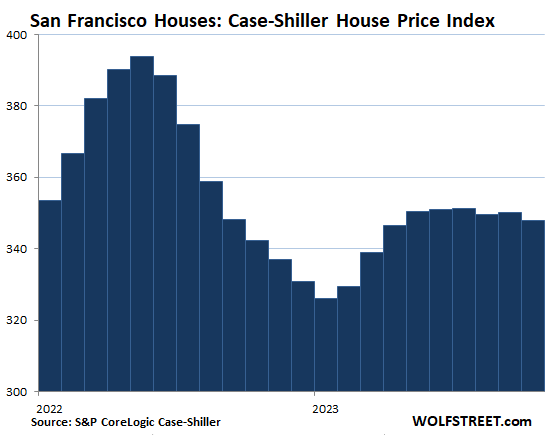
San Francisco Bay Area:
- Month to month: -0.6%
- Year over year: +1.6%
- From the peak in May 2022: -11.7%.
The closeup of San Francisco:
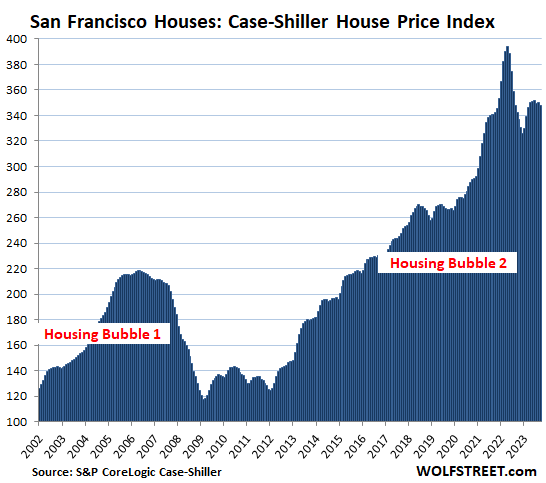
And here is the long view:
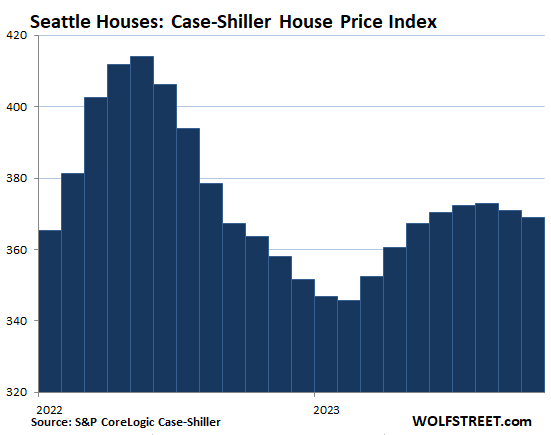
Seattle metro:
- Month to month: -0.5%.
- Year over year: +1.5%.
- From the peak in May 2022: -10.9%.
The closeup of Seattle:
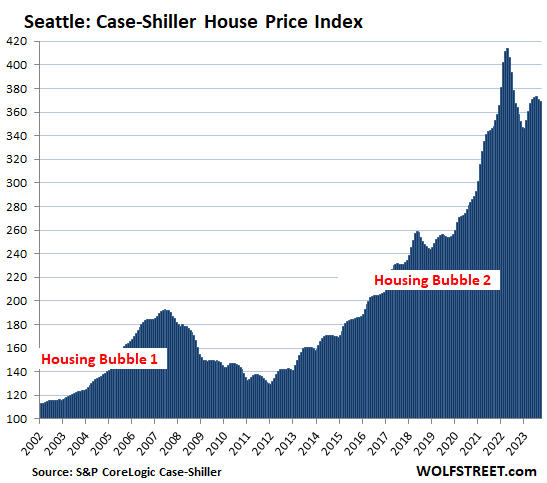
And the long view:
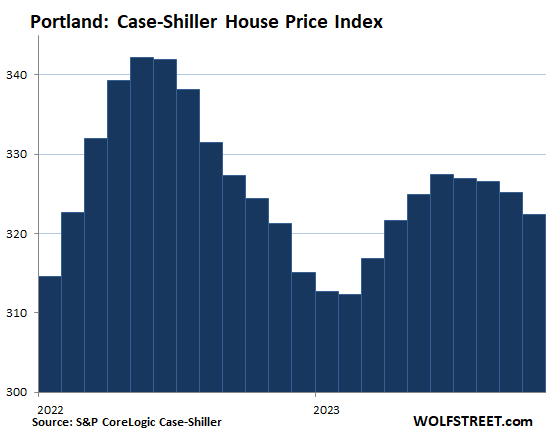
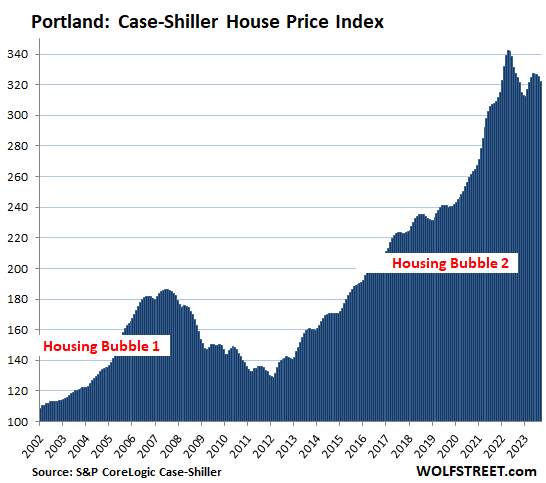
Portland metro:
- Month to month: -0.9%.
- Year over year: -0.6%.
- From the peak in May 2022: -5.8%.
The closeup of Portland:
And the long view:
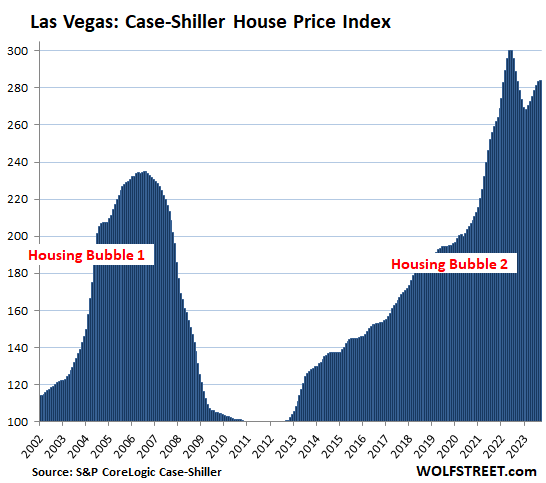
Las Vegas metro:
- Month to month: +0.3%.
- Year over year: +0.1%.
- From the peak in July 2022: -5.3%.
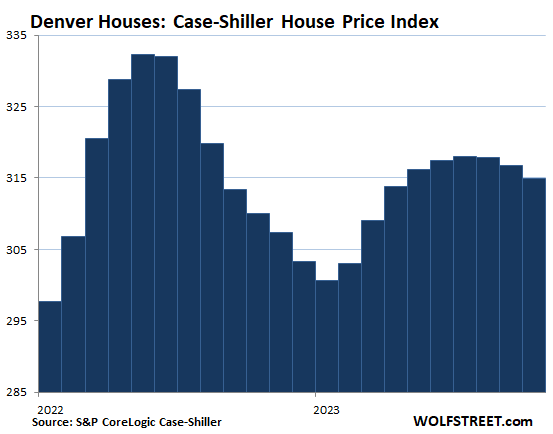
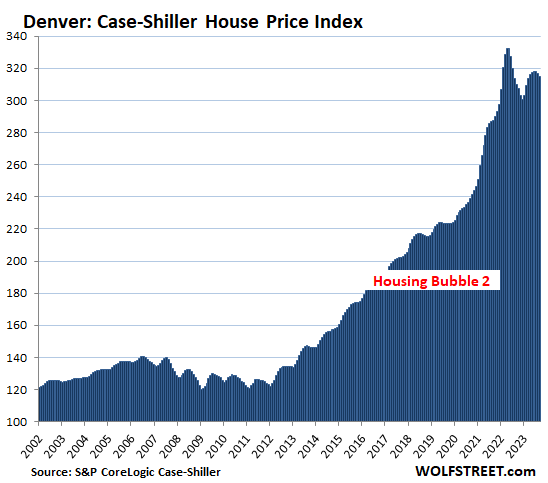
Denver metro:
- Month to month: -0.6%.
- Year over year: +1.6%.
- From the peak in May 2022: -5.2%.
The closeup of Denver:
And the long view:
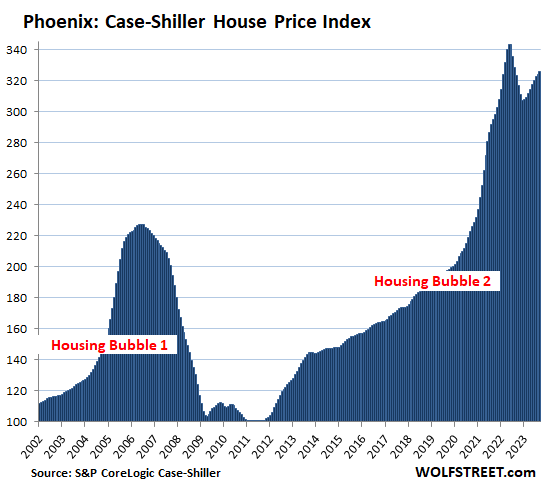
Phoenix metro:
- Month to month: +0.6%.
- Year over year: +0.9%.
- From the peak in June 2022: -5.1%.
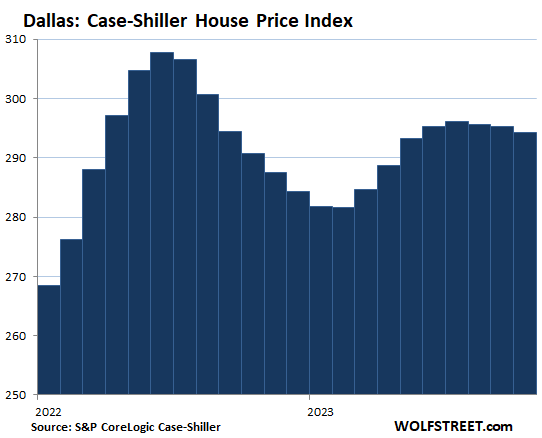
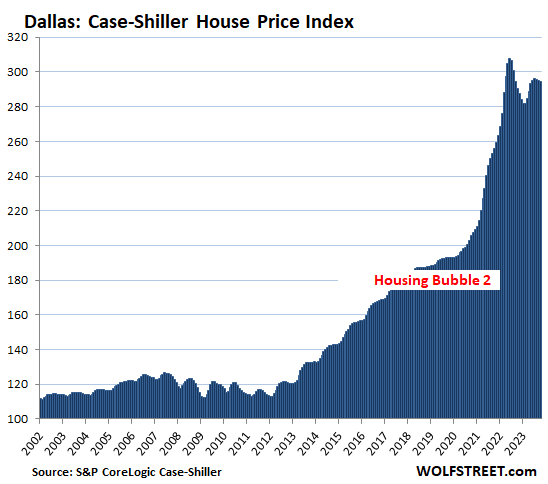
Dallas metro:
- Month to month: -0.3%.
- Year over year: +1.2%.
- From the peak in June 2022: -4.4%.
The closeup of Dallas:
The long view:
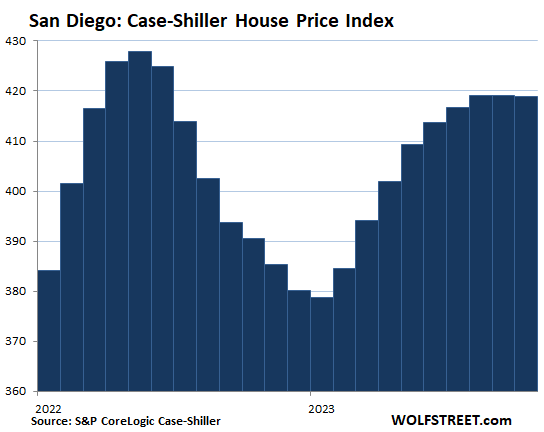
San Diego metro:
- Month to month: 0.1%.
- Year over year: +7.2%.
- From the peak in May 2022: -2.1%.
The closeup of San Diego:
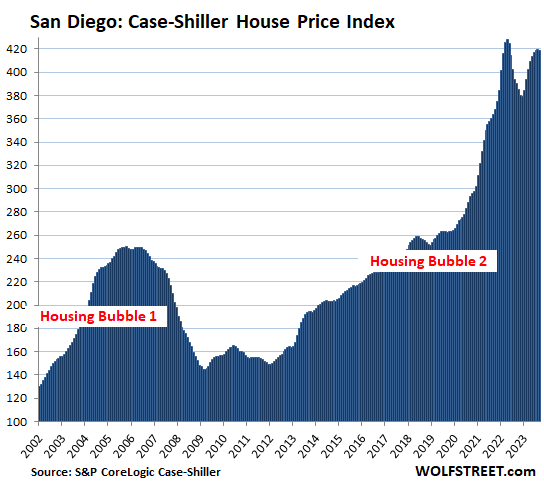
The long view:
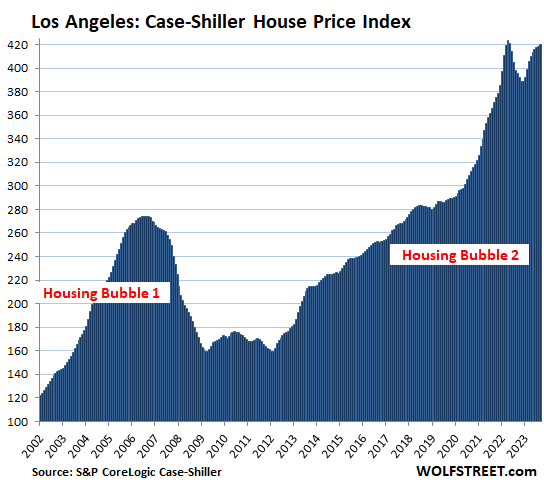
Los Angeles metro
- Month to month: +0.4%.
- Year over year: +6.1%.
- From the peak in May 2022: -0.8%.
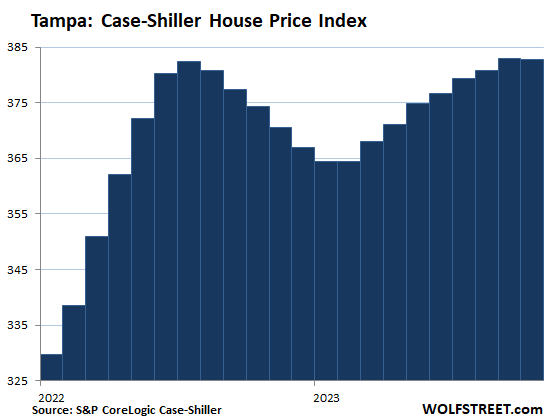
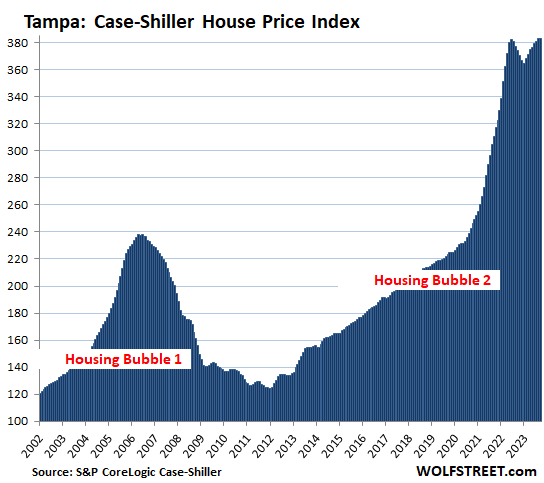
Tampa metro:
- Month to month: -0.02%.
- Year over year: +2.3%.
- October and September were just a hair above the previous high of July 2022.
Here is the closeup:
And the long view:
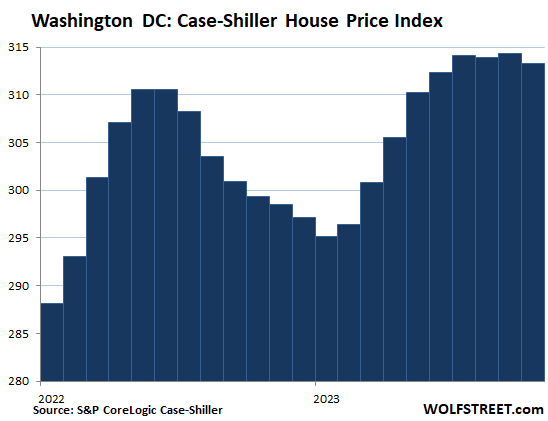
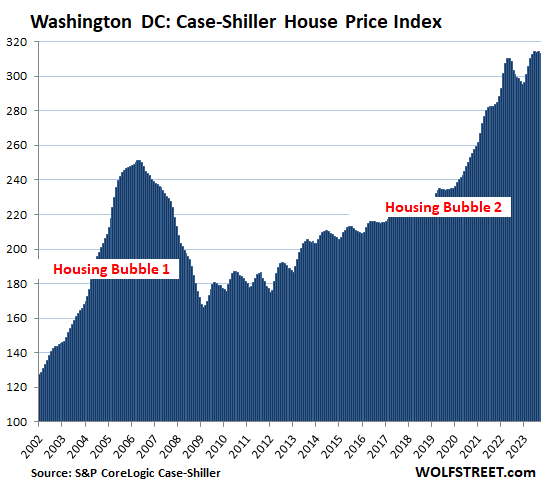
Washington D.C. metro:
- Month to month: -0.3%.
- Year over year: +4.7%.
- The prior month had been a new high.
Closeup of Washington DC:
Long view:
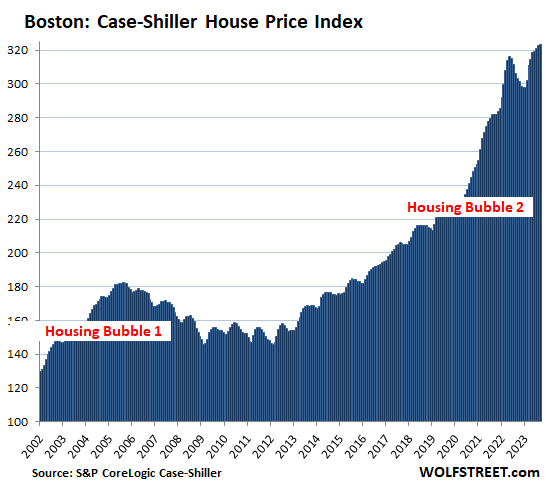
Boston metro:
- Month to month: +0.3%.
- Year over year: +6.6%.
- Set new high.
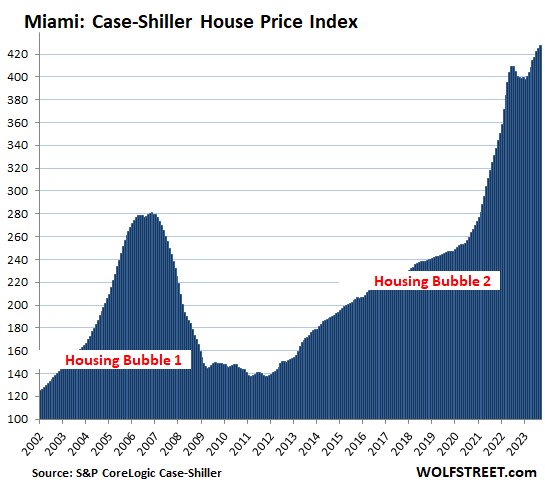
Miami metro:
- Month to month: +0.6%
- Year over year: +6.7%.
- Set new high.
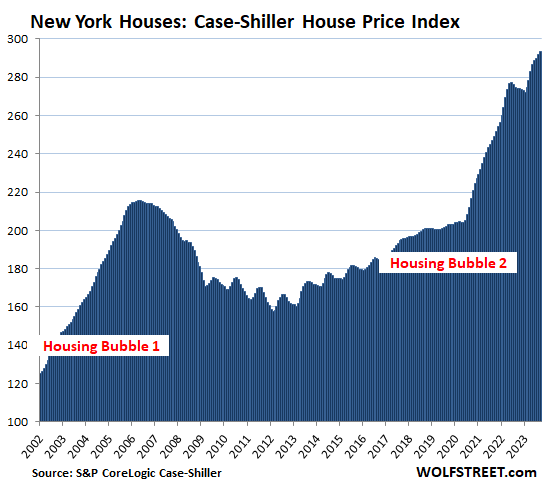
New York metro:
- Month to month: +0.5%.
- Year over year: +7.1%.
- Set new high.
To be included in this list of the Most Splendid Housing Bubbles, the metro must have experienced a home price inflation since 2000 of at least 180%. The indices were set at 100 for the year 2000. So today’s index values of 427 for Miami, 420 for Los Angeles, and 419 for San Diego are up respectively by 327%, 320%, and 319% since 2000.
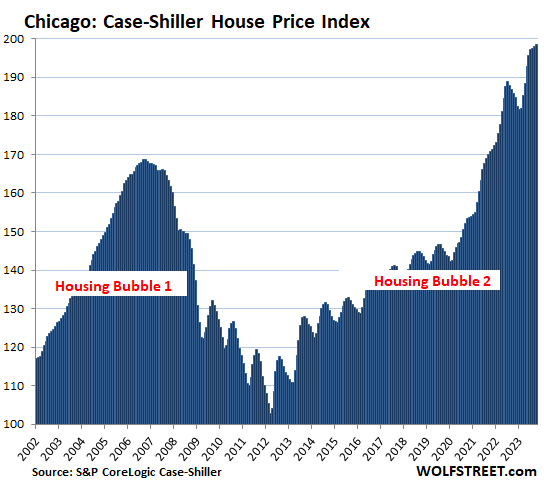
The remaining 6 of the 20 metros in the Case-Shiller index (Chicago, Charlotte, Minneapolis, Atlanta, Detroit, and Cleveland) had far less home price inflation than 180% since 2000, and don’t qualify for this list of the Most Splendid Housing Bubbles. But in 2022 and 2023, these metros had big home price increases in percentage terms, and the month-to-month increases continued in October, except for Minneapolis, where the index has now fallen for the third month in a row.
Chicago, with an index value of 198 is up by “only” 98% from 2000, and is therefore among the six Case-Shiller metros that don’t qualify for this list. But it saw a massive surge since May 2020 – thank you, halleluiah Fed money-printing – so here it is anyway:
- Month to month: +0.2%
- Year over year: +6.9%.
- Set new high.
Methodology. The Case-Shiller Index uses the “sales pairs” method, comparing sales in the current month to when the same houses sold previously. The price changes are weighted based on how long ago the prior sale occurred, and adjustments are made for home improvements and other factors. This “sales pairs” method makes the Case-Shiller index a more reliable indicator than median price indices (37-page methodology).
Home-Price Inflation. By measuring how many dollars it takes to buy the same house over time, the Case-Shiller index is a measure of home price inflation. So Miami, for example, had 327% home price inflation since 2000. To be included in the “Most Splendid Housing Bubbles,” metros had to have home price inflation of at least 180% since 2000. By comparison, the Consumer-Price Index (CPI), which tracks price changes of goods and services that are consumed by consumers, was 82% over the same period (my discussion: Beneath the Skin of CPI Inflation, November).
STAY INFORMED! Receive our Weekly Recap of thought provoking articles, podcasts, and radio delivered to your inbox for FREE! Sign up here for the HoweStreet.com Weekly Recap.
Wolf Richter December 26th, 2023
Posted In: Wolf Street