ALWAYS CONSULT YOUR INVESTMENT PROFESSIONAL BEFORE MAKING ANY INVESTMENT DECISION

May 26, 2023 | Fed’s Favored Core PCE Price Index Re-Accelerates, Driven by Services, Motor Vehicles: Inflation Stuck on High, Shifts from Item to Item

Wolf Richter


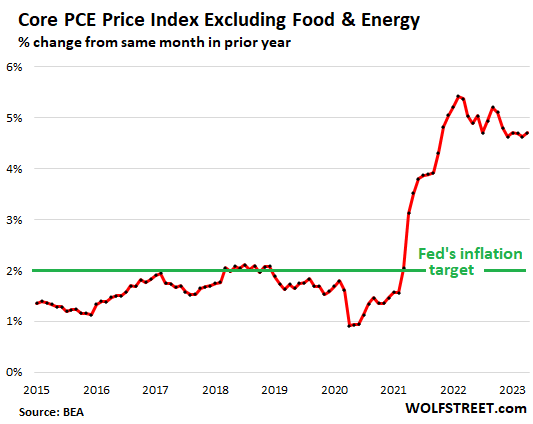
The inflation index favored by the Fed, the core PCE price index – which, by excluding the food and energy products, is a measure of underlying inflation – re-accelerated in April, as services inflation re-accelerated back into the red-hot zone, and as durable goods prices rose, after falling for months, driven by a jump in motor vehicles and parts.
Inflation is just churning from one product category to another, falling here but popping up again over there like the arcade game of Whack A Mole. And so the core PCE price index continues to be stuck near the 5% level, when the Fed’s target is 2%. And the Fed uses this core PCE index as yardstick.
On a year-over-year basis, the core PCE price index jumped by 4.7%, same as in July 2022, and up from a 4.6% increase in March, according to data from the Bureau of Economic Analysis today. It has now gone sideways at just under 5% for nearly a year, and is not coming down, but is only shifting from category to category.
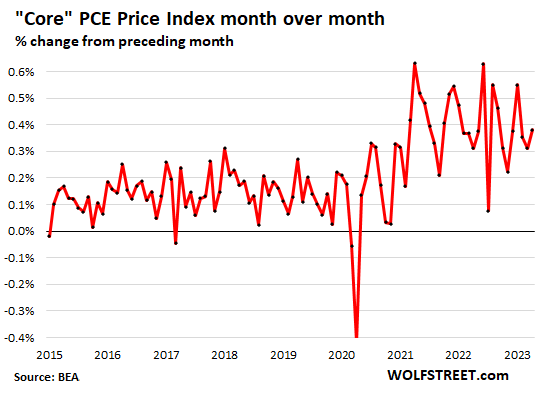
On a month-to-month basis, the core PCE price index has jumped up and down since 2021 around the 0.4% line (annualized just under 5%). In April, it rose 0.4%. This is just not encouraging:
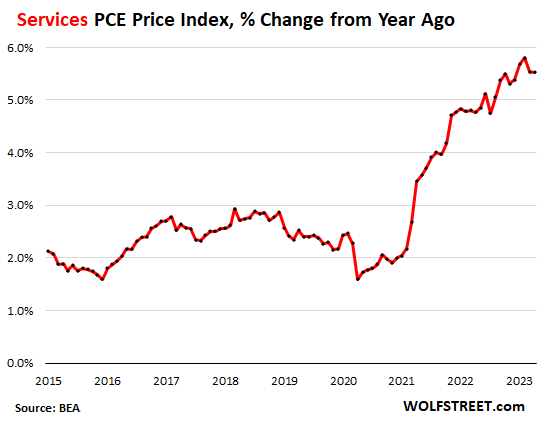
Inflation in services re-accelerated in April from March, driven by spikes insurance and financial services, and “other” services such as personal services, and big increases in healthcare and housing costs.
Inflation is particularly difficult to wring out of services, but services is where the majority of consumer spending ends up: healthcare, housing, utilities, education, travel, entertainment, restaurant meals, streaming, subscriptions, broadband, cellphone services, etc.
Year-over-year, the PCE price index for services jumped by 5.5% in April, same as in March. February, at 5.8%, had been the worst since 1984:
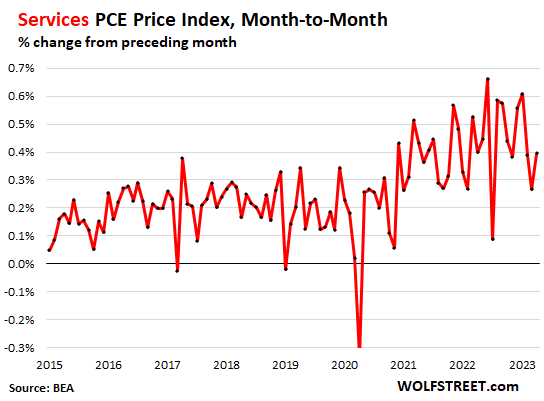
On a month-to-month basis, the PCE price index for services re-accelerated to an increase of 0.4% in April from March. Healthcare jumped by 0.5%, insurance and financial services spiked by 1.2%, other services, including personal services, spiked by 0.9%. But transportation services fell by 0.8%, and food services (such as restaurants) and accommodation were roughly flat, after spiking in March, inflation Whack A Mole.
The PCE price index for durable goods – new and used vehicles, appliances, furniture, etc. – turned positive in April (+0.2%) from March, after being negative on a month-to-month basis for five of the past six months.
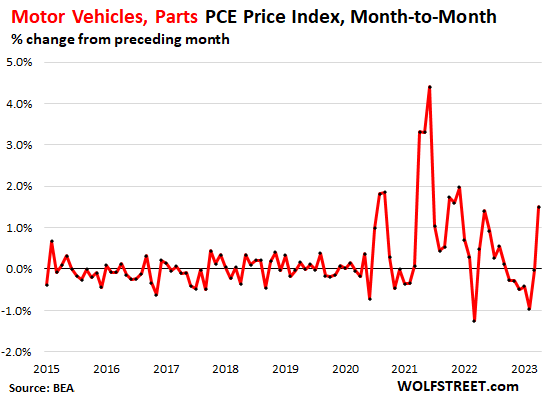
The turnaround was engineered by a month-to-month spike in motor vehicles. Six weeks ago, we predicted that this would be coming, based on underlying price data in the auto market that were already performing a U-Turn.
On a month-to-month basis, the index for motor vehicles spiked by 1.5%, after having been negative for the prior six months:
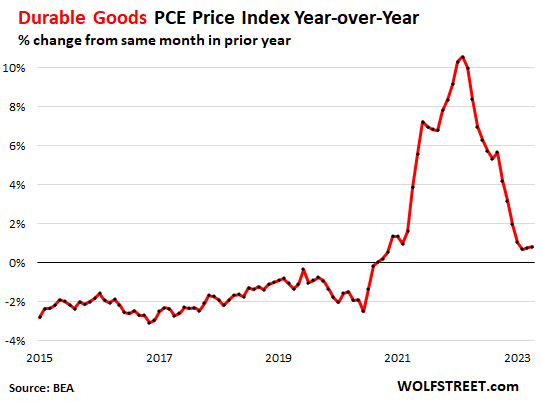
The PCE price index for durable goods, on a year-over-year basis, rose by 0.8% in April, same as in March.
In normal times, this index is negative, as efficiencies in manufacturing and transportation, forced by competition, drive down prices for the same product over time. In most cases, improvements to the product – compare a cellphone 20 years ago to a smartphone today – allow producers to charge the same or a higher price. The costs of these improvements are removed from the calculations of the index (hedonic quality adjustments).
Just by not being negative, as in normal times, the durable goods index contributes to the higher inflation readings:
The PCE price index for gasoline and other energy goods spiked by 2.4% in April from March, after having plunged in March (-4.6%). This stuff is volatile, which is why it’s removed from the “core” indices. Year-over-year the index was still down 13.5%.
The PCE price index for food was roughly unchanged in April compared to March, after having dipped by 0.2% in March from February, which pushed down the year-over-year increase to 6.9%, the least bad increase since January 2022.
The PCE price index for clothing and footwear rose by 0.4% for the month, and by 3.1% year-over-year.
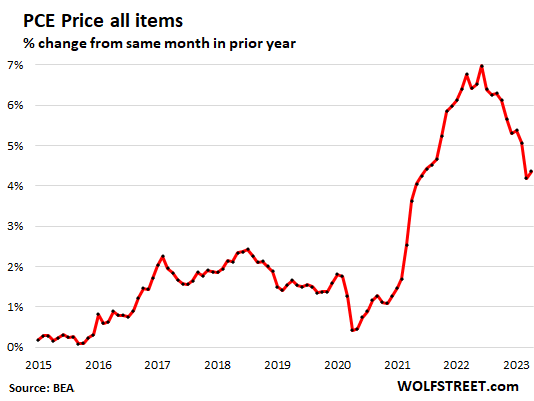
The overall PCE price index re-accelerated to an increase of 4.4% in April compared to a year ago, from an increase of 4.2% in March, pushed down by the year-over-year plunge in energy prices.
The fact that the overall PCE price index is lower than the core PCE price index is the result of energy prices that plunged in prior months, but that have now stopped plunging.
STAY INFORMED! Receive our Weekly Recap of thought provoking articles, podcasts, and radio delivered to your inbox for FREE! Sign up here for the HoweStreet.com Weekly Recap.
Wolf Richter May 26th, 2023
Posted In: Wolf Street
Next: This Week in Money »