Howestreet.com - the source for market opinions

ALWAYS CONSULT YOUR INVESTMENT PROFESSIONAL BEFORE MAKING ANY INVESTMENT DECISION

January 14, 2022 | Melting Under The Surface

Danielle Park

Portfolio Manager and President of Venable Park Investment Counsel (www.venablepark.com) Ms Park is a financial analyst, attorney, finance author and regular guest on North American media. She is also the author of the best-selling myth-busting book "Juggling Dynamite: An insider's wisdom on money management, markets and wealth that lasts," and a popular daily financial blog: www.jugglingdynamite.com

The widely followed Nasdaq index remains just 6% below its November all-time high, but 38% of its member stocks are down by at least half. This week, the negative divergence has continued with nearly two declining shares for every advancing one.

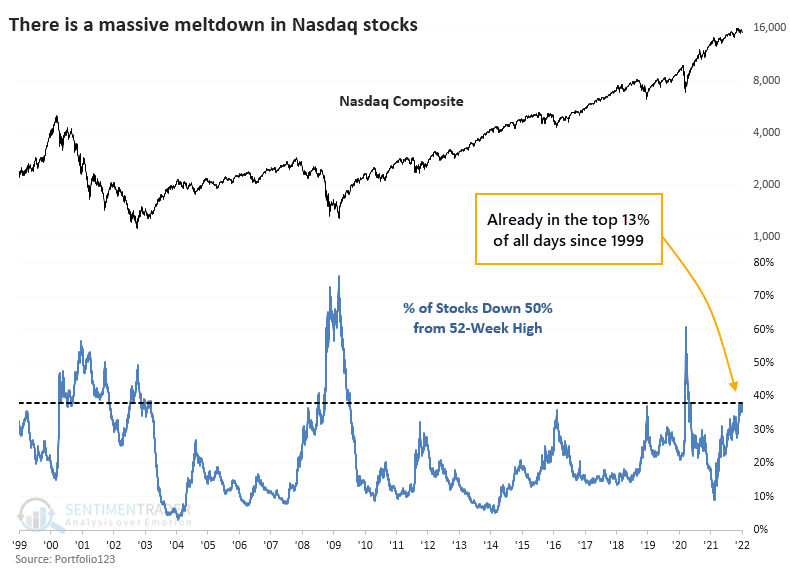
As shown on the left courtesy of Sentiment Trader,  at no other time have so many constituent stocks been cut in half while the Nasdaq Composite remained so close to its peak. In the past, when at least 35% of stocks were down by half, the Composite had already fallen an average of 47%.

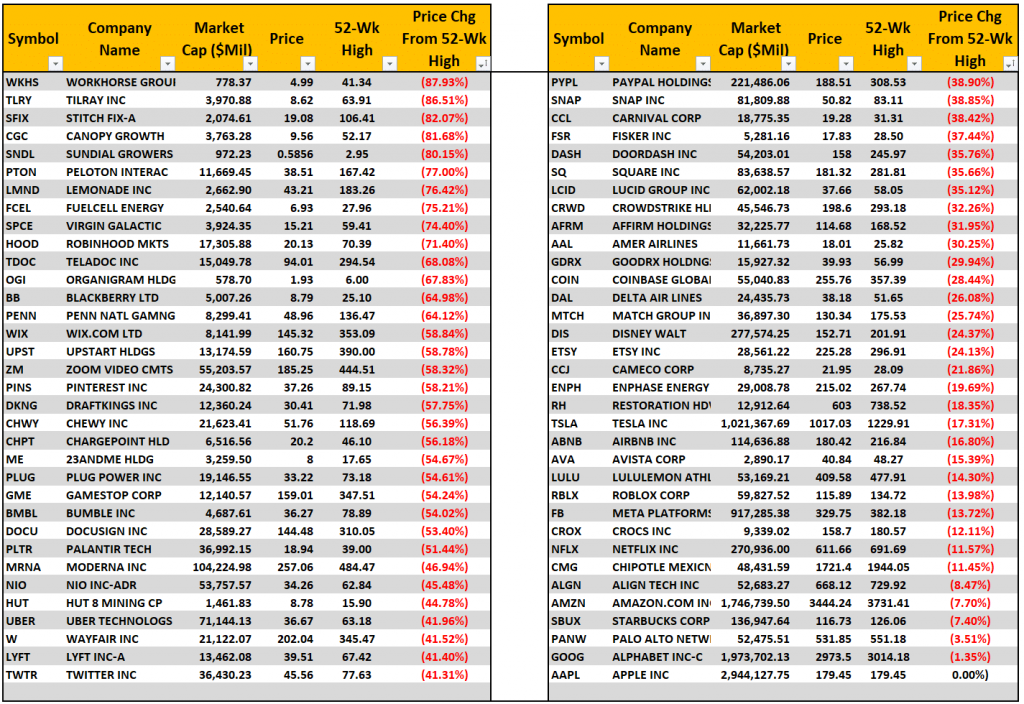
The table below from Lance Roberts in “Passive ETFs” are hiding the bear market, shows some of the individual declines to date. At the same time, the economically sensitive small-cap stock index (Russell 2000) has fallen more than 10% since November and is flat since last January.


The large-cap market resilience is now more vulnerable than in the tech top of 2000. At the height of the 2000 cycle, the five most expensive and widely held stocks–Microsoft, Cisco, Exxon Mobil, GE, and Intel–comprised 18% of the NASDAQ market capitalization. Today, the five most expensive companies (Apple, Microsoft, Amazon, Meta and Tesla) represent an unprecedented 37.8% concentration in the index.

Similar concentration risks threaten the S&P 500 with 50% of the index gains since April coming from these same five companies which, along with Nvidia, Berkshire Hathaway and JP Morgan, now account for 30% of the S&P market cap–the most concentrated since the Nifty Fifty bubble in 1969.

The horror here is that capital continues to flow into funds, ETFs, and portfolios that track large-cap indices because they appear to be ‘outperforming’, which drives even more price-indiscriminate buying of the same over-bought, overvalued names. With participants so loaded on the same positions, the liquidity needed to exit them is much lower than widely appreciated. Herein lies the seeds of panic and investment opportunity to come.

STAY INFORMED! Receive our Weekly Recap of thought provoking articles, podcasts, and radio delivered to your inbox for FREE! Sign up here for the HoweStreet.com Weekly Recap.

January 14th, 2022

Posted In: Juggling Dynamite

Post a Comment:

Your email address will not be published. Required fields are marked *

All Comments are moderated before appearing on the site

*
*

This site uses Akismet to reduce spam. Learn how your comment data is processed.