ALWAYS CONSULT YOUR INVESTMENT PROFESSIONAL BEFORE MAKING ANY INVESTMENT DECISION

November 21, 2021 | Shortages Are Relative

John Mauldin


n some simplistic economic theories, shortages never happen. Supply and demand for any particular good are always perfectly balanced in a given time and place. If you can’t get what you demand at that moment, you pay a higher price or you demand something else.
But that’s theory. The real world doesn’t respond instantly, so we have these frustrating periods when producers have more widgets than they can give away, or consumers can’t get the widgets they need at any price. And in an increasingly specialized world, substitution is no longer as easy as it once was. That car you want needs a specific microchip or it’s worthless. No other chip will work. Hence the present shortages, higher prices, and growing inflation.
Nevertheless, there’s no widget shortage if no one wants widgets. Shortages appear when demand for a good rises faster than suppliers are able and/or willing to produce it. They recede when demand falls faster than supply. Shortages exist only relative to demand.
This is important to understanding why inflation is up and ports are so clogged. Is it because we are demanding more, or because our trading partners are supplying less? Remember the relative change is what matters. Higher supply won’t stop prices from rising if supply still lags demand.
Obviously, this varies for different products. Generally, though, I think the data shows demand growth is the bigger factor. Today we’ll look at some recent analysis and try to see how all these moving parts fit together. It matters to the inflation outlook… which affects everything.
Demand Shock
Ray Dalio and his researchers at Bridgewater have spent the last couple of years talking about “MP3.” No, not the music file format, but the third-generation monetary policy that now prevails worldwide. MP3’s key feature is closely coordinated monetary and fiscal policy.
Lacy Hunt has long noted how rising debt makes conventional monetary policy tools less effective. That’s why central bankers resorted to quantitative easing after the Great Financial Crisis, and assorted other new strategies in the years since. None of it worked very well.
When COVID came along they made another giant leap. The Federal Reserve and others essentially financed or subsidized vastly expanded government stimulus programs—unemployment insurance, healthcare benefits, and other safety-net spending.
In a recent report, Bridgewater analysts adeptly connected MP3 with our supply chain crisis. They believe it isn’t a supply problem at all, but an MP3-driven upward demand shock. Quoting their report…
“The mechanics of combined monetary and fiscal stimulus are inherently inflationary: MP3 creates demand without creating any supply. The MP3 response we saw in response to the pandemic more than made up for the incomes lost to widespread shutdowns without making up for the supply that those incomes had been producing. This is very different than post-financial-crisis MP2, where QE, by and large, was not paired with significant fiscal stimulus but instead offset a credit contraction and, as a result, was not inflationary.
“We’re now seeing the inflationary mechanics of MP3 play out and observing just how potent a tool it is. And while the composition of the demand it fueled will evolve (e.g., shift from goods back toward services as COVID recedes), demand is likely to remain highly elevated. There are still large stockpiles of latent spending due to the transformative effects that MP3 has had on balance sheets and the ongoing incentive provided by extremely low real yields, and more fiscal stimulus is on the way. Choking off demand would require central banks globally to move toward restrictive policies quickly, which looks unlikely.”
That bold sentence is critical. I suggest you put it on your bathroom mirror or refrigerator or someplace you will see it every day. Here it is again:
“The MP3 response we saw in response to the pandemic more than made up for the incomes lost to widespread shutdowns without making up for the supply that those incomes had been producing.”
This is simple math. Under MP3, governments and central banks responded to COVID by sustaining incomes (and in some cases actually increasing them) without sustaining supply. The result was rising demand relative to supply, and here we are.
Now, this doesn’t mean they sustained every income. Some of our key suppliers were left out of these schemes because, thanks to globalization, they were in other countries whose governments were less able to help. So, we have seen actual supply contractions in some materials and products, even as production rose for others. Overall consumer goods production is well above the pre-COVID level. The problem is that demand exploded even higher.
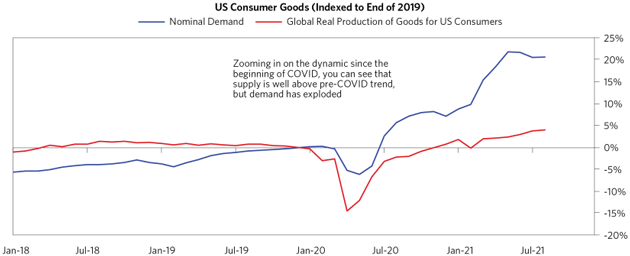
Source: Bridgewater Associates
There is actually a reasonable explanation for this phenomenon. The federal government put $6 trillion directly in the hands of consumers, much of it regardless of need. State and local governments also restricted many retail and service businesses, like restaurants and hotels, theme parks, travel, and other “experience”-related industries. So consumers, unable to spend on services, demanded more goods—roughly 15% more than our logistical infrastructure had ever produced and delivered. Et voila, supply shortages. Throw in supply chain problems and you get inflation in goods.
Services demand, while not yet fully recovered, is headed that way. Workers are the key input for services and employers are facing sticker shock. The maid in my hotel last week in New York was making $30 an hour. My son Trey tells me Cheesecake Factory is offering $18 an hour for a prep cook position in Orlando.
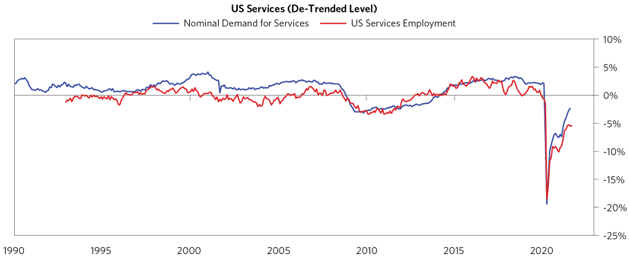
Source: Bridgewater Associates
Given the combination of strong demand and spot shortages, Bridgewater predicts an ongoing game of whack-a-mole. We can address particular problems but there is no quick or easy overall solution.
Policies have both put cash in people’s pockets (government stimulus spending) and raised asset values (through QE which raises asset prices). Low interest rates (negative in real terms) have reduced debt service costs, freeing up more cash that adds to the demand growth. This means continuing price inflation unless either
- Productivity gains let supply catch up with demand, or
- Fiscal and monetary policy tighten enough to reduce demand.
Neither of those appears likely in the near future, which means inflation will continue and maybe intensify, at least over the short to mid-term.
Low Teens Inflation?
My friends at Denmark’s Nordea Bank keep a sharper eye on US inflation than some Americans do. Their latest outlook is more than a little concerning, in part because it shows inflation moving higher even if the Fed accelerates the taper schedule and hikes rates three times in 2022.
Under some pretty reasonable assumptions, their model shows core CPI at 5% before year end. It’s been 4% or higher since June and was 4.6% in October. Note this is core inflation, excluding food and energy. For it to reach 5% in the next three months indicates inflation is seeping deeper into the economy.
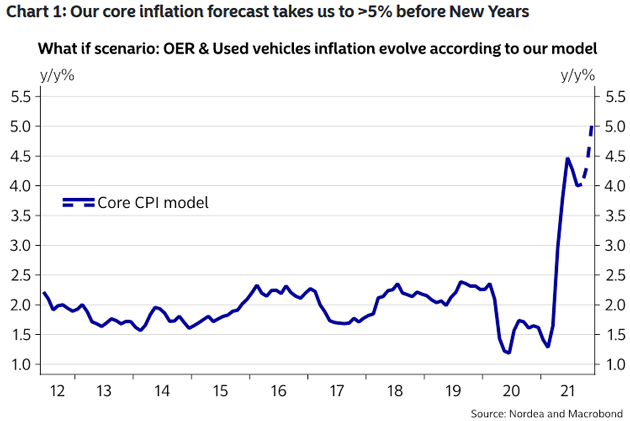
Source: Nordea
In Nordea’s view, it starts with wages. Higher labor costs push inflation higher, but not immediately. There’s usually a 6–9 month time lag. If so, we should start seeing that effect soon.
But on the other hand, are wages up that much? In some industries, absolutely so, but not across the board. Average hourly earnings are actually running a bit behind CPI inflation. That would mean wages are headed higher still, unless inflation has already peaked.
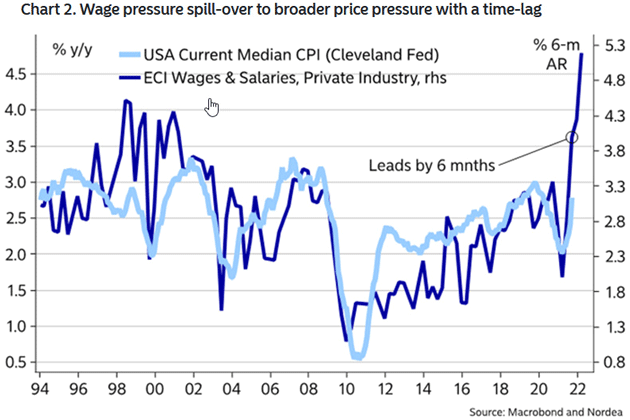
Source: Nordea
Used cars have been a key inflation driver—a bit deceptively since car purchases are infrequent for most people. But it can still hit you if, for instance, the contractor you need to fix your driveway just had to pay a hefty price for their work truck.
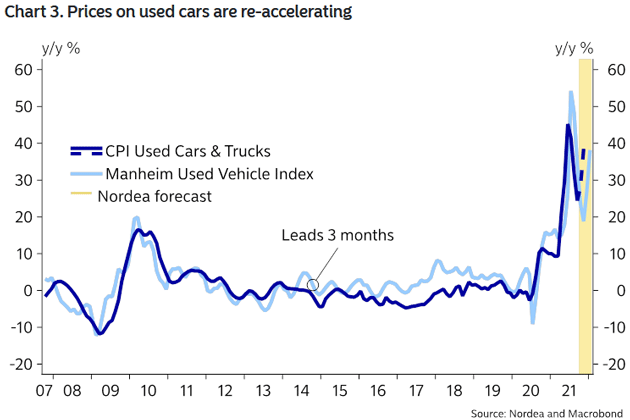
Source: Nordea
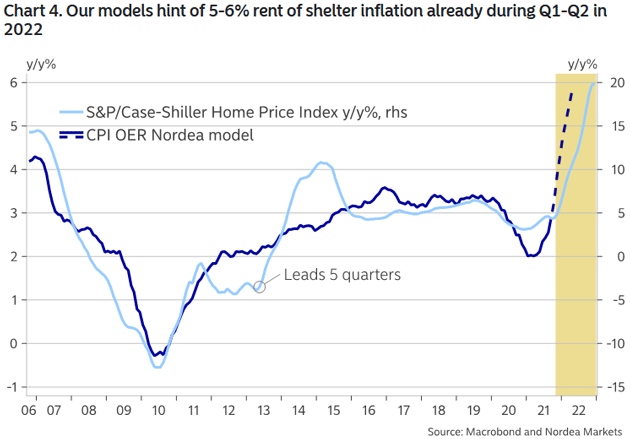
But the real threat is housing prices. Shelter inflation has looked subdued in this cycle because of CPI’s bizarre methodology. My good friend Doug Kass went on a little rant about it this week.
“Shelter is 30% of the CPI. Owner’s Equivalent Rent (OER) makes up about 75% of the shelter calculation or ~23% of the total CPI.
“We moved from using the actual cost of owning a home, to rental equivalence in 1983:
“On October 27, 1981, Commissioner Janet Norwood announced that BLS would convert the CPI for All Urban Consumers (CPI-U) to a rental equivalence measure for homeowner costs, effective with data for January 1983.” (This method was revised again in 1983, 1987, and 1998 as well further pushing the reported numbers down.)
“Now home prices are up 20% year over year but OER was reported to be up 3%. With mortgage rates unchanged, the cost of financing a house has not materially changed over the last 12 months, and insurance and utilities and taxes have all gone up – increased appraisals. The difference between 20% and 3% is 17%. 23% (weight in the CPI) of 17% is 3.9%. Again, there may be a good argument against calculating shelter cost this way, but this is basically how we did it in the 1970s.
“Add the 3.9% to the 6.3% reported, we are up to 10.2%. There is your 1970’s inflation. It is not too hard to find another 2%–3% on top of that for the average person, either. The composition of the basket itself, hedonics, substitution, other methods of massage and statistical torture, there you go.
“Low teens inflation!
“Maybe the guys that calculate inflation today using the 1970s methodology that results in 15% are not too far off from what today’s inflation would be if measured the way it was then.”
To be fair, the economy has changed in other important ways since the 1970s. That era’s methodology might be less meaningful now. But today’s methodology is certainly not ideal, either.
Sidebar: Unrealistic housing price assumptions gave Alan Greenspan, Janet Yellen, and now Jerome Powell room to keep rates low. As I said last week, OER is broken. Properly accounted for, shelter costs would have inflation at 10% in a very public manner no one could dismiss as “transitory.” The Fed would be forced to lean in farther than the bare minimum they are doing today. How you compile your statistics—or maybe I should say how you manipulate them—makes a difference.
But reality breaks through eventually. Nordea’s model predicts 6% growth in the OER model over the next two quarters, which would mean 1.7 percentage points added to the year’s core CPI. Then there’s the separate “rent of shelter” component, where they foresee a similar rise. That would mean 30% of headline CPI jumping 6%, not counting any consumer goods, energy, or food inflation—all of which should be significant.
This is going to create some interesting CPI anomalies. The 12-month comparison for January and February 2022 could very well hit 7% or even 8% because inflation was quite low early this year. It began picking up in March and into the summer.
Source: Nordea
My friends at The Daily Feather sent this chart Friday. Note that the price of food coming from the commodity sector is up almost 50% over the last two years. Bacon has almost doubled to $10. (It’s $12 at Costco in Puerto Rico.)
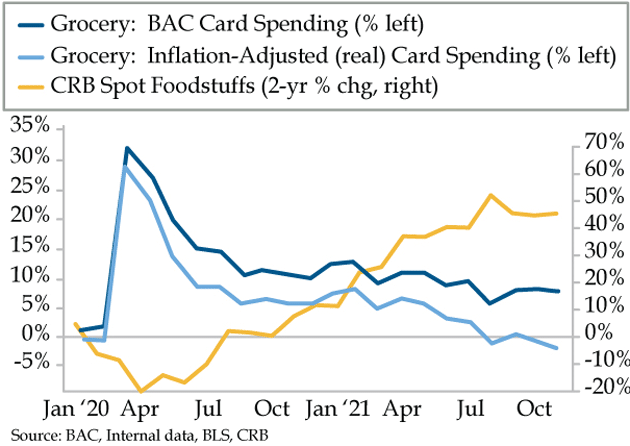
Source: Quill Intelligence
And here’s a closer look at food prices.
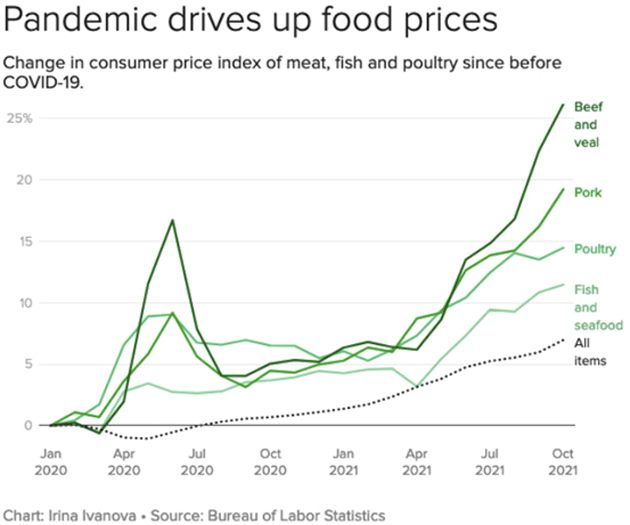
Source: Tony Sagami
Nordea also points to a distressing feedback loop. Higher energy prices lead to higher fertilizer prices, since fertilizer manufacturing uses large amounts of natural gas. Either expensive fertilizer or lack of fertilizer will mean higher food prices.
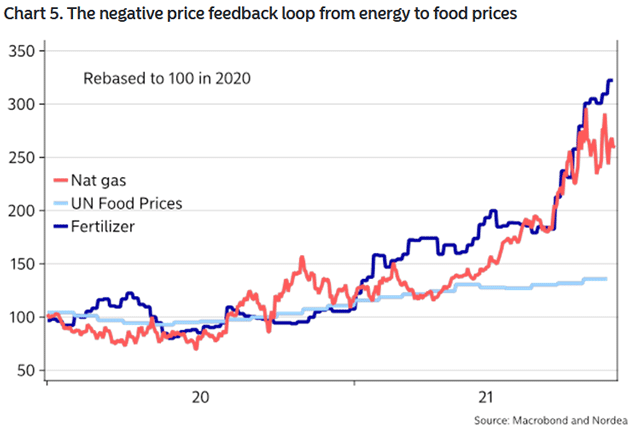
Source: Nordea
Going back to Doug Kass:
“All I know is that a friend from Boston told me that a pastrami sandwich he ordered on Saturday was $23. He didn’t even know the price and he ordered two. When the cashier swiped his credit card, and it indicated $46 (before tax) he asked my friend how much he wanted to tip. My friend then said “excuse me, there must be some mistake, I didn’t order the prime ribeye?” The cashier told him that the price of pastrami doubled over the last few months. Double means up 100%.”
My family in Dallas just bought the prime roast for Thanksgiving. Up 20% at Costco. Same for mushrooms and other ingredients. I am sure you are experiencing the same sticker shock.
Reading through these reports, I found myself looking for something, anything where inflation doesn’t look like a growing problem. It’s tough to find examples. We all want more and, thanks to MP3, most of us can afford more. Yes, a lot of it is debt-financed, which means we’re simply pulling future consumption forward in time. We will pay for it with lower consumption in the future. But that future is down the road. We’re going to party a while longer before the punchbowl runs dry.
But run dry, it will, for a reason no one can change.
Aging Society
Neil Howe is my guru for all things demographic because he excels at taking the long view. Population trends very slowly, but very surely. That long view lets Neil perceive patterns like the “Fourth Turning” which is unfolding right now.
But that’s another topic. Looking more immediately at the US situation, Neil says the overriding #1 issue is labor force participation, not unemployment. Millions have simply left the workforce in the COVID era, for reasons we don’t fully understand.
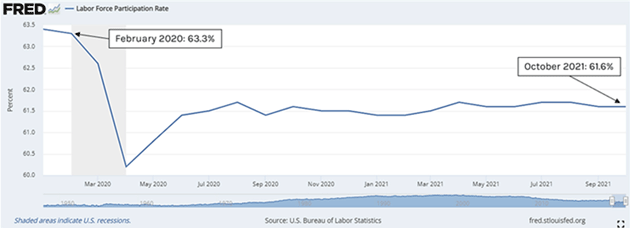
Source: Neil Howe
As a reminder, “participation” in the labor force means adults who either have a job or are looking for one. It excludes retirees, full-time students, etc. You can see in the chart that the number in that category dropped hard in early 2020, bounced a bit that summer and has gone stubbornly sideways ever since. Whatever drove people out of the workforce happened quickly and hasn’t changed.
But in the longer perspective, participation was already trending downward. It peaked about 20 years ago.
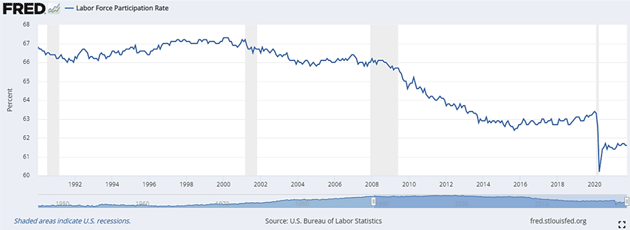
Source: Neil Howe
Here’s Neil’s analysis.
“In the 2020s, this falling trend will speed up, not slow down, due to one further driver: the aging of the large Boomer population after they move past age 65. Yes, Boomers are workaholics, but even they want a rest. Between age 65 and 74, the LFP rate is still around 30%. But at age 75+, it drops to 10%. This year, in 2021, the first large 1946-born cohort is hitting age 75. And from now on, every year will bring this large horde ever further from their time clocks and keyboards and ever closer to their lakeside cottages.
“In the current BLS projection of future LFP rates, which also points to an ongoing decline, BLS analysts make precisely this point—that aging itself will become a new driver pushing LFP lower.
“In 2030, the BLS projects the LFP rate at 60.4—down roughly 0.2 pp per year from its annual 2019 value (63.1). Measured in millions, the BLS projects the labor force at 169.6M in 2030. That’s a CAGR from 2019 of only +0.33%. Which is half the historical growth rate from 2010 to 2019 (+0.67%). Which is itself half the historical growth rate from 1990 to 2000 (+1.25%). And yes—I just can’t stop—even this is half of what it was from 1970 to 1980 (+2.60%).
“You just can’t miss the second derivative here. It’s negative, not positive. We’re an aging society. And when you juxtapose today’s immediate pandemic drivers with America’s long-term demographic drivers, any window of full LFP recovery is likely to be very brief if it happens at all.”
This is troubling. We need energy, housing, and so on, but labor is an input to everything. The Baby Boomer generation, simply by its presence, gave the US a giant economic boost. For decades employers could draw on a large available workforce. Those days were already winding down before COVID and it will mean a profoundly different economy in the future, unless we somehow find more workers.
More immigration might help—the legal kind with appropriate screening. Apply to our embassy for a visa. We should welcome peaceful, educated people who want to work and contribute. There are ways to do that without simply throwing open the borders.
But even that may be of limited help because many other countries have similar or even greater labor shortages. Potential immigrants have opportunities at home that make moving to the US less attractive. But however we attract labor, we must make up for the dwindling domestic supply.
About That Supply Chain
That last $1.9 trillion stimulus bill was simply an inflation bridge too far. Larry Summers and others, including me, warned about the potential problem. It is why Joe Manchin wants to hit the pause button before we spend more. The intentions were good, but there are unintended consequences as it was coupled with QE and zero interest rates.
But at some point, that stimulus is going to recede. Then we will be dealing with supply shock inflation. Our just-in-time inventory systems will change to “just-in-case” systems. That means higher costs, but in the meantime is also means less supply which means higher prices. Eventually we get back to disinflation.
Low GDP growth + high prices is different than the 1970s stagflation, which was high inflation and unemployment, but is stagflation nonetheless. A common theme I heard in my New York meetings last week was how this will affect the 2022 midterm elections. “It’s the economy, stupid!”
Dallas, Lake Granbury, and New York
Monday Shane and I fly to Dallas. Tuesday I have a few meetings and a segment for Economic War Room with my good friend Kevin Freeman. Then that night dinner with some friends I have missed. Wednesday we move to Lake Granbury for Thanksgiving with the family. My niece Jennifer and my daughter Tiffani live next to each other on the lake. I will cook my usual prime roast and mushrooms and a few other things. Lots of kids and grandkids and right now the weather looks good. Then I am toying with a trip back to New York. I know I will need to be in Florida the first part of next year.
You have a great week and I hope you get to spend Thanksgiving with family and friends. The rest of the world doesn’t celebrate Thanksgiving like we do in the US, but it is my favorite holiday. I think I read somewhere that calories don’t count on Thanksgiving. I’m sure that was based on solid scientific evidence… And you should follow me on Twitter, where we have a lot of fun and I’m a little bit edgier.
Your facing sticker shock at the grocery store analyst,

STAY INFORMED! Receive our Weekly Recap of thought provoking articles, podcasts, and radio delivered to your inbox for FREE! Sign up here for the HoweStreet.com Weekly Recap.
John Mauldin November 21st, 2021
Posted In: Thoughts from the Front Line
Next: The Old ‘Flight to Safety’ Story »