ALWAYS CONSULT YOUR INVESTMENT PROFESSIONAL BEFORE MAKING ANY INVESTMENT DECISION

July 20, 2021 | The Most Splendid Housing Bubbles in Canada: Why the Bank of Canada is Cutting QE

Wolf Richter


At least the Bank of Canada is officially acknowledging the craziness of the Canadian housing market, which has been deemed to be the second biggest housing bubble in the world, behind New Zealand, whose central bank also officially acknowledged its housing bubble, and stopped QE cold turkey, unlike the Fed, which has refused to officially acknowledge anything.
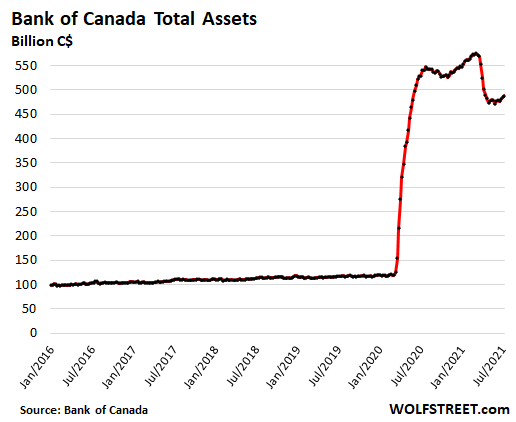
Starting last October, the Bank of Canada began the process of ending its asset purchases. Since then, it stopped buying mortgage-backed securities, unwound its holdings of repos and Treasury bills, and cut the amount of its weekly purchases of Government of Canada bonds for the third time, from C$5 billion per week last year to C$2 billion per week now. The assets on its balance sheet dropped from C$575 billion in March to C$487 billion as of last week. And in its pronouncements, the housing bubble looms large.
Housing markets react slowly, spread over years, and Canada’s housing market has started to react just a teeny-weeny bit. Home sales in June dropped by 8.4% from May, the third month in a row of declines, and inventory increased to 2.3 months’ supply, up from 2.1 months. And in a few markets, such as Greater Toronto, the historic price spikes have started to “decelerate,” as it’s now called, on a month-to-month basis, but they’re still crazy.
In Greater Vancouver, house prices jumped by 2.7% in June from May and are up 14.7% year-over-year, according to the Teranet-National Bank House Price Index today. Note how the Bank of Canada’s radical monetary policies starting in March 2020 turned around Vancouver’s housing bust that had already been under way for a couple of years:
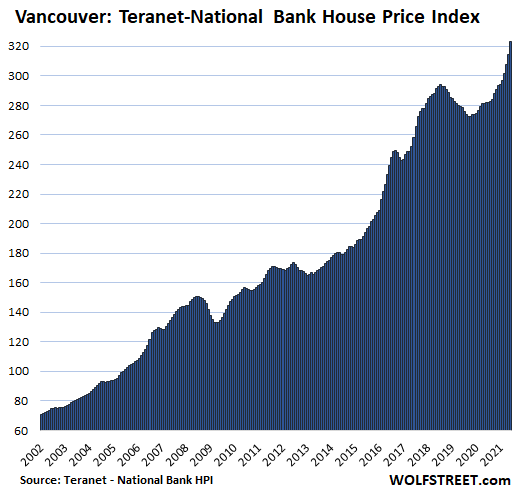
The Teranet-National Bank House Price Index tracks prices of single-family houses through “sales pairs,” similar to the Case-Shiller Home Price Index in the US, comparing the price of a house that sold in the current month to the price of the same house when it sold previously. Since it tracks how many more Canadian dollars it takes to buy the same house over time, it is a measure of house price inflation.
In the Greater Toronto Area, the house price spike “decelerated”: In June, the index jumped by 2.7% from May, but that crazy increase (annualized 32%!) was the slowest increase since March. Year-over-year, the index jumped by 15.9%. Note the decline in house prices in 2017, and the wavering that followed, until the BoC opened its vault:
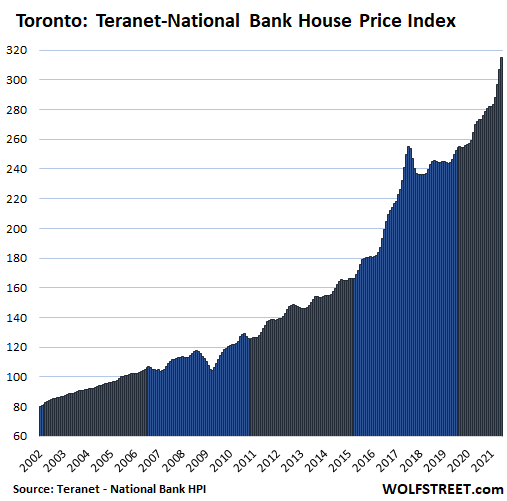
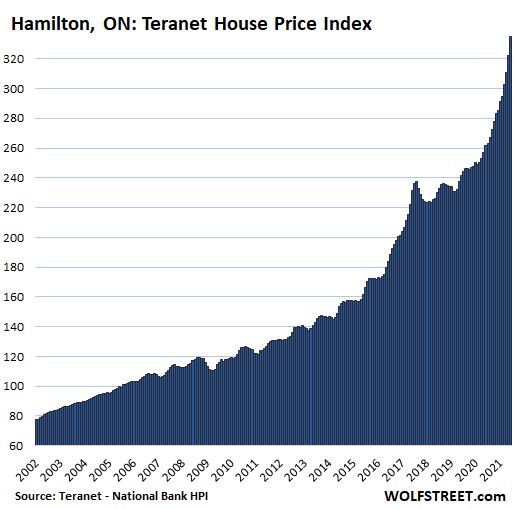
All charts here are on the same scale as the chart for Vancouver, with more white space appearing at the top as we go down the list, indicating the slower price increases over the past 20 years, compared to Vancouver.
In Hamilton, Ontario, house prices spiked by 3.8% in June from May, and by a mind-boggling 28.0% year-over-year, thank you Bank of Canada hallelujah. But now the BoC, with an eye on this exponential increase in house price inflation, is pulling back its radical monetary policies. Here too, the housing market had started to decline and waver in 2017, and it was the BoC’s pandemic policies that triggered this spike:
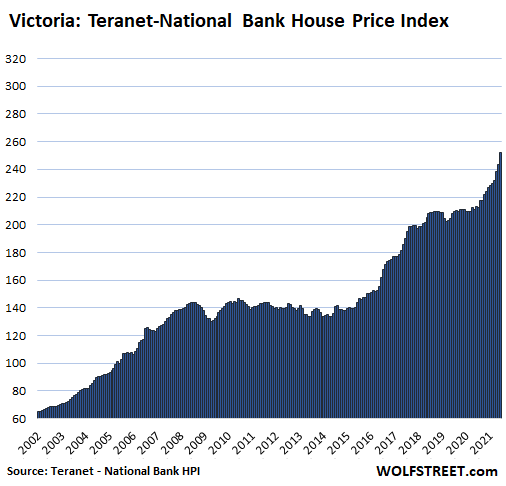
In Victoria, house prices spiked 2.7% in June and 18.5% year-over-year. The housing market had flattened in 2018 and stayed that way until the BoC opened its vault in March 2020:
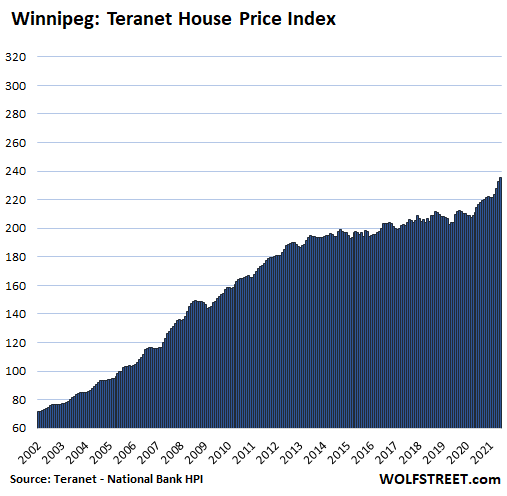
In Winnipeg, house prices jumped 1.3% for the month, the slowest increase since March, a sign of this “deceleration,” and are up 9.9% year-over-year. There too, house prices had flattened in 2013, but the BoC’s policies knocked them loose:
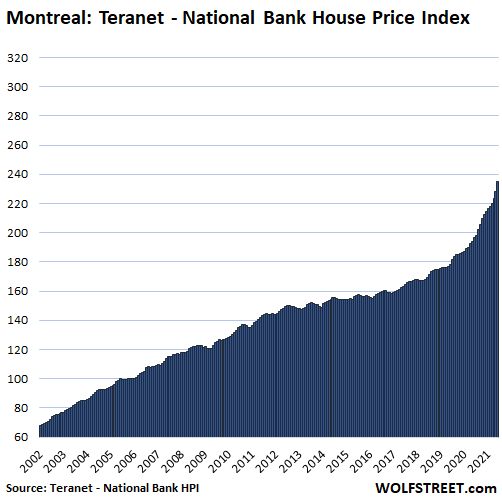
In Montreal, house prices jumped 2.8% for the month and 19.4% year-over-year:
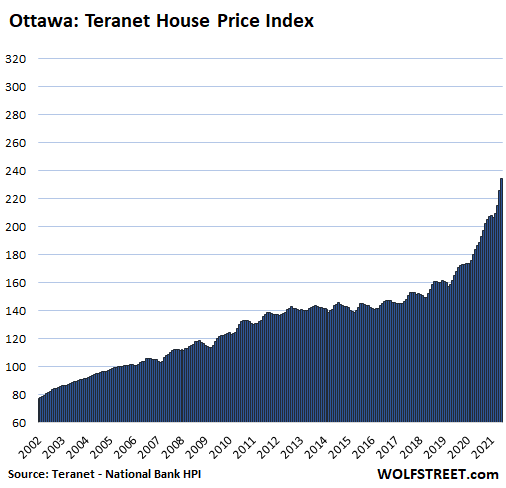
In Ottawa, house prices spiked by a whopping 4.0% for the month (48% annualized!) and by 25.8% year-over-year. But wait, that crazy 4.0% increase in June was down from the scary-crazy increase of 4.9% (59% annualized) in May:
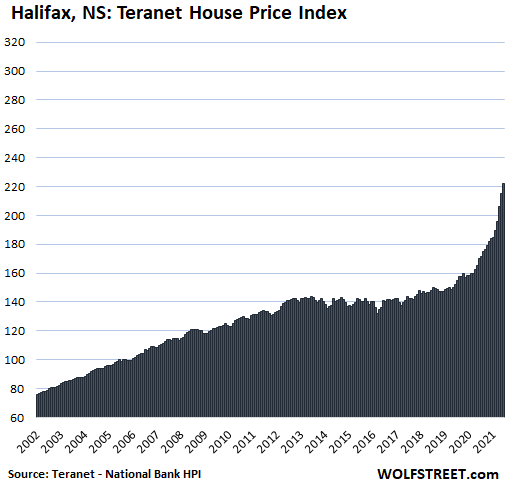
In Halifax, house prices spiked 3.5% in June, and as much of a whopper as that was, it was a deceleration from the 4.3% spike in May and the 5.4% spike in April. Year-over-year, prices have shot up by 30.8%:
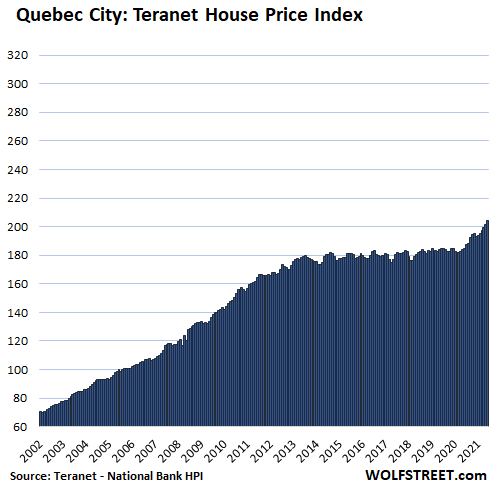
In Quebec City, house prices rose 1.3% for the month and by 10.8% year-over-year:
Calgary and Edmonton, the last two cities in the Teranet-National Bank House Price Index, are Canada’s oil-bust cities. In Calgary, house prices were still below where they’d been in 2014, and just above where they’d been in 2007; and the index for Edmonton remains substantially below the oil-boom peak of 2007. In recent years, some form of reasonability has moved in. And so neither one of the cities qualifies for this list of the most splendid housing bubbles in Canada.
STAY INFORMED! Receive our Weekly Recap of thought provoking articles, podcasts, and radio delivered to your inbox for FREE! Sign up here for the HoweStreet.com Weekly Recap.
Wolf Richter July 20th, 2021
Posted In: Wolf Street
Next: The Reprobate »