ALWAYS CONSULT YOUR INVESTMENT PROFESSIONAL BEFORE MAKING ANY INVESTMENT DECISION

May 14, 2024 | Household Debt, Delinquencies, Collections, and Bankruptcies: The Free-Money Era Is Over for our Not So Drunken Sailors

Wolf Richter


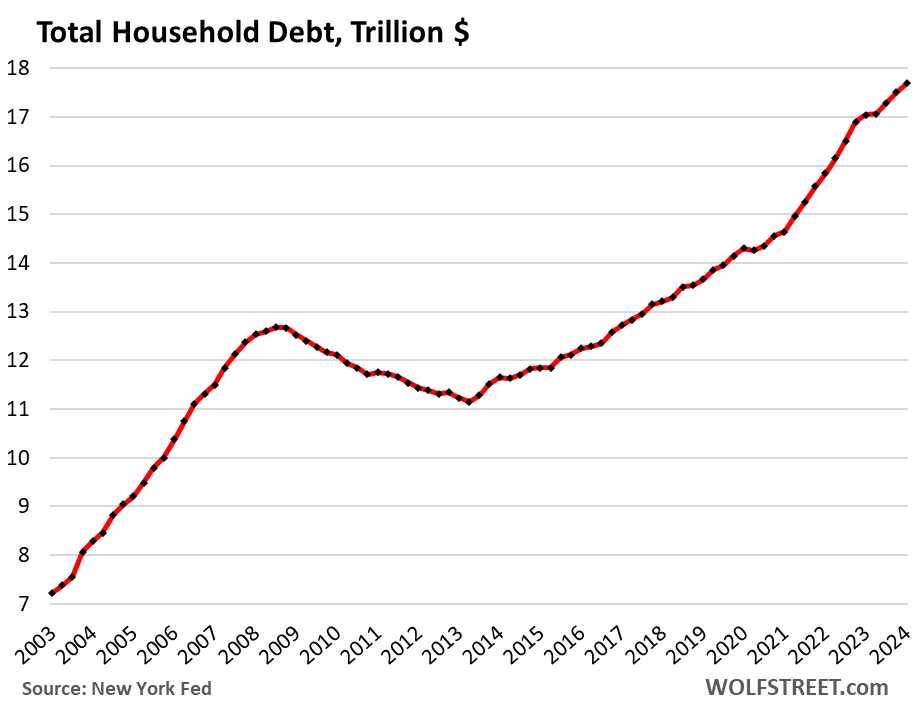
Total household debt outstanding ticked up by $184 billion, or by 1.1%, in Q1 from Q4 to $17.7 trillion, on declines in credit card balances, other revolving balances, and student loan balances, according to the Household Debt and Credit Report from the New York Fed today:
- Mortgage debt: +1.6%; to $12.4 trillion
- HELOC balances: +4.4%; to $376 billion
- Auto loans: +0.6%; to $1.62 trillion
- Credit card balances: -1.2%; to $1.11 trillion
- Other balances: -2.0%; to $543 billion
- Student loans: -0.4%; to $1.59 trillion (due to loan forgiveness, not because people suddenly paid down their loans; we don’t even consider them “loans” anymore).
The aggregate burden of household debt.
One way to measure the burden of debt is to compare the debt to the amount of income that is available to service this debt.
Everything is more expensive than it was years ago – particularly homes and vehicles. In addition, the population has increased over the years. So financed amounts have risen.
But “disposable income” has risen too – defined as income from all sources but not capital gains (wages, interest, dividends, rentals, farm income, small business income, transfer payments from the government, etc.), minus taxes and social insurance payments. This is essentially the cash consumers have available to spend on housing, food, cars, debt payments, etc. And the rest that they don’t spend, they save.
Disposable income (data from the Bureau of Economic Analysis):
- Quarter over quarter: +1.1%
- Year-over-year: +4.3%
- Since 2019: +26.7%.
So in aggregate, the entire $17.7 trillion in household debt amounts to 85% of disposable income, roughly unchanged over the past four quarters, and a historically low burden, beaten only during the stimulus era when free money washed over consumers and became part of their disposable income.

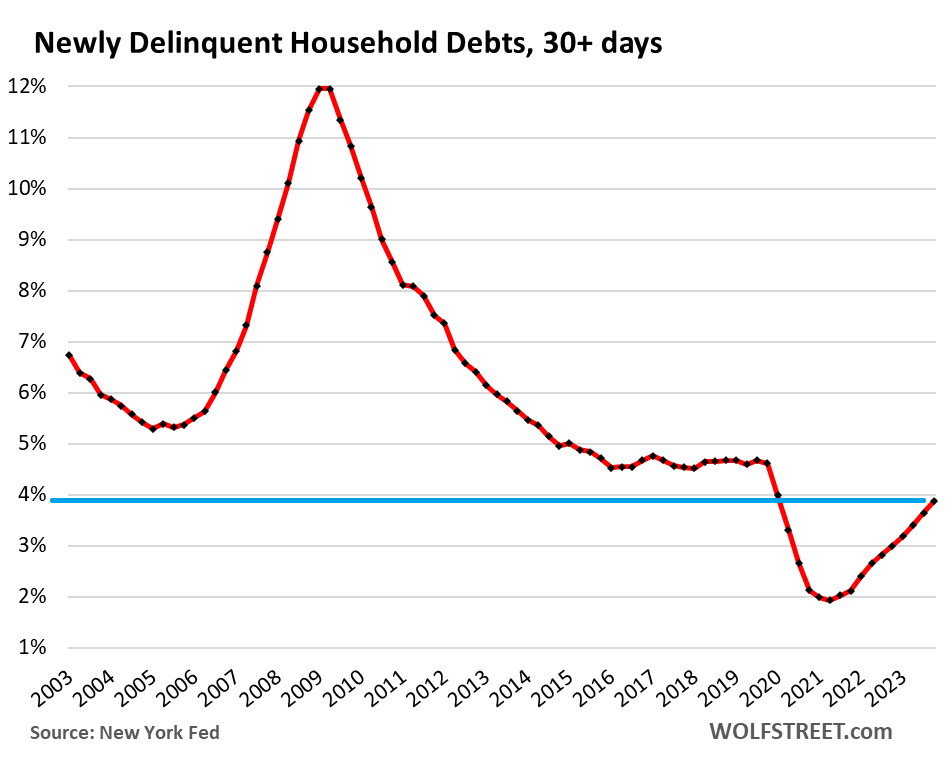
Delinquencies haven’t even normalized yet.
Transitioning into delinquency: Household debts that were newly delinquent by 30 days or more at the end of Q1 ticked up to 3.9% of total debt balances — still lower than any time before the pandemic.
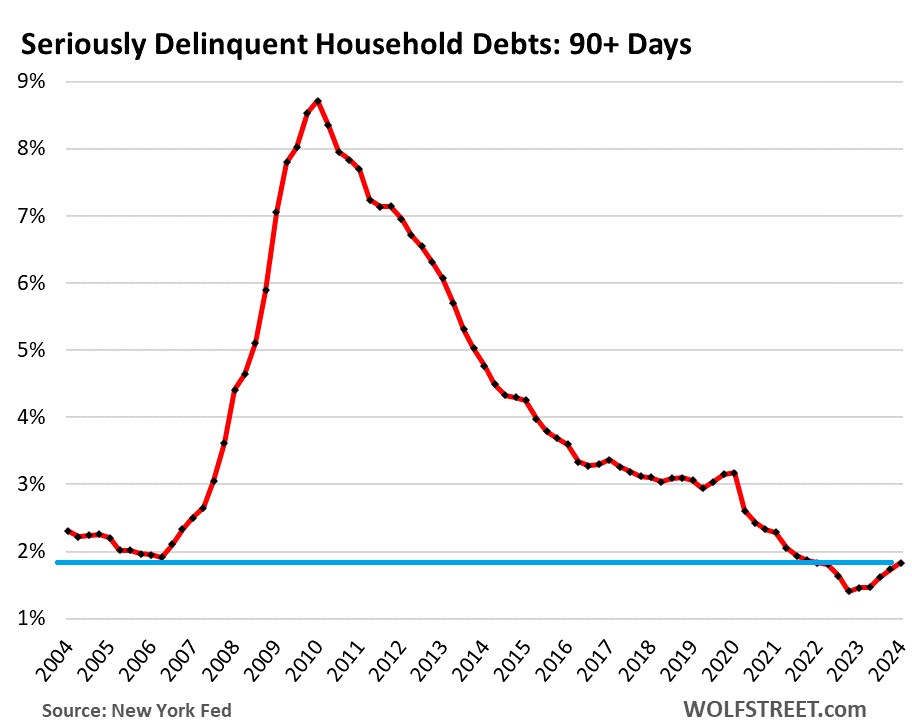
Serious delinquency: Household debts that were 90 days or more delinquent by the end of Q1 edged up to 1.8% of total balances, still lower than any time before the free-money pandemic.
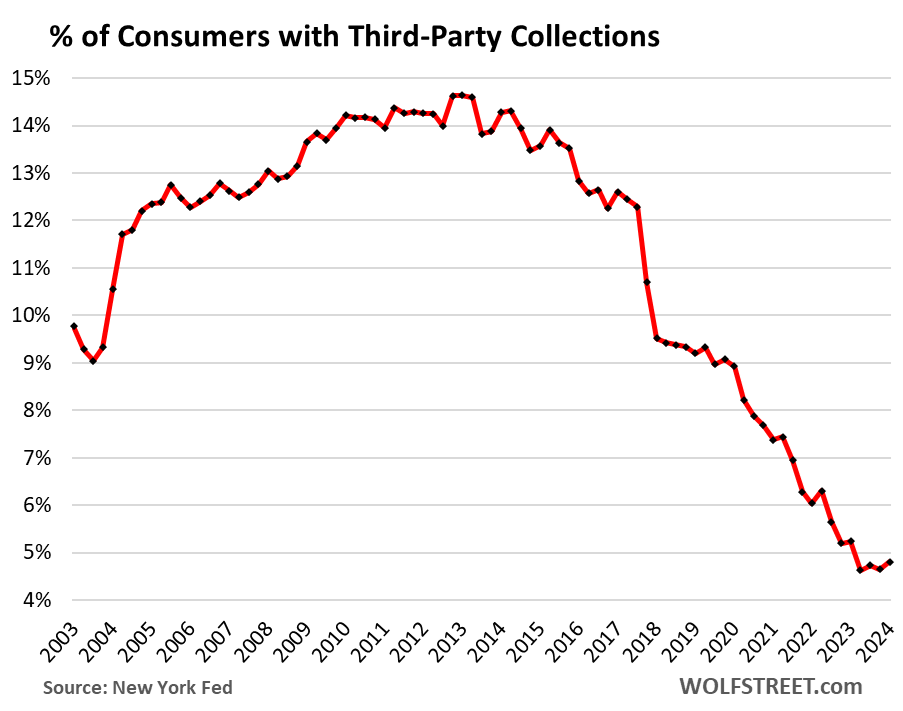
Consumers with third-party collections near record lows.
So these are the poor souls that are being hounded by the collection agencies to which banks and other lenders sold their defaulted and written-off consumer loans for cents on the dollar.
The percentage of consumers with third-part collections inched up to 4.8%. Just about every quarter since the beginning of the pandemic, the percentage had hit new record lows, and that process finally bottomed out a year ago, and what we’re looking at here is still lightyears from anything close to normal:
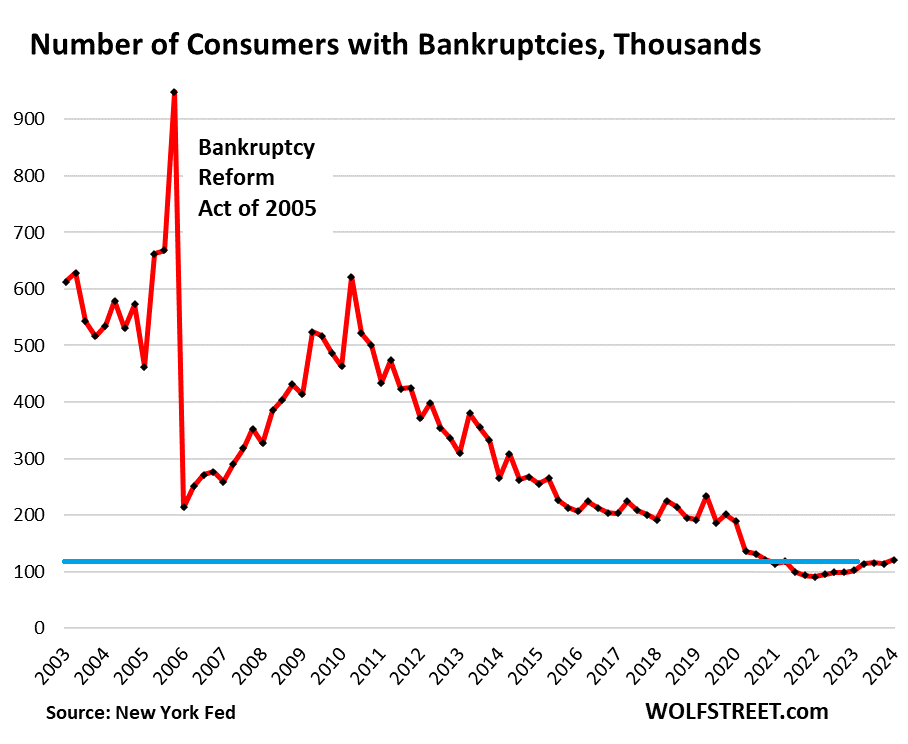
Bankruptcies continue to scrape along the historic bottom, with just 121,000 consumers with bankruptcy filings in Q1, compared to the already low levels of the Good Times before the pandemic of around 200,000:
The free-money era is over.
That is what the overall household debt picture shows. Our Drunken Sailors, as we have come to call them lovingly and facetiously, have been sober enough overall to keep their balance sheets overall in good shape, with the debt burden moving along historically low levels.
But somebody is always in trouble, subprime is always a factor, but subprime doesn’t mean “low income,” it means “bad credit,” and goes across the income spectrum, and there’s always some of it.
We’re going to dive into the details shortly with separate articles for housing debt, credit card debt, and auto debt. So stay tuned, we’ll shoehorn those articles in between our CPI report, Canada’s most splendid housing bubbles, and other stuff coming up over the next few days. Details on housing debt coming up next.
STAY INFORMED! Receive our Weekly Recap of thought provoking articles, podcasts, and radio delivered to your inbox for FREE! Sign up here for the HoweStreet.com Weekly Recap.
Wolf Richter May 14th, 2024
Posted In: Wolf Street