ALWAYS CONSULT YOUR INVESTMENT PROFESSIONAL BEFORE MAKING ANY INVESTMENT DECISION

June 28, 2022 | The Most Splendid Housing Bubbles in America, June Update: “Deceleration” and “Tipping Point” of the Raging Mania

Wolf Richter


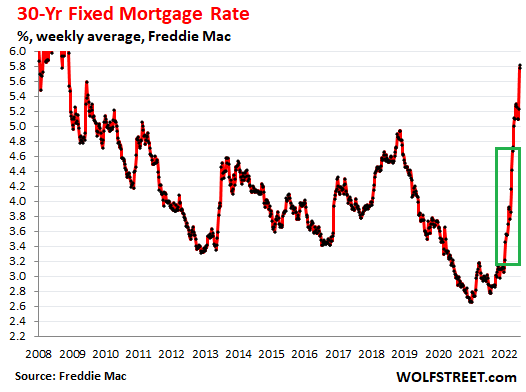
The first “deceleration” and “signs of a tipping point” cropped up in the S&P CoreLogic Home Price Index, which was released today. But today’s data for “April” consists of the three-month average of closed home sales that were entered into public records in February, March, and April, representing deals that were made a few weeks earlier, roughly in January, February, and March, funded with mortgage rates prevalent at that time and earlier for home buyers with pre-approved mortgages with rate locks when they were pre-approved, so roughly based on the mortgage rates prevalent in December through March, ranging from 3.2% to 4.7% (green box):
Other indicators of the housing market that don’t lag as far behind have shown more advanced shifts in the underlying dynamics, including sagging sales amid a surge in supply in May, a sharp drop in mortgage applications in May and into June, and a surge in active listings in May.
The S&P CoreLogic Case-Shiller Index will gradually begin to reflect those dynamics over the next few months. Today’s release for “April,” looking back at a period earlier this year, when mortgage rates were a lot lower, still reflects the mad scramble to buy a home and lock in the mortgage rates at the time before they rise even further.
The National Case-Shiller Index still jumped by 2.1% in April from March, but that was down from the 2.6% spike in March. Year-over-year, the index spiked by 20.4%, but that was down from the 20.6% spike in the prior month. This suggests “further deceleration ahead,” said CoreLogic Deputy Chief Economist Selma Hepp said in a note this morning.
“In particular, there is a buildup in overall active inventory as fewer buyers are rushing to make offers, resulting in an increase in the share of homes that have reduced their prices from the original list price,” Hepp said.
“Also, there is a notable deceleration of monthly gains in the Western markets where a rush to lock in favorable mortgage rates pushed home price growth higher in prior months,” Hepp said.
The top three most splendid housing bubbles.
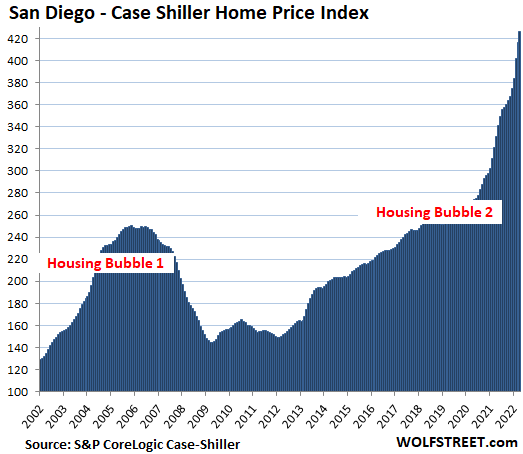
San Diego metro: Prices of single-family houses jumped by 2.3% in “April” (average of February, March, and April), but that was down from the 3.7% spike in “March.” Year-over-year prices spiked by 29.0%, but that was down from 29.6% in March – hence first signs of “deceleration.”
The index value of 426 for San Diego means that home prices exploded by 326% since January 2000, when the index was set at 100, despite the plunge in the middle.
This price growth of 326% since 2000 is 4.5 times the rate of CPI inflation (+73.2%), which crowns San Diego the most splendid housing bubble on this list, followed by Los Angeles and Seattle. All charts here are on the same index scale as San Diego.
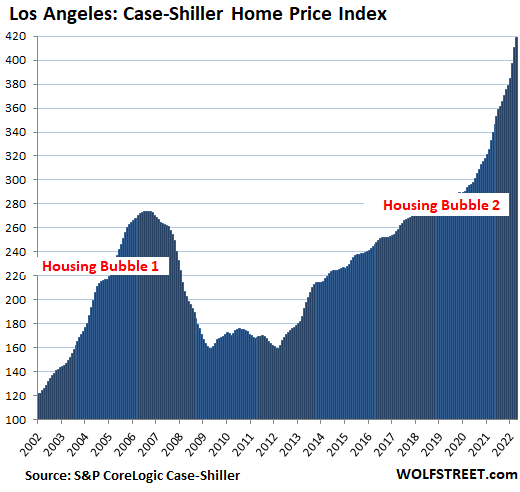
Los Angeles metro: The Case-Shiller index jumped by 2.0% in April from March, but that was down from the 3.3% spike in March. Year-over-year, it spiked by 23.4%. The index value of 419 indicates that house prices exploded by 319% since January 2000, making the Los Angeles metro the second most splendid housing bubble on this list:
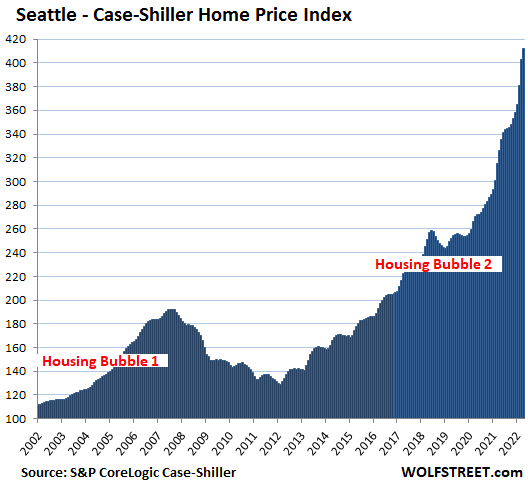
Seattle metro: The index jumped by 2.3% for the month, but as crazy as that seems, it was less than half the 5.6% spike in the prior month – another sign of the “deceleration.” Year-over-year, the index spiked by 26.1%, but that was down from 27.7% in the prior month. Since January 2000, house prices spiked by 312%, 4.3 times the rate of CPI inflation:
It’s just house price inflation.
The Case-Shiller Index uses the “sales pairs” method, comparing the price of a house when it sells in the current period to the price when it sold previously. It incorporates adjustments for home improvements. By tracking how many dollars it took to buy the same house over time (methodology), it measures the purchasing power of the dollar with regards to the same house, and is thereby a measure of house price inflation.
The other most splendid housing bubbles in the 20 City Case-Shiller Index.
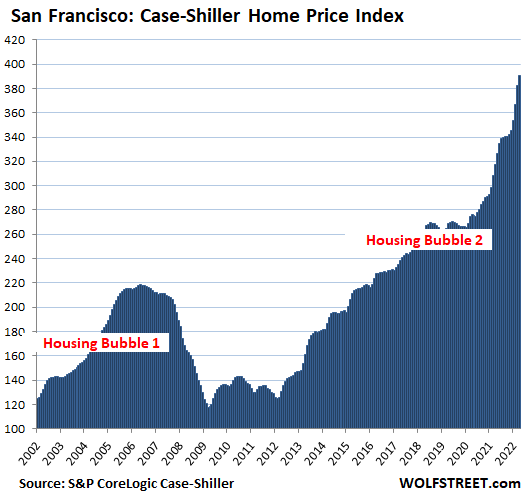
San Francisco Bay Area (five-counties covering San Francisco, part of Silicon Valley, part of the East Bay, and part of the North Bay): House prices jumped by 2.2% for the month, but that was just about half of the 4.3% spike in March. Year-over-year, the index jumped by 22.9%, but that was down from the 24.1% spike in the prior month – hence the “deceleration”:
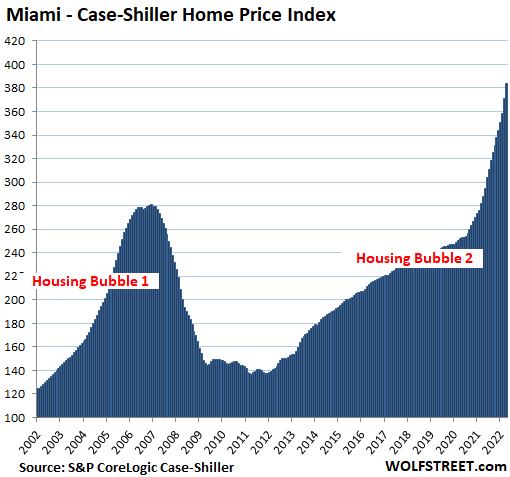
Miami metro: The index spiked 3.4% for the month, down from the 3.6% spike in the prior month. Alas, year-over-year, it spiked by 33.3%, up from 32.0%, the fastest ever in the data, faster even than at the apex of the Housing Bubble 1, before Miami’s epic Housing Bust:
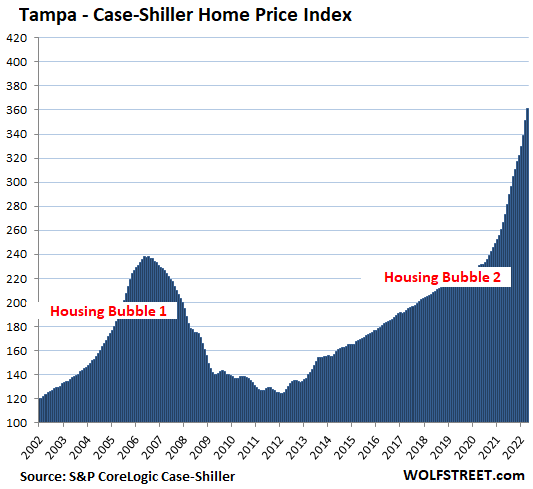
Tampa metro: House prices spiked by 3.0% for the month, but that was down from the 3.7% spike in the prior month. Year-over-year, prices spiked by 33.3%, down from 34.8%, which had been a record that had out-spiked the craziness just before the Tampa’s epic housing bust:
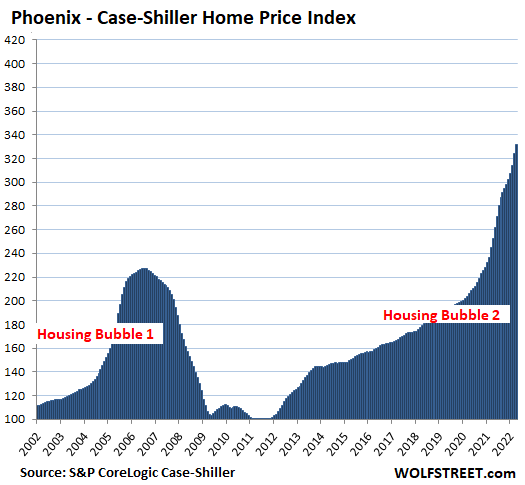
Phoenix metro: The index jumped by 2.5% for the month, down 3.0%. Year-over-year, it spiked by 31.3%, down from 32.4%, and the 10th month in a row of over-30% year-over-year spikes:
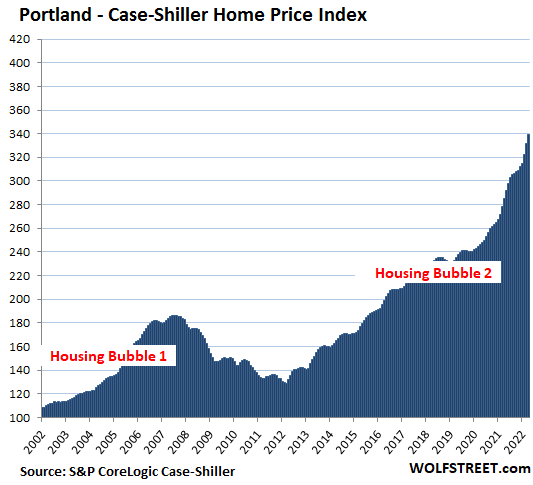
Portland metro: +2.2% for the month, down from +2.9%; and +19.1% year-over-year, down from +19.3%:
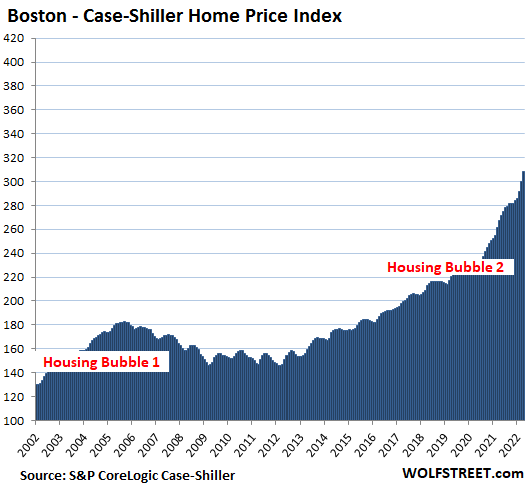
Boston metro: +2.8% for the month, up from +2.6%; and +15.1% year-over-year, up from 14.5%:
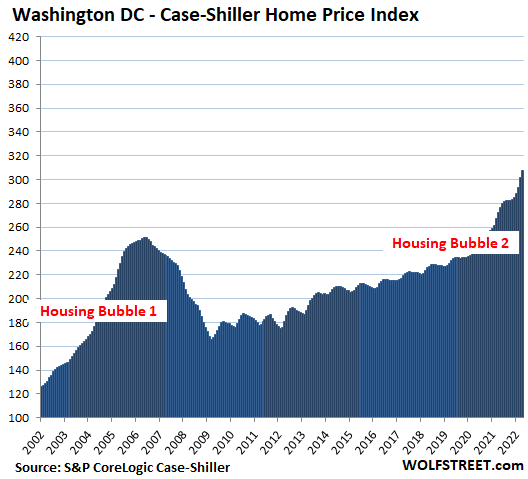
Washington D.C. metro: +1.9% for the month, down from +2.9%; and +12.7% year-over-year, down from 12.9%:
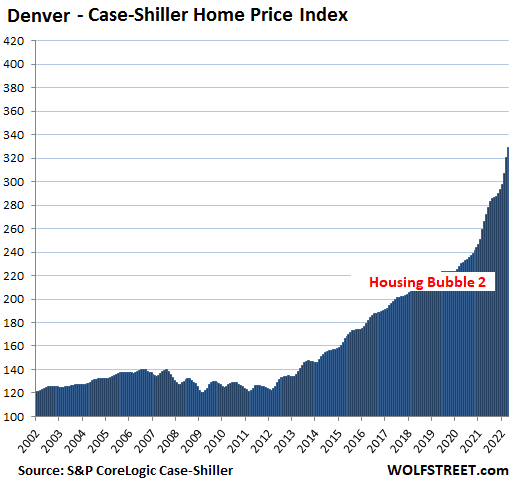
Denver metro: +2.5% for the month, down from 4.5%; and +23.6% year-over-year, down from 23.7%:
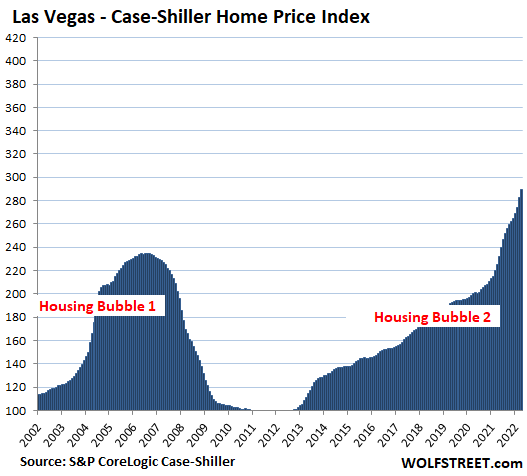
Las Vegas metro: +2.3% for the month, down from 3.1%, and +28.4% year-over-year, down from 28.5%:
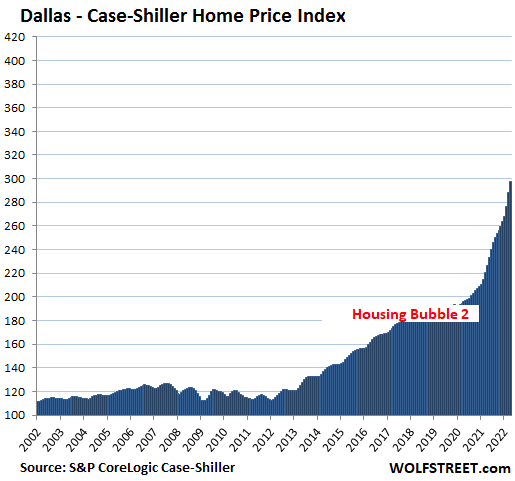
Dallas metro: +3.2% for the month, down from 4.3%; and +31.0% year-over-year, a new record, up from +30.7%:
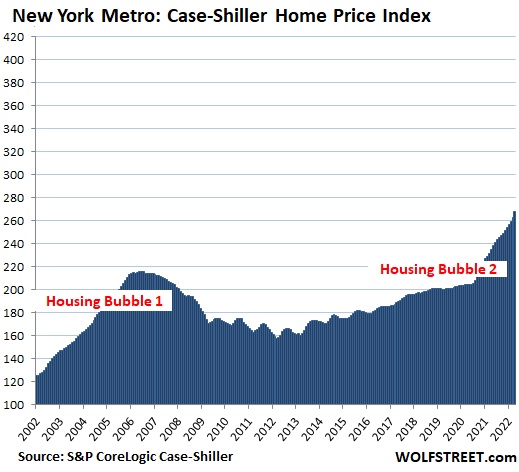
New York metro, the huge market within commuting distance to New York City (“New York Commuter,” as the Case-Shiller calls it): +2.0% for the month, up from +1.6%; and +14.3% year-over-year, up from +13.7%. With its index value of 268, the New York Commuter metro has experienced 168% house price inflation since January 2000, 2.3 times the rate of CPI inflation.
The remaining cities in the 20-City Case-Shiller Index (Chicago, Charlotte, Minneapolis, Atlanta, Detroit, and Cleveland) have had less house price inflation and don’t qualify for this list.
STAY INFORMED! Receive our Weekly Recap of thought provoking articles, podcasts, and radio delivered to your inbox for FREE! Sign up here for the HoweStreet.com Weekly Recap.
Wolf Richter June 28th, 2022
Posted In: Wolf Street