ALWAYS CONSULT YOUR INVESTMENT PROFESSIONAL BEFORE MAKING ANY INVESTMENT DECISION

December 27, 2021 | My “Wealth Effect Monitor” & “Wealth Disparity Monitor” for the Fed’s Money-Printer Economy: December Update

Wolf Richter


My “Wealth Effect Monitor” uses the data that the Fed releases quarterly about the wealth of households. The Fed, after having released the overall data for the third quarter earlier in December, has now released the detailed data by wealth category for the “1%,” the “2% to 9%,” the “next 40%” (the top 10% to 50%) and the “bottom 50%.”
Wealth here is defined as assets minus debts. The wealth of the 1% ($43.9 trillion, according to the Fed) is owned by 1% of the population. The wealth of the “bottom 50%” (only $3.4 trillion) gets split across half the population. My Wealth Effect Monitor takes this a step further and tracks the wealth of the average household in each category.
The average wealth in the 1% category ticked up by only $121,000 in Q3 from Q2, after skyrocketing over the prior five quarters, to $34,478,000 per household (red line). In the bottom 50% category, the average wealth ticked up by $6,800 $53,600 (green line). And get this: About half of that “wealth” at the bottom 50% is the value of consumer durable goods such as cars, appliances, etc. Even the top 2% to 9% (yellow), have been totally left behind by the explosion of wealth at the 1%:
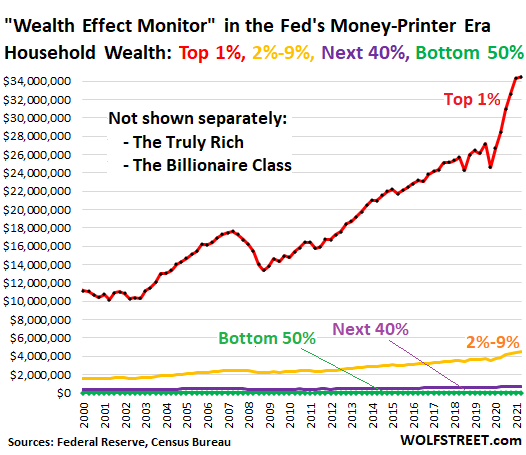
Note the immense increase in the wealth for the 1% households, following the Fed’s money-printing scheme and interest rate repression in March 2020.
A household is defined by the Census Bureau as the people living at one address, whether they’re a three-generation family or five roommates or a single person. In the third quarter, there were 127.4 million households in the US, per Census estimates.
Those top 1% households were the primary beneficiaries of the Fed’s policies during the pandemic. And they have hugely benefited since the Financial Crisis. They benefit the most when the Fed prints money (QE), which is designed to inflate asset prices, which benefits those that hold the most assets the most. This is not a secret. It’s the official policy of the Fed and the desired outcome of these official policies is officially called the “Wealth Effect.”
Billionaires got more billions, half of Americans got peanuts.
The Fed doesn’t provide separate data on the truly rich (the 0.01%) and the Billionaire Class, a distinct class in American society whose members often get named in the media with specific titles that have “billionaire” in them. They’re the prime beneficiaries of the Fed’s monetary policies.
According to the Bloomberg Billionaires Index, the top 30 US billionaires are worth a total of $2.23 trillion. On average, that amounts to a wealth of $74.5 billion per billionaire among the top 30 richest US billionaires. Three months ago, each of the top 30 US billionaires at the time was worth on average $69.2 billion. So, over the three-month period, the average billionaire among the top 30 US billionaires each gained $5.3 billion in wealth.
But the bottom 50% households, that huge mass of Americans, on average gained just $6,900 in wealth over the third quarter. And the wealth disparity between the top billionaires and the bottom 50% exploded.
You can kill someone with reckless usage of percentages. If I give a homeless person $5, and he already has $5 in his pocket, I increased his wealth by 100%. But he still is homeless and still doesn’t have any wealth. Percentage increases are touted as a way to show that the wealth at the bottom increased, when in fact, it increased by only peanuts because the bottom 50% have so little and even a big percentage increase is still nearly nothing, compared to the billionaire class.
Over the past quarter, the average wealth of the top 30 US billionaires increased by 7.6%, according to the Bloomberg Billionaire Index. This amounts to an increase of $5.3 billion per billionaire. This is a huge amount of money for one person to gain due to inflated asset prices in one quarter.
The average wealth at the bottom 50% increased by 14% during the quarter. But this amounts to only $6,900, further blowing out the wealth disparity between them and the billionaires by the billions per household!
Within each category of wealth, the range of wealth is huge. The top 1% range from those who’re just run-of-the-mill wealthy to those who’re worth tens of billions of dollars. The bottom 50% range from the desperately poor to those who’re comfortable with a modest house, a small 401k, and some durable goods, and weighed down by lots of debt.
Fed goes all in on Wealth Disparity as solution to the pandemic.
Since March 2020, the Fed printed $4.8 trillion and repressed short-term interest rates to near-zero, for the sole purpose of inflating asset prices massively in order to enrich the asset holders massively. The Fed has long clung to the doctrine that making the already rich vastly richer by printing money and repressing interest rates creates economic activity.
This doctrine is called the Wealth Effect, and it has produced the greatest economic injustice committed in recent US history.
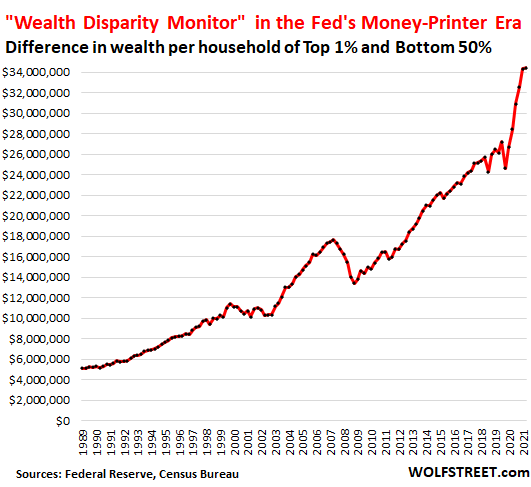
My “Wealth Disparity Monitor” (chart below) tracks that economic injustice by showing the difference in wealth between the top 1% and the bottom 50%, using the Fed’s own data, on a per household basis.
Back in 1990, the wealth disparity between the average bottom 50% household and the average top 1% household was $5 million. By Q3, 2021, that wealth disparity ballooned by nearly 600% to $34.4 million.
This is a great way for a handful of people at the Fed to tear up a whole society. Conversely, a big market downturn, with asset prices returning to where they were a few years ago, would repair some of the damage these horrendous policies have done to American society.
The Fed makes the rich richer, the bottom 50% pay for it via inflation.
The Fed’s policies are designed to create asset price inflation. Asset holders get richer. That’s the purpose. The more they have, the more they get from this asset price inflation.
The bottom 50% have nearly nothing in terms of assets – for example, they held on average only $4,077 in stocks per household in Q3 – and they get shafted. This has been the case for decades, but during the pandemic, the Fed embarked on a historic money printing binge, and the results in terms of this ridiculous wealth disparity are now everywhere.
But for the bottom 50%, this historic money-printing binge has now created the worst inflation in 40 years. Inflation means the dollar loses purchasing power. But for the bottom 50%, their labor, which is denominated in dollars, loses purchasing power in terms of housing, food, cars, etc. And so the bottom 50% get to tighten their belt to pay for the Wealth Effect.
STAY INFORMED! Receive our Weekly Recap of thought provoking articles, podcasts, and radio delivered to your inbox for FREE! Sign up here for the HoweStreet.com Weekly Recap.
Wolf Richter December 27th, 2021
Posted In: Wolf Street