ALWAYS CONSULT YOUR INVESTMENT PROFESSIONAL BEFORE MAKING ANY INVESTMENT DECISION

July 10, 2025 | Market Pulse – July 10/25

Martin Straith


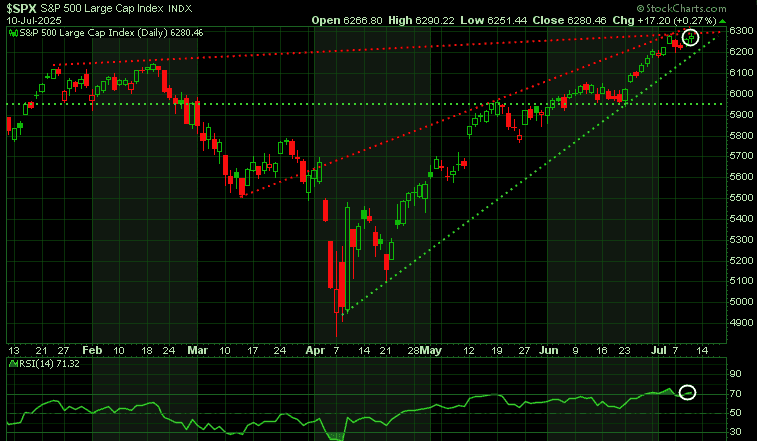
Stocks were up slightly on Thursday, with the S&P 500 up 17.20 (0.27%)
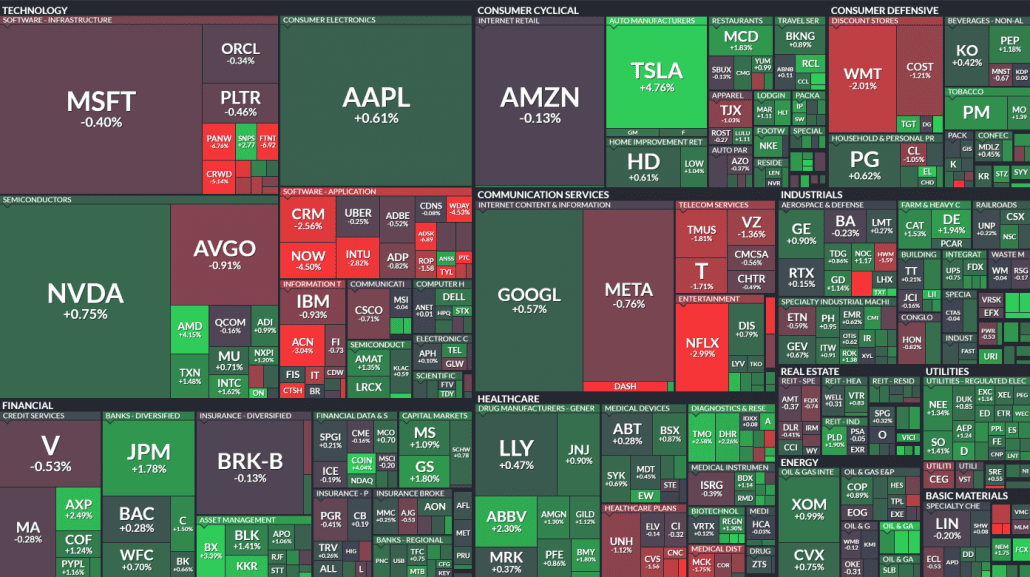
Heatmap of S&P 500
The S&P 500 is currently approaching a critical zone where two major resistance levels (red lines) are converging. This area could act as a strong ceiling for further gains. On the downside, initial support lies along the lower boundary of the wedge pattern (green line), now around the 6200 level. Key support sits at 5940 (horizontal green line).
At the bottom of the chart, the Relative Strength Index (RSI) is above 70, signaling that the S&P 500 is in overbought territory and may be due for a pullback.
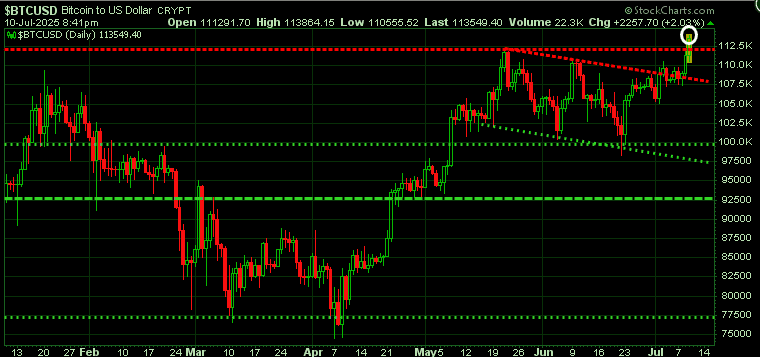
Bitcoin surged to a new all-time high today, topping $113,833 before easing back slightly. With this breakout, the previous high of $111,970 now becomes the first key support level. If that fails to hold, the next critical level to watch is $107,000, followed by major support at $100,000.
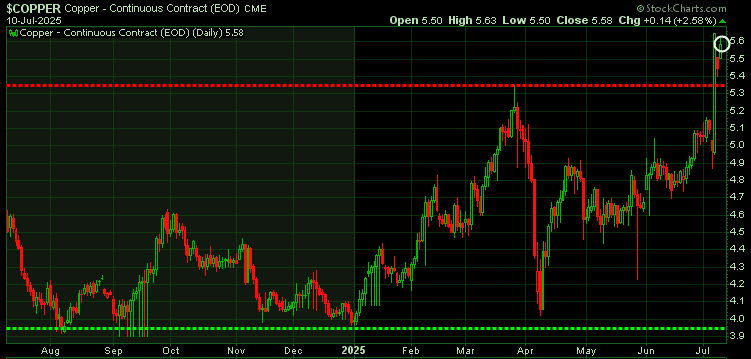
Copper supplies were already constrained by limited investment in new mining projects, production cuts at key sites, and refining disruptions. Now, the situation has worsened with Trump threatening a 50% tariff on copper imports. Adding to the pressure is a weakening US dollar.
Nvidia has hit another record high, becoming the first company to reach a staggering $4 trillion market cap. However, the Relative Strength Index (RSI) at the bottom of the chart indicates the stock is now in overbought territory.
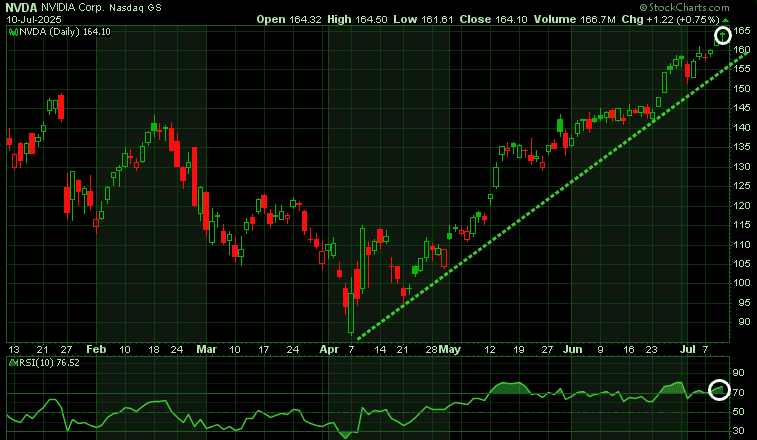
A fun fact: back in 2009, Nvidia’s market cap was $5 billion, while Intel’s was $90 billion, making Intel more than 18 times larger at the time. Fast forward to 2025, and the picture has completely reversed:
- Nvidia now has a market cap of $4 trillion
- Intel is valued at $102 billion
Nvidia is now nearly 40 times larger than Intel by market value—a remarkable reversal from 2009 when Intel dominated the semiconductor industry.
Meanwhile, the $US has been in a steep decline, falling over 12% since January. Last week, we noted it was oversold. As shown in the chart below, the dollar is now attempting to break above its downtrend line.
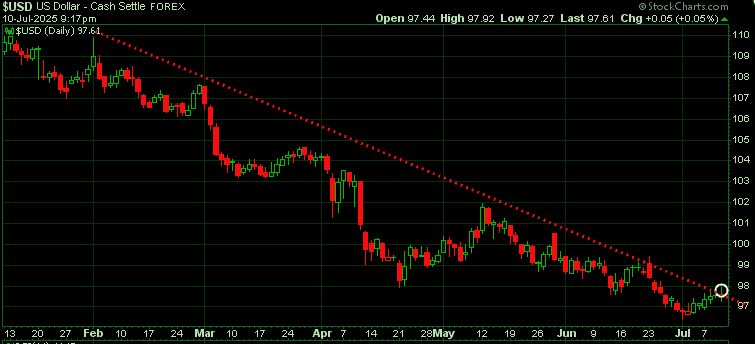
The sharp decline in the $US has provided a significant boost to commodities and precious metals in recent months. However, a key question remains: if the dollar were to rebound and approach the 100 level on the index, would assets like gold, silver, and platinum experience a sell-off?
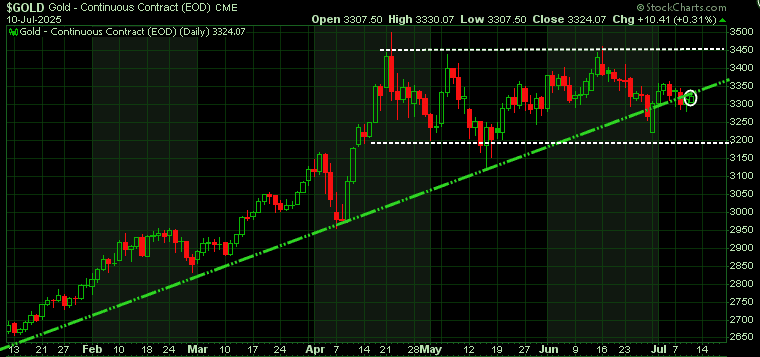
Looking at gold, the chart shows it has been consolidating for the past three to four months, even as the dollar has weakened. Normally, a falling dollar would result in a strong rally in gold, but that hasn’t happened this time. The typical inverse relationship between gold and the dollar has not played out so far this year.
On the chart we can see that gold is testing its uptrend line and if it falls below that, it could trigger a further decline. Long-term we are very bullish gold, but near-term, there may be a better buying opportunity developing.
Stay tuned!
Martin
STAY INFORMED! Receive our Weekly Recap of thought provoking articles, podcasts, and radio delivered to your inbox for FREE! Sign up here for the HoweStreet.com Weekly Recap.
Martin Straith July 10th, 2025
Posted In: The Trend Letter