ALWAYS CONSULT YOUR INVESTMENT PROFESSIONAL BEFORE MAKING ANY INVESTMENT DECISION

April 25, 2026 | Trading Desk Notes for April 25, 2026

Victor Adair


The S&P and Nasdaq surge to new record highs
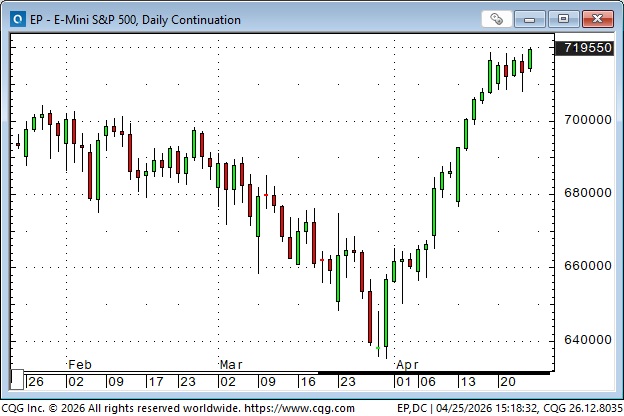
S&P futures fell ~10% from January’s record highs to March lows. The market turned higher on March 31 and is up ~13.5% at Friday’s close, a new record high.
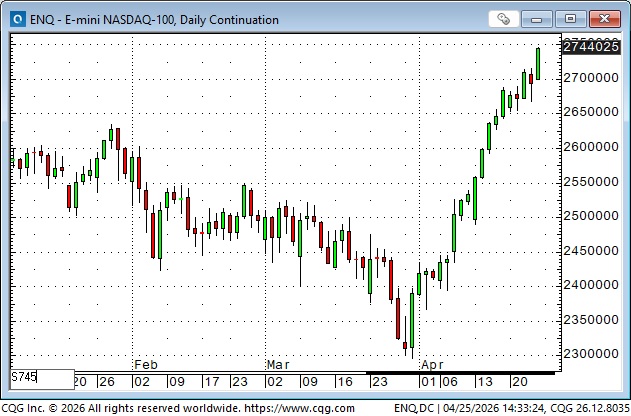
Nasdaq futures fell ~13% to March lows and rallied back ~15% to Friday’s close, a new record high.
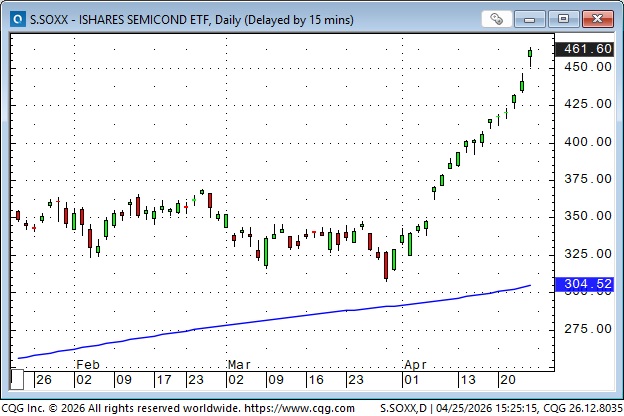
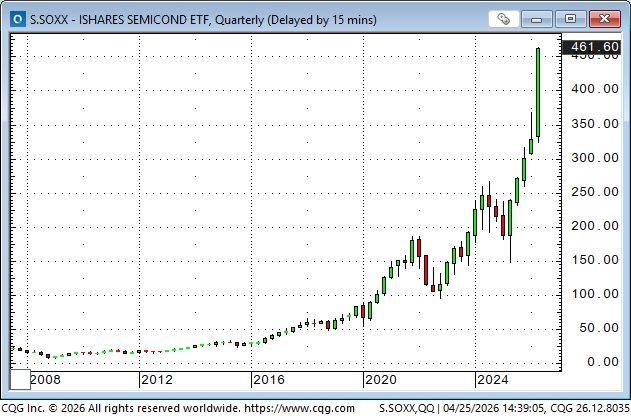
Semiconductors have replaced energy as the strongest market sector. The SOXX has closed higher for (an unprecedented) 18 consecutive trading sessions, up ~50% from the March lows to a record high. Semis vs their 200DMA are the most overbought since 2000.
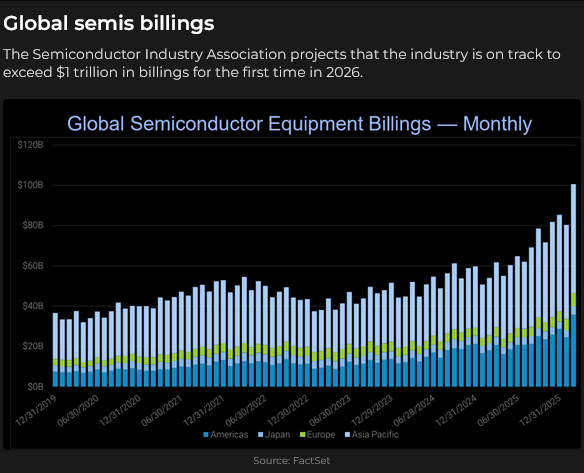
Global Semis billings have surged (Peter Boockvar suggests people may have been buying more than they needed “in case” of a future shortage due to the Iran war).
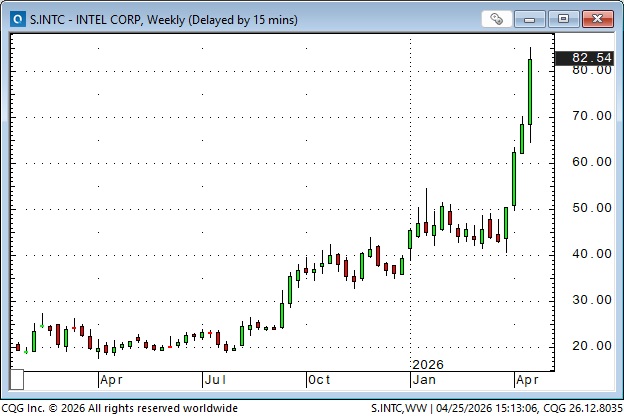
Intel rallied to record highs this week (topping the 2000 highs), up 4X from year-ago levels, up over 100% from the March lows.
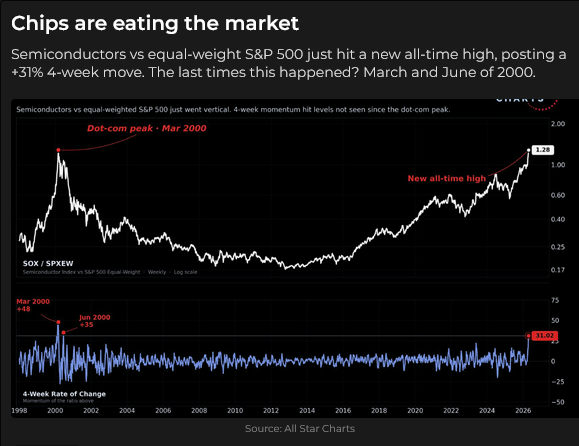
Semiconductors Vs. equal-weight S&P are at a record high.
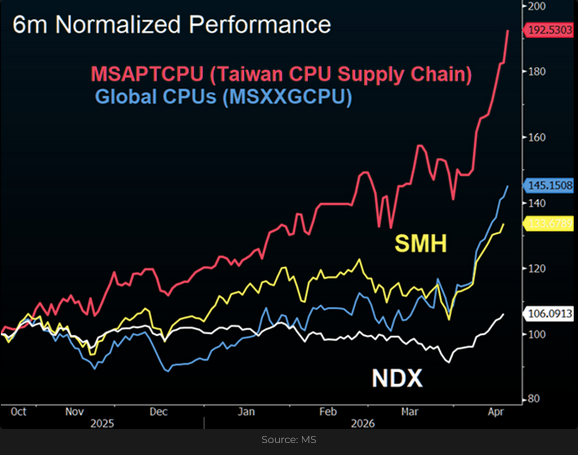
Taiwan is smoking hot. (SMH is VanEck semi ETF).
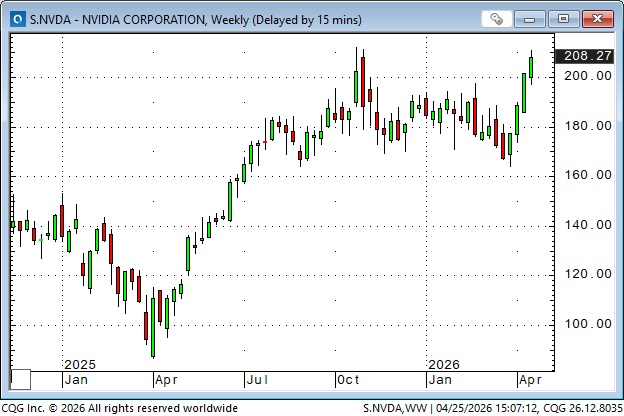
NVDA, with a record high weekly close, has a market cap of >$5 Trillion. The top five stocks (NVDA, AAPL, GOOG, MSFT and AMZN) total >$20 Trillion.
How can the stock market be surging to record highs while the US is at war with Iran?
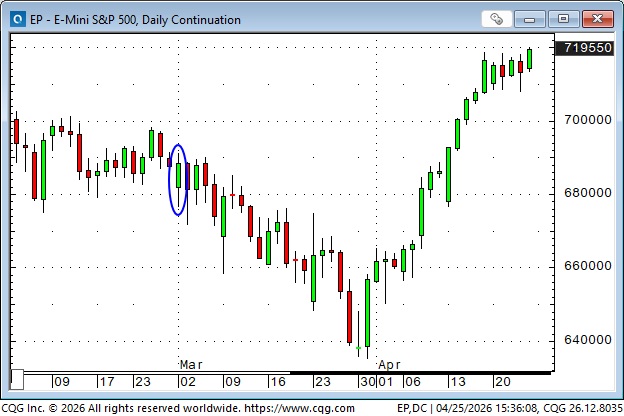
On March 2 (blue ellipse), the first trading day after the US and Israel attacked Iran, stocks gapped down from the previous Friday, but then rallied to close above Friday’s close. It looked like the market expected the fighting would be over in a few days, just like it was in June 2025.
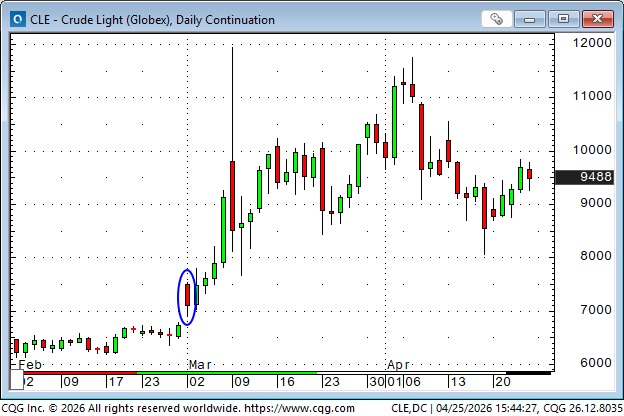
WTI futures prices gapped higher on March 2 (blue ellipse), but then fell back to close near the lows of the day, another sign that the market was expecting a brief conflict.
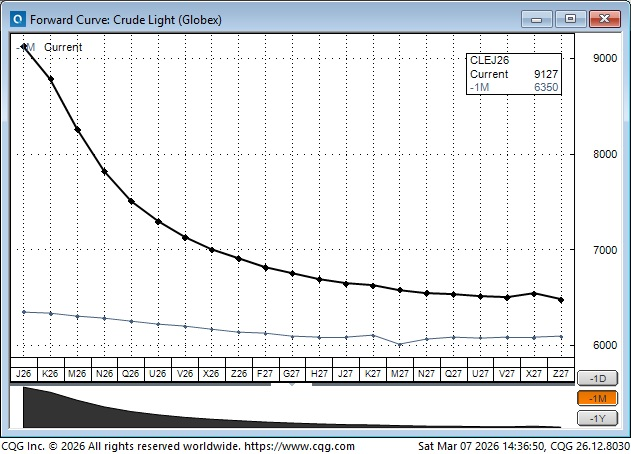
Another sign that the market expected the fighting to end quickly was that nearby WTI futures rose sharply, while deferred contracts rose only slightly. In the March 7 Trading Desk Notes, I wrote:
“Here’s how the forward curve is priced: Friday’s close is the strong black line, and the other line is what the curve looked like a month ago. That is a “wild” steepening of the curve in response to the Iran conflict.“
As the conflict continued into March, the S&P trended lower and crude oil prices (futures and physical) trended higher. The strong rally off the lows on March 31 may have been in anticipation of a “winding down” of kinetic activities, month and quarter-end rebalancing, and short-covering. It may also have reflected the idea that the market was oversold, given the diminished impact of the “energy shock” on the US economy. (Now that the US is a net energy exporter, an “energy shock” has less impact on the economy than it had back when the US was a net energy importer.)
Whatever inspired the “turn higher” from the lows, once the equity market began to rally, short covering turned into a squeeze, which became a BTD FOMO stampede. As far as the Iran war was concerned, the mood in the equity market seemed to be, “the fighting has stopped, negotiations will get Hormuz open soon, the war doesn’t matter – look at those earnings!”
The oil market has not been as sanguine as the equity market about the impact of the Iran war
Brent crude futures reached highs near $120 in March, their highest since the Russian invasion of Ukraine, more than double their January lows, and closed this week near $106.
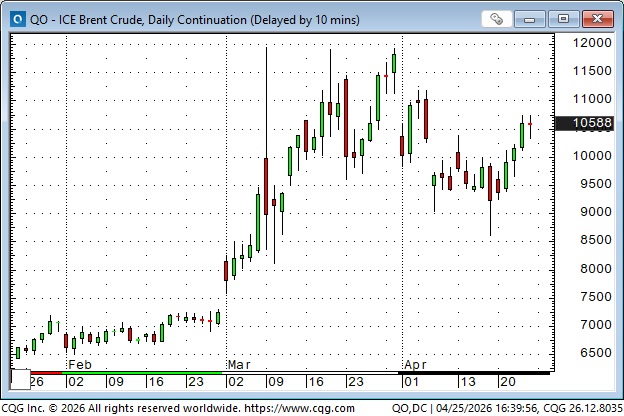
In effect, the oil market is saying, “Inventories are shrinking fast, demand destruction is happening globally, rationing is real, and the longer the Hormuz is blocked, the more intense the pressure will be on the physical market. The Mexican standoff between the US and Iran is a serious problem.”
American energy exceptionalism
US exports of crude oil and products reached ~13 mbd this week. The average over the past year has been ~11 mbd.
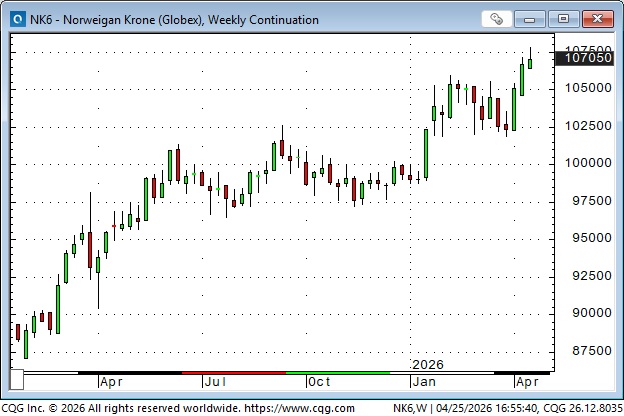
Currencies
The strongest currency in April looks to be the Norwegian Krone. Norway produces nearly 2 mbd and exports ~70% of that to other European countries. This chart is the NOK-to-USD rate.
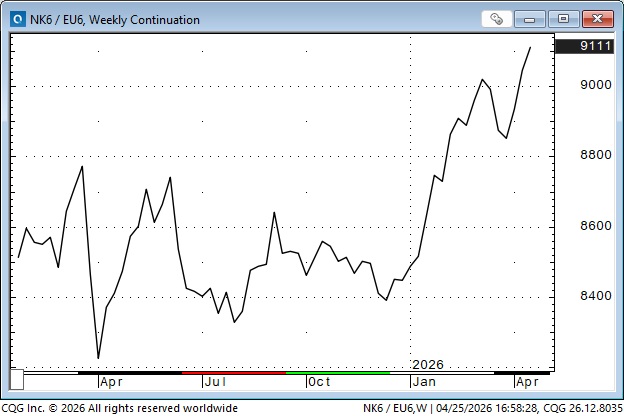
This chart is the NOK relative to the EUR:
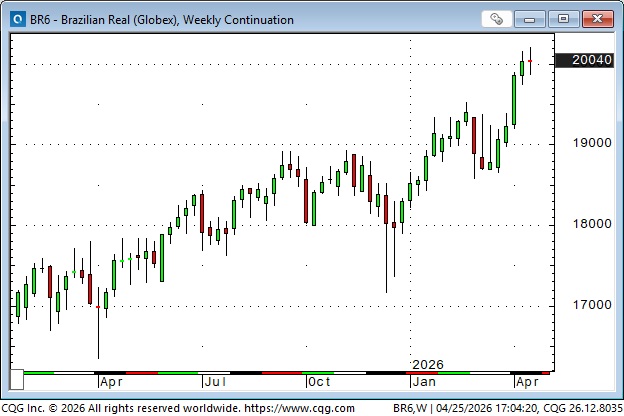
The Brazilian currency is also on a roll. Brazil’s crude oil production is ~4 mbd (#8 in the world rankings), and it exports ~2.5 mbd, with ~65% of that going to China.
Canada is the world’s #4 crude oil producer at just over 5 mbd, with ~80% of that (~4 mbd) exported. However, the CAD has not significantly benefited from its status as a “petrocurrency.” Can you imagine where the CAD would be if we didn’t have strong crude and natural gas production/exports?

Nothing says, “Thank you, Justin Trudeau,” as much as this chart.
Warsh to the rescue
Kevin Warsh looks set to become the new Federal Reserve Chairman when Powell’s term ends in the middle of May. Judging by his Congressional testimony, he thinks the Fed needs to change its methods and objectives. It’s interesting to see how little “media coverage” Warsh is getting compared to a couple of years ago, when it was “all about the Fed.”

On my radar
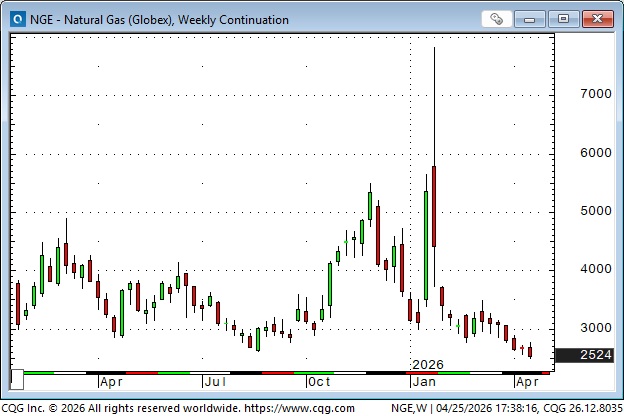
Is North American natural gas a buy?
With Natgas prices much higher in Europe and Asia, Qatar effectively offline, natgas cheap vs crude oil on an energy-equivalent basis, the world looking for cleaner-burning fuels, and the US looking to double LNG exports over the next five years, is North American natgas a buy?
My short-term trading
I started this week short the S&P, a position I established near last Friday’s highs. The market gapped 70 points lower on the Sunday opening, but then began to rally, so I closed the trade for a 30-point gain.
I shorted the S&P two more times during the week, and was modestly ahead both times, but I closed both trades for tiny losses, leaving my P+L flat on the week.
The “pace” of gains in the S&P since late March certainly slowed this week, and I was comfortable probing the short side, thinking the equity market was “overbought” and was “overlooking” the problems yet to come from the Iran war. I was flat going into the weekend.
Quotes
April 13, 2026
“If you stay 100% technical, you will quickly see that news does not matter 95% of the time. It’s all about how markets act at “decision points,” such as support and resistance levels.
Linda Raschke, Market Wizard
April 22, 2026
“The oil majors are nothing if not deflationary machines.”
April 23, 2026
When physical availability tightens, price becomes a rationing tool, not a valuation signal.
Videos
Why Traders Lose – A great 8-minute video by Jason Shapiro, Market Wizard
When I worked at ContiCommodity in the late 1970s/early 1980s, we had thousands of retail clients, and we confirmed the industry stories that ~90% of retail traders lost money over time. The reasons are as old as the hills, but Jason delivers a strong, clear, up-to-date message on what not to do.
The Barney report
Spring temperatures are welcome here in the Pacific Northwest, and Barney and I are truly enjoying our long mid-day walks. Barney will be five years old in September, but he still has a lot of puppy in him. He loves chewing on a good stick, the bigger, the better.

Listen to Mike Campbell and me discuss markets
In today’s Moneytalks show, Mike and I focused on the “correlation breakdown” between the stock market and the oil market. We also discussed the Mexican Standoff between the US and Iran and how it may weigh on markets that expect a quick end to the war. You can listen to the entire show here. My spot with Mike starts around the 60-minute mark. Don’t miss Mike’s interview with market veteran Peter Grandich.
Listen to Jim Goddard and me discuss markets
I taped my monthly 30-minute interview with Jim Goddard on the This Week In Money show on Friday. We discussed the “mixed messages” coming from the markets, with stocks soaring while crude oil prices remain high. We also discussed what’s driving the equity rally, the key issues in the oil market, why the precious metals and currencies are so quiet, and what to expect from the new Fed Chairman. You can listen to the show here.
The Archive
Readers can access any of the weekly Trading Desk Notes from the past six years by clicking here.
Subscribe: You have free access to everything on this site. Subscribers receive an email alert when I post new content, typically four to six times a month.
Victor Adair retired from the Canadian brokerage business in 2020 after 44 years and is no longer licensed to provide investment advice. Nothing on this website is investment advice for anyone about anything.
STAY INFORMED! Receive our Weekly Recap of thought provoking articles, podcasts, and radio delivered to your inbox for FREE! Sign up here for the HoweStreet.com Weekly Recap.
Victor Adair April 25th, 2026
Posted In: Victor Adair Blog