Howestreet.com - the source for market opinions

ALWAYS CONSULT YOUR INVESTMENT PROFESSIONAL BEFORE MAKING ANY INVESTMENT DECISION

May 6, 2023 | Six Consecutive Withdrawals From SLV

"Ed wrote the daily precious metal commentary for Casey Research starting in 2008. His stand-alone column became their most highly-rated blog [either free or paid] almost from the outset—and remained that way until he started his own subscription-based website in June of 2015."

06 May 2023 – Saturday

Yesterday in Gold, Silver, Platinum and Palladium

The gold price wandered quietly sideways until around 12:30 p.m. China Standard Time in GLOBEX trading on their Friday afternoon — and from there it was sold quietly lower until the the commercial traders of whatever stripe pulled their bids when the jobs report was released at 8:30 a.m. in New York. Its low tick was set at, or minutes after, the 10 a.m. EDT afternoon gold fix in London — and its ensuing rally ran into ‘something’ around 12:45 p.m.  It then traded quietly sideways to a bit higher until the market closed at 5:00 p.m. EDT.

The high and low ticks in gold were recorded as $2,061.30 and $2,007.00 in the June contract. The June/August price spread differential in gold at the close in New York yesterday was $19.40…August/October was $19.00 — and October/December was $18.20 an ounce.

Gold was closed on Friday afternoon in New York at $2,017.60 spot, down $32.70 from Thursday — but around $35 dollars off its Kitco-recorded low tick. Net volume was very heavy at a bit under 228,000 contracts — and there were around 55,500 contracts worth of roll-over/switch volume out of June and into future months…mostly August and December, but with decent amounts into October, plus February of next year.

230506gold image
The silver price wandered quietly sideways until a few minutes after GLOBEX trading commenced in London — and from that juncture it was sold quietly and a bit unevenly lower until 8:30 a.m. in New York when ‘da boyz’ showed up in it as well. The engineered price decline in it was even more brutal than it was in gold — and its low tick was also set at the same instant as gold’s…minutes after 10 a.m. in COMEX trading in New York. Its spirited rally from there also ran into ‘something’ around 12:45 p.m. EDT — and after a brief dip, continued to creep higher until the market closed at 5:00 p.m. EDT.

The high and low ticks in silver were reported by the CME Group as $26.435 and $25.41 in the July contract. The May/July price spread differential in silver at the close in New York yesterday was 19.7 cents…July/September was 21.4 cents — and September/December was 32.9 cents an ounce.

Silver was closed in New York on Friday afternoon at $25.67 spot, down 34.5 cents from Thursday…but 56 cents off its Kitco-recorded low tick. Net volume was a bit on the heavier side at 64,500 contracts — and there were just about 4,100 contracts worth of roll-over/switch volume in this precious metal…mostly into September and December…but with a bit into March of the New Year as well.

230506silver image
The platinum price crawled quietly higher until shortly before 1 p.m. China Standard Time in GLOBEX trading on their Friday afternoon — and from that point it was sold lower until its low tick of the day was set around 12:20 p.m. CEST in Zurich. It took two rather broad steps higher from there, before running into ‘something’ minutes after 12 o’clock noon in New York — and it didn’t do much of anything after that. Platinum was closed at $1,060 spot, up 18 bucks from Thursday.
230506plati image
Palladium rallied a bit until noon CST in GLOBEX trading — and was then sold quietly lower until around 10:30 a.m. in GLOBEX trading in Zurich. It rallied unevenly higher from that point until it ran into ‘something’ minutes after 1 p.m. in COMEX trading in New York. From that juncture it was sold very quietly lower until the market closed at 5:00 p.m. EDT. Palladium was closed at $1,417 spot, up 40 dollars on the day — and would have obviously closed much higher than that, if allowed.
230506plad image
Based on the kitco.com spot closing prices in silver and gold posted above, the gold/silver ratio worked out to 78.6 to 1 on Friday…compared to 78.8 to 1 on Thursday.

And here’s Nick’s 1-year Gold/Silver Ratio chart, updated with the past week’s data and, as always yesterday’s data point of 78.6 to 1 is not on it for whatever reason. Click to enlarge.

230506-1-year-GSR image
The dollar index closed very late on Thursday afternoon in New York at 101.40 — and then opened lower by 6 basis points once trading commenced at 7:45 p.m. EDT on Thursday evening, which was 7:45 a.m. China Standard Time on their Friday morning. It ticked a bit higher right away — and then wandered quietly lower until exactly 8:00 a.m. BST…the London open. It then crept quietly higher until a minute before the jobs report hit the tape in New York — and blasted higher from there. That rally ended abruptly around 8:46 a.m. EDT — and from there it was sold unevenly lower until around 12:56 p.m. From that juncture it wandered a bit unevenly higher until minutes before 4 p.m. — and didn’t do a thing after that.

The dollar index finished the Friday trading session in New York at 101.21…down 19 basis points from Thursday — and 7 basis points below its indicated close on the DXY chart below.

Here’s the DXY chart for Friday, thanks to marketwatch.com as always.  Click to enlarge.

230506DXY image
And here’s the 5-year U.S. dollar index chart that appears in this spot every Saturday, courtesy of stockcharts.com as always. The delta between its close…101.00…and the close on the DXY chart above, was 21 basis points below its spot close. Click to enlarge.
230506-5-year-USD image
One could certainly make a case that the currencies and gold and silver prices we’re correlated, except for the fact that the commercial traders used that tiny DXY ‘rally’ at 8:30 as a fig leaf to beat the living snot out of silver and gold prices, as the engineered price declines in them were out of all proportion to that so-called dollar index ‘rally’.

U.S. 10-Year Treasury: 3.4460%…up 0.0950 (+2.83%)…as of 02:59 p.m. EDT

And here’s the 5-year 10-year U.S. Treasury chart from the yahoo.com Internet site — which puts the yield curve into a somewhat longer-term perspective. Click to enlarge.

230506-5-year-10-year image
Like everything else these days, the powers-that-be are everywhere…including controlling the yield curves in U.S. Treasuries — and they were certainly buying everything in sight in that market during this past week every time it became necessary.
The gold stocks gapped down big at the 9:30 opens in New York on Friday morning — and their respective low ticks were set at gold’s low tick…minutes after 10 a.m. EDT. From that point they made an astonishing recovery, touching unchanged around 12:50 p.m. From there they wandered quietly and a bit unevenly lower until the markets closed at 4:00 p.m. The HUI finished down only 0.64 percent.
230506HUI image
Computed manually, the new Silver Sentiment/Silver 12 Index closed lower by only 0.15 percent.

Here’s Nick’s old 1-year Silver Sentiment/Silver 7 Index chart, updated with Friday’s candle. Click to enlarge.

230506-1-year-Silver-7 image
The two stars yesterday were Silvercrest Metals and SSR Mining, as they closed up 1.61 and 1.60 percent respectively. The biggest under performer was Aya Gold & Silver, as they closed down 2.15 percent.

I suspect that the gap down at the opens in the precious metal shares was mostly margin selling, but the buyers that appeared at the lows in both silver and gold were the strongest of hands. It was only the intervention by the commercial traders in the prices of both that prevented the precious metal stocks from closing in the green. As it was, half of the silver equities closed up on the day anyway. It was about the same for stocks in the HUI as well.

Considering how badly the underlying precious metals got beaten up…one has to greatly encouraged by the price action in the precious metal shares on Friday.

The reddit.com/ Wallstreetsilver website is still going, sort of — and the link to it is here. The link to two other silver forums are here — and here.

Here are two of the usual three charts that show up in every weekend missive. They show the changes in gold, silver, platinum and palladium in both percent and dollar and cents terms, as of their Friday closes in New York — along with the changes in the HUI and the old Silver 7 Index.

Here’s the weekly chart, which does double-duty as the month-to-date chart for this week only — and the gold stocks handily outperformed the silver equities…a fact that you already know. Click to enlarge.

230506Weekly image
Here’s the year-to-date chart — and it looks strikingly similar to the week/month-to-date chart above, with the everything gold-related also handily outperforming everything silver related. Of course if silver was about to break above its old high of $50 the ounce…like gold is trying to break above its old high of around $2,080…it’s a lead-pipe cinch that the silver equities would be blowing the doors off off their golden cousins. Click to enlarge.
230506year-to-date image
What we need now is a major break-out in the prices of both silver and gold. When that’s finally allowed to happen, institutional investors will start to increase their weightings in the precious metals — and that will fix a lot of ills. It’s only the Big 4/8 commercial shorts that are standing in the way of such an event.
The CME Daily Delivery Report for Day 7 of May deliveries showed that 42 gold — and 33 silver contracts were posted for delivery within the COMEX-approved depositories on Tuesday.

In gold, there were three short/issuers in total, with the largest being Citigroup once again, issuing 34 contracts out of their house account once more. There were five long/stoppers in total — and the two biggest were JPMorgan and ADM, as they picked up 27 and 9 contracts for their respective client accounts.

In silver, the two largest of the four short/issuers in total were Canada’s Scotia Capital and Wells Fargo Securities, as they issued 18 and 10 contracts out of their respective house accounts. And of the five long/stoppers in total, the biggest was JPMorgan of course, as they stopped 23 contracts for their ‘client’ account.

The link to yesterday’s Issuers and Stoppers Report is here.

So far in May, there have been a rather astounding 5,186 gold contracts issued/reissued and stopped — and that number in silver is only 1,863 COMEX contracts. There have been no platinum or palladium contracts issued so far this month.

The CME Preliminary Report for the Friday trading session showed that gold open interest in May dropped by 610 COMEX contracts, leaving 213 still around, minus the 42 contracts mentioned a few paragraphs ago. Thursday’s Daily Delivery Report showed that 649 gold contracts were actually posted for delivery today, so that means that 649-610=39 more gold contracts were added to May deliveries. Silver o.i. in May fell by 122 contracts, leaving 700 still open, minus the 33 contracts mentioned a few paragraphs ago. Thursday’s Daily Delivery Report showed that 117 silver contracts were posted for delivery on Monday, so that means that 122-117=5 silver contracts vanished from the May delivery month.

Total gold open interest at the close on Friday fell by 9,864 contracts… but I suspect that it was far more than that. The true number is hidden by the amount of uneconomical and market-neutral spread trades that were most likely put on yesterday. Total silver o.i. declined by only 2,406 contracts, which I found rather disappointing, considering how brutally it got worked over by ‘da boyz’. Both numbers are subject to some revision by the time the final figures are posted on the CME’s website later on Monday morning CDT.

There was another addition to GLD yesterday, the third in a row, as an authorized participant added 55,747 troy ounces of gold. There were also 13,892 troy ounces of gold add to GLDM. And for the sixth time in a row, there was another withdrawal from SLV, as an a.p. removed 1,194,112 troy ounces of silver.

Since that 7.95 million ounces was added to SLV back on Monday, April 24…there have been six withdrawals totalling 6.57 million troy ounces — and I’m sure Ted will have something to say about this in his weekly review this afternoon.

In other gold and silver ETFs and mutual funds on Planet Earth on Friday, net of any changes in COMEX, GLD, GLDM and SLV inventories…there were a net 65,693 troy ounces of gold added — and I’ll point out that this number would have been far higher if not for the 114,281 troy ounces of gold that left Deutsche Bank. In silver, there were 404,772 troy ounces withdrawn …with the bulk of that amount….280,358 troy ounces…leaving Deutsche Bank as well.

And still no sales report from the U.S. Mint for May so far — and still nothing from the Royal Canadian Mint regarding Q4/2022 mint sales, or their 2022 Annual Report.

There was very little activity in gold over at the COMEX-approved depositories on the U.S. east coast on Thursday. Nothing was reported received — and only 9,683 troy ounces were shipped out…5,887 troy ounces from HSBC USA — and the remaining 3,795 troy ounces left Manfra, Tordella & Brookes, Inc.

There was some paper activity, as 12,365 troy ounces were transferred from the Eligible category and into Registered over at Manfra, Tordella & Brookes, Inc. — and the remaining 12,057 troy ounces made the trip in the opposite direction, from Registered back into Eligible over at JPMorgan’s ‘Enhanced Delivery’ sub-depository.

The link to Thursday’s COMEX activity in gold, is here.

There was some activity in silver, as one truckload…600,382 troy ounces… were received — and that load ended up at Loomis International. There were 138,240 troy ounces shipped out. The largest ‘out’ amount were the 101,844 troy ounces that departed CNT — and the remaining 20,683 and 15,712 troy ounces left Manfra, Tordella & Brookes, Inc. and Brink’s, Inc. respectively.

There was some paper activity, as 323,570 troy ounces were transferred from the Eligible category and into Registered over at Manfra, Tordella & Brookes, Inc…no doubt scheduled for immediate delivery.

The link to Thursday’s COMEX silver activity is here.

There was no in/out activity over at the COMEX-approved gold kilobar depositories in Hong Kong on their Thursday, as I believe they were closed for the Labour Day Holiday.

Here are the usual 20-year charts that show up in this space in every Saturday column. They show the total amounts of physical gold and silver held in all know depositories, ETFs and mutual funds as of the close of business on Thursday.

During the week just past, there were a net 486,000 troy ounces of gold added — but a net 3.852 troy ounces of silver were were withdrawn — and that’s all because of the withdrawals from SLV this week. Click to enlarge for both.

230506Chart-2 image
230506Chart-3 image
According to Nick Laird’s data on his website, there have been a net 1.104 million troy ounces of gold added — but a net 8.427 million troy ounces of silver has been removed from all the world’s known depositories, mutual funds and ETFs during the last four weeks.

In gold, the largest ‘in’ amount were the 714,000 troy ounces added to the COMEX, mostly into JPMorgan…followed by the 185,000 troy ounces added to Source/SGLD. Next were the 169,000 troy ounces added to iShares/IAU. The largest ‘out’ amount were the 177,000 troy ounces that left Deutsche Bank. Over half of all gold depositories now show withdrawals. A month ago, almost all were showing additions.

In silver, the only two depositories/ETFs showing net deposits over the last four weeks were iShares/SVR and SIVR, with 1.586 million and 246,000 troy ounces added respectively. The biggest ‘out’ amount by far was in COMEX inventories, down a hefty 5.050 million troy ounces. Next were the 2.903 million troy ounces of of SLV. After them were the 697,000 and 692,000 troy ounces that departed ZKB and BullionVault respectively.

Retail bullion sales have dropped off quite a bit from the rush of a month or so ago, but remain slightly elevated. The mints, both sovereign and private, are still going full full blast catching up on back orders — and nobody has a complete inventory of items they normally carry.

The physical shortage in silver at the wholesale level continues unabated — and how much silver is left in these depositories that is available for sale at current prices is something that Ted has been going on about for a long while now — and he’s of the opinion that there isn’t a lot. Whatever that number is, we’re getting closer to it with each passing week…although it certainly appears that JPMorgan is providing silver to some ETFs and mutual funds as required. This is particularly true of the silver being provided to cover the short position in SLV.

The vast majority of precious metals being held in these depositories are by those who won’t be selling until the silver price is many multiples of what it is today. That’s particularly true of shareholders in PSLV.

Not only is there an obvious shortage in wholesale silver, but the fact that central bank gold demand exploded to 1,136 tonnes last year, means that there’s a lot less gold in good delivery form around too. That amount, plus the 551 tonnes that was reported being held by Russia’s sovereign wealth fund a month or so ago, most likely means that the wholesale physical market in gold is getting tight as well. It’s a good bet that it’s gotten a lot tighter in the last month because of the banking crisis — and that fact has already appeared during the April delivery month — and now in May as well. It has also shown up in the U.S. Mint’s gold bullion coin sales in both March and April.

Turkey’s purchases of 68+ tonnes in January, another 57+ tonnes in February, plus 21+ tonnes in March, is an indication that the central banks of the world are still at it. However, the World Gold Council did report that there wasn’t much gold buying by central banks in April. China imported a lot of gold in March…close to a record amount…plus a very decent amount of silver as well.

Turkey’s silver imports in March were a record high 123.2 tonnes…3.96 million troy ounces — and they’re on course for record imports in both silver and gold this year if they keep at it they way they have during the first quarter of this year. I’m hoping we’ll get their gold and silver import numbers for April sometime during the coming week.

And as you’re more than aware, this extraordinary demand in both of these precious metals has not yet been allowed to manifest itself in their respective prices. The Big 4/8 commercial shorts still have them in their iron grip — and that fact was on full display yesterday.

As you’re also already aware, the short position in SLV imploded down to 16.27 million shares as of this past Tuesday’s short report — and Ted is of the opinion that the almost 8 million troy ounces that was deposited into SLV on Monday, April 24 was also being used to cover more of what’s left of that short position. However, whether that’s the case or not, won’t be known until we see the next short report on Tuesday, May 9.

These large amounts of silver are coming from the stockpiles of JPMorgan & Friends — and Ted is of the opinion that the silver is being leased to whoever is covering their short position in SLV — and will have to be returned some day. Whatever day that is, silver will be many multiples of the price it is now.

Then there’s that other little matter of the 1-billion ounce short position in silver held by Bank of America…with JPMorgan & Friends on the long side. Ted says it hasn’t gone away — and he’s also come to the conclusion that they’re short around 25 million ounces of gold with these same parties as well…which I point out elsewhere in this column.

The Commitment of Traders Report, for positions held at the close of COMEX trading on Tuesday, May 2, showed increases in the commercial net short positions in both silver and gold…but not as nearly as bad as feared.

In silver, the Commercial net short position increased by 3,651 COMEX contracts, or 18.26 million troy ounces…but the majority of that increase was due to Ted’s raptor selling long positions, which has the mathematical effect of increasing the Commercial net short position.

They arrived at that number by reducing their long position by 4,544 contracts — and also reduced their short position by 893 COMEX contracts. It’s the difference between those two numbers that represents their change for the reporting week.

Under the hood in the Disaggregated COT Report, the Managed Money and Nonreportable/small traders were the buyers during the reporting week, as the former increased their net long position by 1,542 COMEX contracts — and the latter did the same to the tune of 2,302 contracts. The Other Reportables were net sellers by a smallish 193 contracts.

Doing the math: 1,542 plus 2,302 minus 193 equals 3,651 COMEX contracts, the change in the Commercial net short position…which it must do.

The Commercial net short position in silver now stands at 45,174 COMEX contracts…up those 3,651 COMEX contracts mentioned above…from the 41,523 contracts that they were short in the April 28 COT Report.

The Big 4 shorts increased their short position for the fourth week in a row, from 36,375 contracts, up to 37,487 contracts, an increase of 1,112 contracts — and I’m sure that all of that increase came on the last day of the reporting week [Tuesday] when the silver price jumped up a whole bunch.

The ‘5 through 8’ big shorts decreased their short position for the second week in a row, them by 595 contracts — and are currently short 23,804 COMEX contracts, which is still bullish on an historical basis.

That Managed Money trader is still firmly ensconced in the Big 4 category… most likely at the bottom end of it in 4th spot, holding somewhere between 8 and 9,000 contracts short. Ted said that their position didn’t change at all during the reporting week…born out by the fact that the gross Managed Money short position only rose by 56 contracts during the reporting week.

The Big 8 shorts in total increased their net short position from 60,774 contracts, up to to 61,291 COMEX contracts week-over-week. But you have to subtract out the short position of that Managed Money trader, so the Big 8 commercial short position, in reality, is around 53,000 contracts…which is a very low number.

And because there’s now a Managed Money trader contaminating the Big 8 commercial category, it’s not possible to calculate the long position that Ted’s raptors hold with complete accuracy…but it appears that they sold around 3,100 contracts during this reporting week which, as I pointed out earlier, had the mathematical effect of increasing the Commercial net short position — and one of the big reasons why the commercial net short position rose the amount that it did. The raptors are down to a long position of only about 8,000 contracts…which is a low number for them. How much more of their remaining long position they sold on Wednesday and Thursday won’t be known until next Friday’s COT Report.

Don’t forget, that despite their small size, they’re still commercial traders in the commercial category.

Here’s Nick’s 3-year COT Report for silver, updated with the above data.  Click to enlarge.

230506COT-silver image
The Big 8 were short 67,831 COMEX contracts about seven months ago — and the Big 4 were short 43,556 COMEX contracts at that time. As of yesterday’s COT Report, that has been whittled down to 37,487 COMEX contracts that the Big 4 are short — and the Big 8 in total is now down to 61,291 contracts.

And the current Big 8 short number is only that large now because there’s that Managed Money trader in it holding 8 to 9,000 contracts short — and that has to be subtracted out to get the true picture.

As I’ve been pointing out for weeks now, Ted and I are both amazed that even though we’re barely off the high tick in silver during the current rally, that there’s already a Managed Money trader with a big enough short position to be in the Big 4 category. They normally only get heavily short once we’re below all the moving averages — and we’re still light years away from any one of them that matters at the moment.

Why on earth would a Managed Money trader go short so aggressively at this price level, is anyone guess. We’re still scratching our heads over that one.

But the main concern is what has happened since the Tuesday cut-off, as silver was up big on both Wednesday and Thursday — and of course got its lights punched out yesterday. Friday’s engineered price decline in silver on the jobs report has certainly has taken a big chunk out of the increase in the Commercial net short position that occurred on two days prior to that.

But by how much also won’t be known until next Friday’s COT Report — and there are still two business days left in the reporting week.

In gold, the commercial net short position only increased by 5,656 COMEX contracts…565,600 troy ounces of the stuff. I was expecting a bigger number than that — and the only reason it wasn’t, was because Ted’s raptors, the small commercial traders other than the Big 8 shorts, sold 4,411 long contracts…which saved the Big 4/8 shorts of having to go short more.

The commercial traders arrived at that number by adding 2,933 long contracts, but also increased their short position by 8,589 COMEX contracts — and it’s the difference between those two numbers that represents their change for the reporting week.

Under the hood in the Disaggregated COT Report, it was all Managed Money traders, plus a whole bunch more, as they increased their net long position by a chunky 10,987 COMEX contracts. The Other Reportables and Nonreportable/ small traders were both net sellers during the reporting week, which I found rather strange…the former reduced their net long position by 684 contracts — and the latter by a very hefty 4,647 contracts.

Doing the math: 10,987 minus 684 minus 4,647 equals 5,656 COMEX contracts, the change in the commercial net short position.

The commercial net short position in gold now sits at 217,584 COMEX contracts, or 21.758 million troy ounces of the stuff…up those 5,656 contracts from the 211,928 contracts/21.193 million troy ounces they were short in the April 28 COT Report.

The Big 4 shorts increased their net short position from 174,140 contracts, up to 176,288 COMEX contracts…about what it was two weeks ago…and an increase of 2,148 contracts.

The Big ‘5 through 8’ shorts in gold decreased their net short position for the second week in a row, this time by 903 COMEX contracts…from the 58,678 contracts they held short in the April 28 COT Report, down to 57,775 contracts in the current COT Report.

The Big 8 shorts in total increased their net short position from 232,818 COMEX contracts, up to 234,063 contracts…an increase of 1,245 COMEX contracts.

Ted’s raptors, as I mentioned earlier, were also big sellers, as they decreased their long position from 20,890 COMEX contracts…down to 16,479 COMEX contracts…a drop of 4,411 COMEX contracts.

When you add those 4,411 long contract the raptors sold, to the 1,245 COMEX contracts that the Big 8 went short during the reporting week…you end up with 5,656 COMEX contracts…the change in the commercial net short position.

This isn’t rocket science…it’s just math.

Don’t forget that despite their small size — around 13 of them as far as I can tell…Ted’s raptors are still commercial traders in the commercial category.

Here’s Nick Laird’s 3-year COT Report chart for gold, updated with data from this May 5 COT Report. Click to enlarge.

230506COT-gold image
About seven months or so ago, the Big 4 shorts in gold were only short 87,755 COMEX contracts — and the Big 8 in total were short 147,173 COMEX contracts. That’s a far cry from the hefty 176,288 and 234,063 COMEX contracts the Big 4 and 8 commercial traders are short now.

As you can see, the Big 4 shorts have added around 88,500 short contracts since the low of last fall…which is not at all bullish — and they are even more short since the Tuesday cut-off.

But this shorting by the big bullion banks in the West — and yet another ‘in progress’ engineered price decline, certainly reeks of desperation, as the rest of the world’s central banks and governments are buying the stuff hand over fist…especially in light of the ongoing banking crisis, plus the increasing flight from the U.S. dollar.

Since their efforts began a bit over three weeks ago, the Big 4/8 shorts have not had an easy time of it. Since gold’s high close of $2,055 on April 13…’da boyz’ have only managed to peel about 30 bucks off its price as of yesterday’s close.

But at its low tick on Friday, ‘da boyz’ blew it back below its lows of both Wednesday and Thursday, so it appears that, like in silver, they’ve been able to negate a lot of the increase in the commercial net short position that occurred since the Tuesday cut-off for next week’s COT Report.

Ted was relived to see that a goodly portion of the increase in open interest in gold during this past reporting week was spread trade-related…about 12,500 contracts worth — and it’s a certainly that reasonable chunks of the big increase in the total open interest in gold since the Tuesday cut-off were spread traded related as well.

Like in silver, there are still two more business days left in the next reporting week for gold — and it will be interesting to see how well the big shorts do going forward, as both gold and silver came roaring back off their respective low ticks on Friday. They obviously had to be restrained, or would have closed far higher than they were allowed.

In the other metals, the Managed Money traders in palladium increased their net short position by a 638 COMEX contracts — and are now net short palladium by 5,386 contracts. The commercial traders are mega net long palladium in both categories…especially the Swap Dealers. All the other categories are net short. In platinum, the Managed Money traders decreased their net long position by 3,559 contracts — and are now net long platinum by 20,362 COMEX contracts. The Producer/Merchant category is the only category net short platinum at the moment — and they are mega net short to the tune of 32,500 COMEX contracts. Most of the rest of the categories are net long by very decent amounts.

In copper, the Managed Money traders increased their net short position for the second week in a row, this time by 5,186 contracts — and are net short copper by 16,386 COMEX contracts…about 409,000 pounds of the stuff as of the May 5 COT Report…which is not a lot on an historical basis.

Copper continues to be a totally bifurcated market in the commercial category. The Producer/Merchants are still mega net short copper — and the Swap Dealers are still mega net long.

Whether these bifurcated markets mean anything or not, will only be known in the fullness of time. Ted says it doesn’t mean anything as far as he’s concerned, as they’re all commercial traders in the commercial category.

In this vital industrial commodity, the world’s banks…both U.S. and foreign… are net long 12.5 percent of the total open interest in copper in the COMEX futures market in the May Bank Participation Report, which came out yesterday…up a small amount from the 12.0 percent they were net long in April’s. At the moment it’s the commodity trading houses such as Glencore and Trafigura et al., along with some hedge funds, that are mega net short copper in the Producer/Merchant category, as the Swap/Dealers are mega net long.

Here’s Nick Laird’s “Days to Cover” chart, updated with the COT data for positions held at the close of COMEX trading on Tuesday, May 2. It shows the days of world production that it would take to cover the short positions of the Big 4 — and Big ‘5 through 8’ traders in every physically traded commodity on the COMEX. Click to enlarge.
230506Days-to-Cover image
In this week’s data, the Big 4 traders are short about 87 days of world silver production, up about 2 day from the April 28 COT Report. The ‘5 through 8’ large traders are short an additional 56 days of world silver production, unchanged from the April 28 COT Report, for a total of about 143 days that the Big 8 are short — and obviously up about 2 days from the April 28 COT Report.

Those 143 days that the Big 8 traders are short, represents about 4.8 months of world silver production, or 306.46 million troy ounces/61,291 COMEX contracts of paper silver held short by these eight traders. The two or three largest of these are now non-banking entities, as per Ted’s discovery in December’s Bank Participation Report. But this Big 8 commercial short position is now contaminated by the one Managed Money trader that is now embedded in it.

Because of that Managed Money trader now in the Big 8 category, the long position of Ted raptors, the 9-odd small commercial traders other than the Big 8, cannot be calculated accurately…but it’s somewhere around 40 million troy ounces…which is a very small amount for them to be long on an historical basis.

And as I mentioned earlier, the fact that Ted’s raptors are holding a long position of any kind with silver above all the moving averages that matter is not only amazing, it’s also unprecedented — and continues to remain so. I know that I point this out every week in this space, but it’s still a very big deal.

In gold, the Big 4 are short 59 days of world gold production, up about 1 day from the April 28 COT Report. The ‘5 through 8’ are short 19 days of world production, down about 1 day from the April 28 COT Report…for a total of 78 days of world gold production held short by the Big 8 — and obviously unchanged from the April 28 COT Report.

The Big 8 commercial traders are short 43.0 percent of the entire open interest in silver in the COMEX futures market as of yesterday’s COT Report, up a bit from the 40.6 percent that they were short in the April 28 COT Report. And once whatever market-neutral spread trades they have on are subtracted out, that percentage would be around the 50 percent mark. The reason that number went up as much as it did…is because of a big decrease in silver open interest week-over-week. In gold, it’s 47.4 percent of the total COMEX open interest that the Big 8 are short, down a bit from the 49.2 percent they were short in the April 28 COT Report — and certainly close to the 55 percent mark, once their market-neutral spread trades are subtracted out. The reason that the percentage number went down and not up, is because gold open interest increased by around 20,500 contracts during the reporting week…a decent chunk of which was market-neutral spread trade related.

And as mentioned earlier, Ted is still of the opinion that Bank of America is short about one billion ounces of silver in the OTC market, courtesy of JPMorgan & Friends. He’s also of the opinion that they’re also short around 25 million troy ounces of gold…with the same bunch of crooks on the long side.

If BofA gets hung out to dry, they could possibly end up being the next Bear Stearns. However, there won’t be anyone to save them…except the Fed, or maybe the Exchange Stabilization Fund.

And as you already, know the short position in SLV imploded from 41.49 million shares, down to 16.27 million shares in the last short report — and Ted is of the opinion that the almost 8 million troy ounces of silver that was added to SLV two Monday’s ago, was used to cover even more of the remaining short position. Whether that was the case or not, won’t be known until we get at look at the next short report, which is due out this coming Tuesday, May 9.

The situation regarding the Big 4/8 concentrated commercial short positions in silver and gold is still obscene, particularly in gold.

As Ted has been pointing out ad nauseam forever, the resolution of the Big 4/8 short positions will be the sole determinant of precious metal prices going forward. And as I’ve been mentioning for a month now, they have been very reluctant to add to their short positions in silver since late February…but have obviously added a bunch since silver’s run-up in price that started on Tuesday. But a certain amount of that was negated with silver’s engineered price decline yesterday.

The only reason that the Big 4/8 short position is as high as it is currently, is because of that Managed Money trader that’s short around 9,000 contracts in the Big 4 category.

And, as always, nothing else matters — and that should be obvious to all by now, except the willfully blind, of course…plus those whose so-called ‘reputations’ and careers depend upon them not seeing it.

The May Bank Participation Report [BPR] data is extracted directly from yesterday’s Commitment of Traders Report. It shows the number of futures contracts, both long and short, that are held by all the U.S. and non-U.S. banks as of Tuesday’s cut-off in all COMEX-traded products.

For this one day a month we get to see what the world’s banks have been up to in the precious metals. They’re usually up to quite a bit — and they certainly were again last month.

[The May Bank Participation Report covers the time period from April 4 to May 2 inclusive]

In gold, 5 U.S. banks were net short 49,258 COMEX contracts, down 5,777 contracts from the 55,035 contracts they were short in April’s BPR.

Also in gold, 23 non-U.S. banks were net short 33,755 COMEX contracts, up an insignificant 193 contracts from the 33,562 contracts they were short in April’s BPR.

At the low back in the August 2018 BPR…these same non-U.S. banks held a net short position in gold of only 1,960 contacts — so they’ve been back on the short side in an enormous way ever since.

Although some of the largest U.S. and foreign bullion banks are in the Big 8 short category in gold, there are some hedge fund/trading houses that are short even more grotesque amounts of gold than the banks.

As of this Bank Participation Report, 28 banks [both U.S. and foreign] are net short 16.8 percent of the entire open interest in gold in the COMEX futures market in May’s BPR…down a bit from the 18.6 percent these same 28 banks were net short in the April BPR.

Here’s Nick’s BPR chart for gold going back to 2000. Charts #4 and #5 are the key ones here. Note the blow-out in the short positions of the non-U.S. banks [the blue bars in chart #4] when Scotiabank’s COMEX short position was outed by the CFTC in October of 2012. Click to enlarge.

230506BPR-gold image
In silver, 5 U.S. banks are net short 26,367 COMEX contracts, up 3,500 contracts from the 22,867 contracts they were short in the April BPR.

The biggest short holders in silver of the five U.S. banks in total, would be Citigroup, HSBC USA, Bank of America, Morgan Stanley…and maybe Goldman Sachs — and also JPMorgan from time to time. And, like in gold, I have my suspicions about the Exchange Stabilization Fund’s role in all this…although, also like in gold, not directly.

Also in silver, 18 non-U.S. banks are net short 15,344 COMEX contracts, up 3,865 contracts from the 11,479 contracts that 20 non-U.S. banks were short in the April BPR.

I would suspect that HSBC and Barclays hold a goodly chunk of the short position of these non-U.S. banks…plus some by Canada’s Scotiabank/Scotia Capital still. I’m not sure about Deutsche Bank… but now suspect Australia’s Macquarie Futures. I’m also of the opinion that a number of the remaining non-U.S. banks may actually be net long the COMEX futures market in silver. But even if they aren’t, the remaining short positions divided up between the other 13 or so non-U.S. banks are immaterial — and have always been so.

As of May’s Bank Participation Report, 23 banks [both U.S. and foreign] are net short 29.3 percent of the entire open interest in the COMEX futures market in silver — up from the 26.2 percent that 25 banks were net short in the April BPR.

Here’s the BPR chart for silver. Note in Chart #4 the blow-out in the non-U.S. bank short position [blue bars] in October of 2012 when Scotiabank was brought in from the cold. Also note August 2008 when JPMorgan took over the silver short position of Bear Stearns—the red bars. It’s very noticeable in Chart #4—and really stands out like the proverbial sore thumb it is in chart #5. Click to enlarge.

230506BPR-silver image
In platinum, 5 U.S. banks are net short 19,619 COMEX contracts in the May BPR, up 1,847 contracts from the 17,772 contracts they were short in the April BPR.

At the ‘low’ back in September of 2018, these U.S. banks were actually net long the platinum market by 2,573 contracts. So they have a very long way to go to get back to just market neutral in platinum…if they ever intend to, that is. They look permanently stuck on the short side to me.

Also in platinum, 18 non-U.S. banks were net short 4,170 COMEX contracts, up 1,136 contracts from the 3,034 contracts 17 non-U.S. banks were net short in the April BPR.

But it’s the U.S. banks that are on the short hook big time — and the real price managers. They have little chance of delivering into their short positions, although a very large number of platinum contracts have already been delivered over the last few years…including the April delivery month. But that fact, like in both silver and gold, has made no difference whatsoever to their paper short positions. The situation for them [the U.S. banks] in this precious metal is as equally dire in the COMEX futures market as it is with the other two precious metals…silver and gold…particularly the former.

Platinum remains the Big commercial shorts’ No. 2 problem child after silver. How it will ultimately be resolved is unknown, but most likely in a paper short squeeze, as the known stocks of platinum are minuscule compared to the size of the short positions held — and that’s just the short positions of the world’s banks I’m talking about here.

And as of May’s Bank Participation Report, 23 banks [both U.S. and foreign] were net short 32.3 percent of platinum’s total open interest in the COMEX futures market, which is actually down from the 35.2 percent that 22 banks were net short in April’s BPR. The reason the percentage is down, not up, is because platinum open interest increased by around 14,500 contracts month-over-month, which reduced the bank’s concentration percentage.

Here’s the Bank Participation Report chart for platinum. Click to enlarge.

230506BPR-platinum image
In palladium, ‘3 or less’ U.S. banks are net long 1,503 COMEX contracts, up from the 1,285 contracts that 5 U.S. banks were net long in the April’s BPR.

Also in palladium, ’13 or more’ non-U.S. banks are net long 863 COMEX contracts, down from the 969 contracts that 16 non-U.S. banks were net long in the April BPR.

These palladium numbers held by the bullion banks of the world are meaningless in the grand scheme of things.

As I’ve been commenting on for almost forever, the COMEX futures market in palladium is a market in name only, because it’s so illiquid and thinly-traded.  Its total open interest in yesterday’s COT Report was only 13,116 contracts …compared to 73,591 contracts of total open interest in platinum…142,538 contracts in silver — and 493,804 COMEX contracts in gold.

The only reason that there’s a futures market at all in palladium, is so that the Big 8 commercial traders can control its price. That’s all there is, there ain’t no more.

As of this Bank Participation Report, 16 banks [both U.S. and foreign] are net long 18.1 percent of the entire COMEX open interest in palladium …compared to the 19.1 percent of total open interest that 21 banks were net long in the April BPR.

And because of the small numbers of contracts involved, along with a tiny open interest, these numbers are pretty much meaningless.

But, having said that, for the last three years in a row now, the world’s banks have not been involved in the palladium market in a material way. And with them now net long by a microscopic amount, it’s all hedge funds and commodity trading houses that are left on the short side.

Here’s the palladium BPR chart. Although the world’s banks are now net long at the moment, it remains to be seen if they return as big short sellers again at some point like they’ve done in the past. Click to enlarge.

230506BPR-palladium image
Excluding palladium for obvious reasons, and the non-U.S. banks in platinum …only a small handful of the world’s banks, most likely four or so in total — and mostly U.S.-based, except for HSBC, Barclays and maybe Standard Chartered…continue to have meaningful short positions in the precious metals. It’s a near certainty that they run this price management scheme from within their own in-house/proprietary trading desks…although it’s a given that some of their their clients are short these metals as well.

And as has been the case for years now, the short positions held by the Big 4/8 traders/banks, is the only thing that matters…especially the short positions of the Big 4 — and how this is ultimately resolved [as Ted said earlier] will be the sole determinant of precious metal prices going forward.

The Big 8 shorts, along with Ted’s raptors…the small commercial traders other than the Big 8 commercial shorts…continue to have an iron grip on their respective prices — until they don’t. At this point in time, nothing has changed in that regard…although their attempts to engineer prices lower recently, appears to be far weaker than it has been in the past.

But considering the current state of affairs of the world’s banking and financial system as it stands today — and the physical shortage in silver — and maybe in gold as well, the chance that these big bullion banks could get overrun at some point is certainly within the realm of possibility if things go totally non-linear.

However, if they do finally get overrun, it will be for the very first time, as Ted keeps pointing out.

I have a very decent number of stories, articles and videos for you again today — including a couple that I’ve been saving for length or content reasons.

CRITICAL READS
Job growth totals 253,000 in April, beating expectations even as the U.S. economy slows
Job growth fared better than expected in April despite bank turmoil and a decelerating economy, the Labor Department reported Friday.

Non-farm payrolls increased 253,000 for the month, beating Wall Street estimates for growth of 180,000, according to the Bureau of Labor Statistics.  Click to enlarge.

230506Chart-1 image
The unemployment rate was 3.4% against an estimate for 3.6% and tied for the lowest level since 1969. A more encompassing number that includes discouraged workers and those holding part-time jobs for economic reasons edged lower to 6.6%.

Average hourly earnings, a key inflation barometer, rose 0.5% for the month, more than the 0.3% estimate and the biggest monthly gain in a year. On an annual basis, wages increased 4.4%, higher than the expectation for a 4.2% gain. Both numbers raise the chances that the Federal Reserve could decide to raise interest rates again in June, though markets were only pricing in a small probability following the jobs report.

Well, dear reader…one has to wonder just how ‘cooked’ these numbers are, as I view anything coming out of the BLS with deep suspicion…as should you.  This news item appeared on the cnbc.com Internet site at 8:30 a.m. EDT on Friday morning — and was updated about an hour later. I thank Swedish reader Patrik Ekdahl for today’s first story — and another link to it is here. The Zero Hedge spin on this, courtesy of Brad Robertson, is headlined “April Payrolls Smash Expectations After Huge Downward Revisions; Black Unemployment Hits Record Low” — and linked here. Another directly related ZH story from Brad is headlined “Ignore the Noise: Job Market is Cracking as Birth-Death Model “Adds” Near Record 378,000 Jobs” — and linked here.

Consumer Credit Shocker: Credit Card Debt Explodes at 2nd Fastest Pace on Record Just as Rates Hit All-Time High
What was shocking, was the monthly change in the other big category, revolving credit. As shown in the next chart, after rising at the lowest pace since August 2021, the March change in credit card debt absolutely exploded, soaring by $17.6 billion, more than triple the February total, and the second biggest monthly increase on record!

It’s as if, either consumers – realizing this is their last hurrah to spend – went out and maxed out their cards at a pace (almost) never seen before, or perhaps the banks, desperate to load up peasants with some more debt, were handing out credit cards like hot cakes and the result is shown below.  Click to enlarge.

230506Chart-6 image
And while such a move could at least be explained, if not justified, when rates were at zero – after all the cost of money back then was negligible – this time it’s a little more difficult to explain what is going on, especially when one sees the next chart from the Fed, showing that average credit card interest had just hit a record high 20.9%.

And so the scene for both the next crisis and credit crunch are set, because just like Americans couldn’t afford their mortgages in 2008, hoping instead that some greater fool would take it off their hands at the right moment, so too now they are maxing out credit cards (just as rates hit all time high) knowing they will never repay the debt, but instead hope that the coming bank crisis will allow them to quietly sneak away without repaying their debt. Come to think of it, the bank crisis is already here…

This 5-chart Zero Hedge news story appeared on their Internet site at 3:29 p.m. EDT on Friday afternoon — and is yet another contribution from Brad Robertson. Another link to it is here.

U.S. Bank-Run Escalates: Deposit Outflows Top $360 Billion in Last 3 Weeks
The bank run continues to accelerate…especially if one looks at non-seasonally-adjusted data. Click to enlarge.
230506Chart-5 image
On a non-seasonally-adjusted basis, U.S. commercial bank deposits (ex-large time deposits) tumbled again, down $113 billion (also at its lowest since April 2021)…

And judging by yesterday’s money market inflows, the deposit outflows continued this week (remember, deposit data is lagged a week to money market and Fed balance sheet data)…

Large and Small banks saw very modest inflows (on a seasonally adjusted basis) but foreign banks saw large outflows…

On the other side of the ledger, Commercial bank lending rose $41.6 billion in the week ended April 26 after increasing $12.4 billion the prior week, according to seasonally adjusted data.

Small bank lending exploded higher to $30.6 billion…

Anyone else wonder how and to whom the small banks lent that much in CRE loans? Money good?

So you still believe the banking crisis over?

Finally, we remind readers, this data does not include this week’s potential problems (as the deposit and loan data is lagged by a week).

This multi-chart Zero Hedge article was posted on their Internet site at 6:33 p.m. on Friday evening EDT — and I thank Brad Robertson for sharing it with us. Another link to it is here.

 Extraordinarily Sound” — Doug Noland
Another humdrum week. The second largest bank failure in U.S. history – to start the week, making for three of the top four over the past two months. Tuesday saw Treasury Secretary Yellen notify the world of a debt limit “X-date” possibly as early as June 1st. The Fed raised rates on Wednesday in the face of an unfolding banking crisis. The ECB does the same Thursday.

Friday brought yet another stronger-than-expected payrolls report, with the unemployment rate back down to the lowest level since 1969 (3.4%). As for the unruly stock market, the Regional Bank Index (KRX) dropped 2.6% Monday, sank 5.5% Tuesday, declined 0.9% Wednesday, slumped 3.5% Thursday, and then rallied 4.8% Friday. Two-year Treasury yields jumped 14 bps Monday, dropped 18 bps Tuesday, sank another 16 bps Wednesday, and finished the week with Friday’s 13 bps jump – with intra-week yields trading as high as 4.16% and as low as 3.65% (ended the week at 3.91%). The 3 month /two-year Treasury spread inverted another 25 bps this week to negative 132 bps (most inverted in four decades).

Bank Credit default swap (CDS) prices jumped this week, with Bank of America CDS trading Thursday near the highest level (124bps) since March 2020 – ending the week up 14 to 117 bps. Bank CDS prices declined moderately Friday. Yet Wells Fargo CDS still jumped 13 for the week to 116 bps, trading Thursday to the high since March 2020. Morgan Stanley CDS jumped 14 bps this week, Goldman 10 bps, Citigroup eight bps, and JPMorgan six bps. High-yield CDS surged 26 bps this week, trading Thursday to a six-week high (516 bps).

It was an extraordinary backdrop heading into the FOMC meeting. There was a strong case for the Fed to hold off on another rate increase. The unfolding banking crisis ensures tighter Credit for an economy already downshifting. But the case for hiking rates was equally compelling. Inflation remains elevated, with recent data consistently pointing to sticky price pressures. Friday’s strong payroll data – including 253,000 jobs added and a 0.5% (4.4% y-o-y) gain in Average Hourly Earnings – confirm unrelenting labor market tightness.

Jay Powell’s much anticipated press conference was short on drama. It’s worth noting the fourth sentence in his prepared remarks: “We are committed to learning the right lessons from this episode and will work to prevent events like these from happening again.”

Hope springs eternal. The Fed is early in the learning process. Clearly, indefensible mistakes were made in bank regulation. Meanwhile, unpardonable inflation mismanagement is at risk of historic failure. As much as banking instability adds to downside economic risks, the Powell Fed today has little option other than to err on the side of ongoing measures to contain inflation. Powell has repeatedly underscored the risk of repeating past mistakes of the Fed’s inflation fights ending prematurely.

The Fed could have bailed out Lehman, but the number that mattered was the $2.5 TN or so yearly Credit expansion necessary to prolong the mortgage finance Bubble. The number that matters today is probably around $3.5 TN annually. And the inescapable problem is that to continue a massive late-cycle inflation of nonproductive Credit feeding a deeply maladjusted system risks crises of confidence – crises of confidence in the markets, in policymaking, in debt structures, and the monetary system more generally.

There is no alternative. The system faces an extremely challenging adjustment period. Today’s banking crisis is only the initial phase. There are no easy answers or painless solutions. And I’m assuming a plethora of bad ideas (i.e., short selling bans, system-wide deposit guarantees, larger lending facilities, additional QE and who knows what) will only make for a more destabilizing day of reckoning.

Doug’s weekly commentary is always a must read for me — and this week’s showed up on his website around midnight PDT last night. Another link to it is here.

Going to Be Bumpy“: World’s Largest Container Shipper Warns of Downturn
The world has a handful of shipping companies, and one of the ones we follow is A.P. Moller-Maersk A/S, which warned of a “radically changed business environment” as profits declined in the first quarter due to slumping transport volumes and sliding freight rates, Financial Times reported.

Maersk, which transports close to one-fifth of the world’s containers, beat analyst expectations in the first quarter but outlined earnings for the remainder of the year would be weaker. It said the first three months of 2023 “will be the best quarter of the financial year.”

“Guidance for 2023 continues to be based on the expectation of a muted 2023 global GDP growth and that volume declines will stabilise by the end of H1, leading to a more balanced demand environment. In this normalization path, Q1 is expected to be the best quarter of the financial year.”

Chief executive Vincent Clerc told the FT about a large influx of new vessels about to hit the world’s top shipping lanes ordered during the last several years. He expects those ships to be delivered in 2024.

“It’s clearly going to be bumpy because there are quite a few coming this year and quite a few coming next year, too. The volumes are coming back after, but it’s not like the macroeconomic backdrop points to a lot of growth to take care of this,” he added.

During the first quarter, Maersk reported a 56% plunge in EBITDA, amounting to $3.97 billion, compared to analysts’ median estimate of $3.55 billion. The quarter saw a 9.4% reduction in volumes and a 37% drop in freight rates, which now hover near the break-even point.

This news item showed up on the Zero Hedge website at 5:45 a.m. on Friday morning EDT — and another link to it is here. Gregory Mannarino’s sometimes mildly “ADULT” rated live rant for yesterday is linked here — and I thank Brad Robertson for sending it our way. It lasts for about 23 minutes.

David Stockman on Tucker Carlson’s Firing — and Corporate Suicide Run Amok
We are not sure what the Murdochs were smoking last Monday morning when they shot the immensely profitable Fox News Channel in the kneecaps, but we do know that Tucker Carlson was one of a kind among commentators in the vast journalistic wasteland otherwise known as television news.

Indeed, on issue after issue in recent years Tucker treaded forthrightly where his MSM competitors in both print and broadcast media feared to go. Perhaps that was because he was deeply informed, historically read and literate and possessed of an incisive, open, inquisitive mind that was not about to play passive stenographer to either the Deep State or the lobbies and corporate interests that suffuse the Washington beltway.

Accordingly, Tucker has been nearly alone in smoking out the big issues of our time with a unique breadth, edge and consistency that neither Republican shills like Sean Hannity nor DNC conduits like Anderson Cooper and Rachel Maddow could hope to approach.

Thus, unlike the GOP’s neocon war-lovers and their echo chamber at Fox News, Tucker Carlson exposed the futility, stupidity and danger of the Ukraine proxy war against Russia. And he did so thoroughly and aggressively, exposing serial Deep State war-promoters like Victoria Nuland, while giving learned and incisive refugees from the national security apparatus like Colonel Douglas Macgregor a forum to refute the official lies and delusions.

By the same token, he had gone after the Dem/left earlier on when he relentlessly debunked the RussiaGate hoax. His facts and truths about this latter-day outbreak of McCarthyism are now unassailable, but at the time their mere mention was strictly verboten on the Dem venues at CNN, MSNBC, the broadcast networks and the New York Times/Washington Post axis.

This commentary from David showed up on the internationalman.com Internet site on Friday — and another link to it is here.

Another Interview with Colonel Douglas Macgregor
This wide-ranging video/audio interview appeared on the youtube.com Internet site on Thursday — and for obvious length and content reasons had to wait for today’s column. I thank John Coombs for pointing it out — and another link to it is here.
India’s gold demand plunges to 6-year low on record high prices
India’s gold demand plunged to a six-year low (excluding Covid in 2020) and was down 17 per cent in the March quarter to 112 tonnes against 135 tonnes logged in the same period a year ago on the back of record high prices.

In value terms, it dipped nine per cent to ₹56,220 crore (₹61,540 crore).

Jewellery demand also dropped to a six-year low as it decreased 17 per cent to 78 tonnes (94 tonnes) and in value terms, it slipped ₹390 crore (₹428 crore).

Investment demand was also low at 34 tonnes (41 tonnes).

Recycled gold was up 25 per cent at 35 tonnes (30 tonnes) as consumers took advantage of high prices to recycle their old gold. Bullion imports were flat at last year’s level of 134 tonnes. However, imports of doré (impure gold) fell 41 per cent to 30 tonnes (52 tonnes).

Gold retail prices increased 26 per cent to ₹63,000 per 10 gram against an average price of ₹49,977 in the March quarter.

This gold-related news item showed up on thehindubusinessline.com Internet site — and I found it on Sharps Pixley. Another link to it is here.

Why gold is always money — Alasdair Macleod
That America faces a severe banking crisis has become plain to see, but the authorities’ response less so. Almost certainly, the crisis has much further to go in America, spreading to other jurisdictions. We can only hope that central banks will protect all depositors, but that is far from certain in this early stage.

These febrile conditions are made infinitely more difficult by the contraction of bank credit. The cyclical nature of bank credit means that the shortage of credit will intensify, driving up borrowing costs even in the face of a recession. Interest rates are no longer under the control of central banks, though market participants have yet to realise it.

It has important implications for the valuation of credit. In order to understand the consequences, this article draws out the legal and practical distinctions between money, defined as gold and silver but principally gold, and credit in the form of banknotes and bank deposits.

The value of credit is a matter of the confidence in it. You may think that your dollars, euros, or pounds are money, but you would be wrong. They are credit. The cost of being wrong will not be just to see your bank deposits threatened systemically, but potentially the entire currency system undermined by loss of faith in it.

To properly understand these dangers, this article defines and describes the differences between credit and money. It is credit which is threatened with collapse. Only true money, which very few westerners possess will survive.

Another short novel from Alasdair…which I haven’t had time to read yet, but will do so over the weekend. This one put in an appearance on the goldmoney.com Internet site on Wednesday — and for obvious length reasons, had to wait for today’s column. I found it embedded in a GATA dispatch — and another link to it is here.

The Photos and the Funnies
Here are four more photos showing the flood damage along the Nicola River during late November of 2021. As you can see from the first photo, the flooding cut a wide swath on this curve in the river…taking out the old Kettle Valley Railway right-of-way in the process — and so badly that it had to be rebuilt and reinforced in order to prevent the river from taking out B.C. Highway 8 that I was standing on when I took this shot. The second photo was taken from the rebuilt road in photo one. Shortly after that we ran into a barricade — and the nice man standing by it said we could go no further, as both bridges at Spences Bridge were washed out. Photos three and four were taken on the return trip back to Merritt. The rust-coloured trees in the distance across the center-left of photo four were victims of the wildfire that raged through here during July and August of 2021…followed by the flood in November of the same year. 2021 was not a good year in these parts. Click to enlarge.
230506Photo-1 image
230506Photo-2 image
230506Photo-3 image
230506Photo-4 image
230506Quote-5 image
230506Cartoon-1 image
The WRAP
“Understand this. Things are now in motion that cannot be undone.” — Gandalf the White
Today’s pop ‘blast from the past’ honours Gordon Lightfoot, a Canadian folk-rock legend, who passed from our sight this past week. He was a “musician whose silvery refrains told a tale of Canadian identity that was exported to listeners worldwide.” There’s no Canadian who doesn’t know his name. I knew who he was from shortly after I graduated from high school in 1966 when he first rose to prominence in our country.

He had so many hits, that the three I’ve chosen barely scratch the surface.  The first is here…the second here — and, of course, this one.

American YouTube personality, multi-instrumentalist, music producer and educator Rick Beato pays an emotional tribute to Gordon in a 28-minute video clip linked here. I amazed to discover that the first three songs he featured were the ones I had chosen above.

Today’ classical ‘blast from the past’ is Robert Schumann’s Violin Concerto in D minor, which he wrote in 1853 — and was one of his last significant compositions. It remained unknown to all but a very small circle for more than 80 years after it was composed — and has a very interesting provenance.

The soloist is Frank Peter Zimmermann, accompanied by the Cologne-based WDR Symphony Orchestra. World-renowned Maestro Jukka Pekka Sarasate conducts — and the link is here.

I suspect that you weren’t overly surprised that the commercial traders of whatever stripe were there to engineer gold and silver prices lower on that phony baloney jobs report — and the concurrent ‘rally’ in the dollar index.

But as has been the case lately, both came roaring back once their low ticks were set — and those ensuing rallies had to be quietly turned aside, or both would have closed much higher than they were allowed.

As it was, their associated equities were heavily bought — and both the HUI and Silver 12 Indexes closed lower by only small fractions of one percent, which is hugely positive considering how badly both precious metals were beaten up during the New York trading session.

You’ll carefully note that both platinum and palladium were mostly left to their own devices, although palladium got stepped on late in the COMEX trading session when it appeared to be about to go ‘no ask’. Despite that, palladium managed to close back above its 50-day moving average — and platinum is still a very great distance above any moving average that matters.

Copper managed to finish the Friday trading session 2 cents higher, closing at $3.88/pound…but still firmly stuck in no-man’s land between its 50 and 200-day moving averages.

Natural gas [chart included] closed up 4 cents at $2.14/1,000 cubic feet, but is still below any moving average that matters…especially its 200-day, which is a bit over three bucks higher than its Friday close. WTIC caught a bid yesterday, as it finished the Friday trading session at $71.34/barrel…up $2.78/4.05% — and I’ll speculate that we saw the low for WTIC for this engineered move lower, intraday on Thursday.

Here are the 6-month charts for the Big 6+1 commodities, courtesy of the good folks over at the stockcharts.com Internet site — and Friday’s closing prices in their current front months should be noted, if interested.  Click to enlarge.

230506-6-month-gold image
230506-6-month-silver image
230506-6-month-platinum image
230506-6-month-palladium-1 image
230506-6-month-copper image
230506-6-month-NG image
230506-6-month-WTIC image
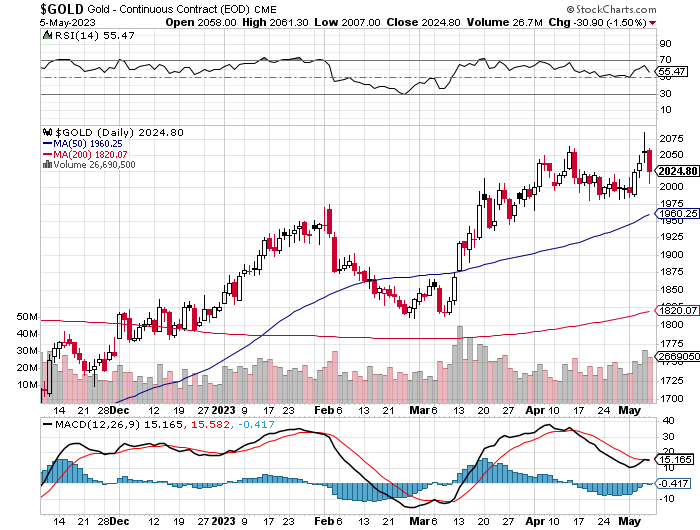
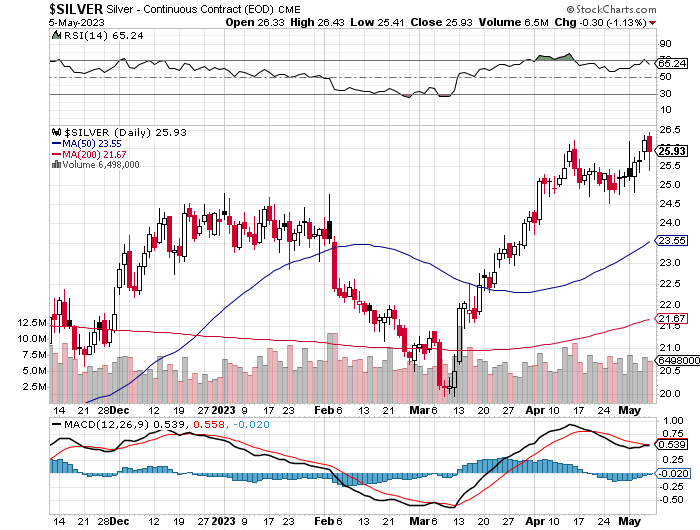
Ever since the current rallies in both silver and gold were stepped on back on April 13…the big commercial shorts have been trying without much success to engineer price declines so they can flush out all the Managed Money longs that they have been accumulating since their respective rallies began a month prior to that.

Every time they appear to be making headway in GLOBEX trading overseas — and in early morning trading on the COMEX in New York, their dips are being aggressively bought…with the most recent poster child for that occurring yesterday.

Whether or not they’ll make any further headway than they already have, is not known…but they’ve shot their wad on Wednesday’s Fed news — and yesterday’s jobs report. So one has to wonder what they’ll use as cover on their next attempt…if there is one.

Of course they were able to reduce their short positions somewhat yesterday, although not by as much as I was hoping, as total open interest in both silver and gold didn’t drop by much yesterday…especially the former.

It’s not entirely clear if the Big 4/8 shorts have a plan or not…or if they’re just winging it as a final act of desperation in the face of rising demand in both these precious metals. There’s always that chance that they’ll get overrun, but as Ted Butler has pointed out for decades now, if that event does occur, it will be for the very first time…something I pointed out further up in today’s missive.

But, for the moment — and as I also stated further up in today’s column, they have precious metal prices in an iron grip — and are obviously preventing gold from breaking out to a new high — and silver above $26 spot.

In doing so, their shorting over the last couple of months has put gold very firmly in bearish territory — and according to Ted, the COMEX futures market set-up in gold is the most bearish its been since early last year. But whether or not they can improve their lot by bombing the price going forward is still an open question.

On the other hand, the set-up in silver is still very bullish from a futures market perspective — and that’s despite the fact that Big 4 commercial traders added to their short positions by a bit during this past reporting week.

The dichotomy between these two precious metals from a COMEX futures market perspective has never been this stark — and how this ultimately resolves itself is also something that remains to be seen.

But in the macro view in precious metals, the powers-that-be in the U.S. know and fear the moment that gold in particular is allowed to close above its old high by any decent amount — as the institutional investors will finally starting showing up in force — and what remains of available physical metal…silver and gold in particular…will vanish in a New York minute. At that point, prices will explode to the upside in a short covering rally for the ages, with consequences to the financial system that cannot possibly be imagined…but all of them potentially catastrophic.

Looking around at the state of the world through the lens of Zero Hedge and the daily King Report this past week, shows a continued decline in the state of the world from a financial, economic and moral perspective, as our journey down the road to perdition continues uninterrupted — and at a faster pace with each passing week.

I mentioned several weeks ago that the state of the West in general — and the U.S. in particular, has that “last days of Rome” feel about it. Since then, everything I’ve been looking at only reinforces that notion — and I know that I’m not alone in that assessment.

Of course none of this is happening by chance, as this decline has been ongoing for many generations…ever since the creation of G. Edward Griffin’s “Creature From Jekyll Island”. It’s just that now the Deep State/New World Order crowd are no longer trying to hide it — and have accelerated the process.

However, their grand plan has run into some serious difficulties lately, as the sheeple have finally woken up to the fact of what was done to them during this planned COVID thingy. Let’s hope that they’re more alert for the current dose of snake oil being shoved down their throats…climate change.

Of course at some point in the future the powers-that-be will play their trump card and crash the entire financial and monetary system. The central banks of the world et al. have been moving heaven and earth to keep things propped up until they’re ready to pull the pin on it all. This has been ongoing at an ever-increasing rate since the gold exchange standard in the U.S. went out the window in August 1971 — and since September 2019…their efforts have gone parabolic.

There’s no way out of this upward spiral of debt and money printing…none whatsoever. Here’s a 2-minute video clip with George Orwell himself telling us how this will most likely end — and it’s worth watching. Click here.

So unless we’re prepared to take up arms against them at some point, there’s not a thing we can do about it, except watch its continuing unfolding on our flat-screen TVs — and hope we don’t become collateral damage when everything heads south.

Like you, I’ve done all I can in preparation for the “end of all things” — and also like you, I hope it’s enough.

As always, I’m still “all in” with my precious metals stock portfolio and physical metal — and will remain that way to whatever end.

I’m done for the day — and the week — and I’ll see you here on Tuesday.

Ed

STAY INFORMED! Receive our Weekly Recap of thought provoking articles, podcasts, and radio delivered to your inbox for FREE! Sign up here for the HoweStreet.com Weekly Recap.

Post a Comment:

Your email address will not be published. Required fields are marked *

All Comments are moderated before appearing on the site

*
*

This site uses Akismet to reduce spam. Learn how your comment data is processed.