ALWAYS CONSULT YOUR INVESTMENT PROFESSIONAL BEFORE MAKING ANY INVESTMENT DECISION

May 31, 2022 | The Most Splendid Housing Bubbles in America, May Update: Mania at the Eve of Holy-Moly Mortgage Rates

Wolf Richter


The home price data released today by the S&P CoreLogic Home Price Index represents the three-month average of closed home sales that were entered into public records in January, February, and March, reflecting deals that were agreed to a few weeks earlier, roughly in December, January, and February, funded with mortgages that were pre-approved before then, and had rate locks from when they were pre-approved.
These rate locks were based on interest rates in effect roughly from November into February, when the average 30-year fixed rate ranged from 3.2% to 4.2%, with the majority of the time being below 3.8% (green box in the chart). These are the rates that funded home purchases reflected in today’s home price index.
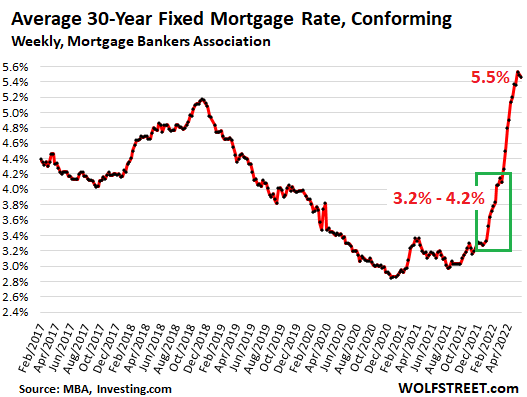
There have already been numerous indicators that the markets for existing home sales and new home sales have run into difficulties at the current holy-moly mortgage rates of over 5%, including sharply lower sales volume and rising inventories in existing homes and falling sales and record spiking inventories in new houses.
But the data by the S&P CoreLogic Case-Shiller Index released today and shown in the hair-raising charts below predate those changes in the market by several months and instead reflect the period when a mad scramble was going on to lock in a mortgage rate before it would spike further, and to buy a home, any home, at any price, before the rate lock from prior months would expire.
The mad scramble back then.
The overall National Case-Shiller Home Price Index for “March” released today (average of closed deals entered into public records in January, February, and March) spiked by 2.6% from the prior month and by a record 20.6% year-over-year.
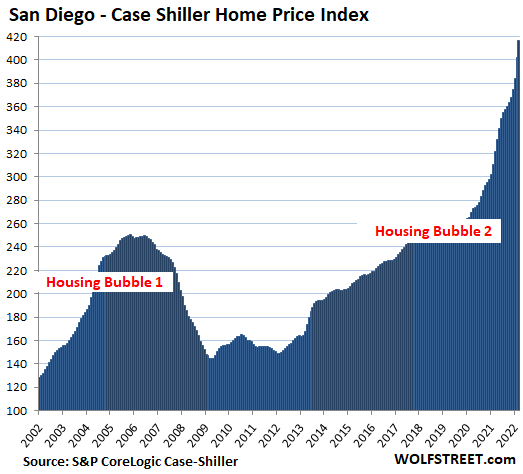
San Diego metro: Prices of single-family houses spiked by 3.7% in “March” (average of January, February, March) from the prior month, and 29.6% year-over-year. The index value of 417 means that home prices exploded by 317% since January 2000, when the index was set at 100.
This price growth amounts to 4.5 times the rate of CPI inflation (+70.3%) since 2000. This majestic spike since January 2000, despite the plunge in between, anoints San Diego the Number 1 most splendid housing bubble on this list, followed closely by Los Angeles (+310%) and the incredibly spiking mania in Seattle (+301%):
All charts here are on the same index scale as San Diego.
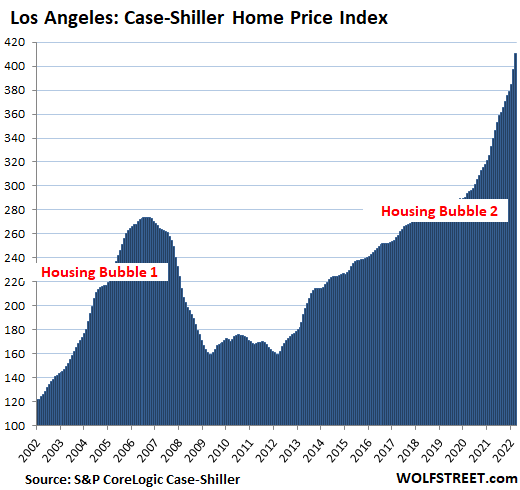
Los Angeles metro: The Case-Shiller index spiked by 3.3% in March from February and by 23.2% year-over-year. With an index value of 410, house prices exploded by 310% since January 2000, despite the plunge in the middle, crowning the Los Angeles metro the Number 2 most splendid housing bubble on this list:
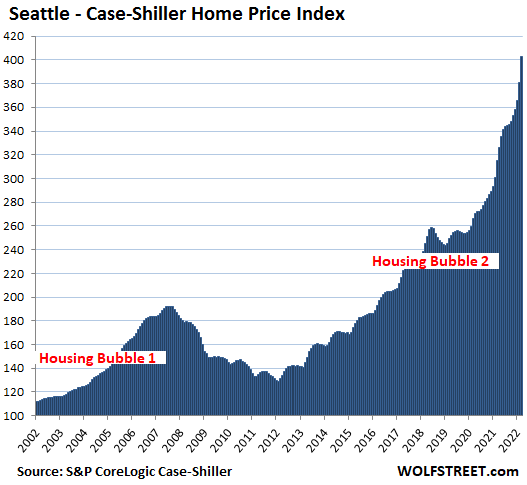
Seattle metro: House prices spiked by a holy-moly 5.6% for the month, bringing the two-month spike to a good-lordy 10.2%. Year-over-year, the index spiked by 27.7%. Since January 2000, house prices spiked by 302%, 4.3 times the rate of CPI inflation:
It’s house price inflation.
The Case-Shiller Index is based on the “sales pairs” method, comparing the price of a house when it sells in the current period to the price when it sold previously. It tracks how many dollars it took to buy the same house over time (methodology). The index incorporates adjustments for home improvements. By measuring the purchasing power of the dollar to buy the same house, the index is a measure of house price inflation.
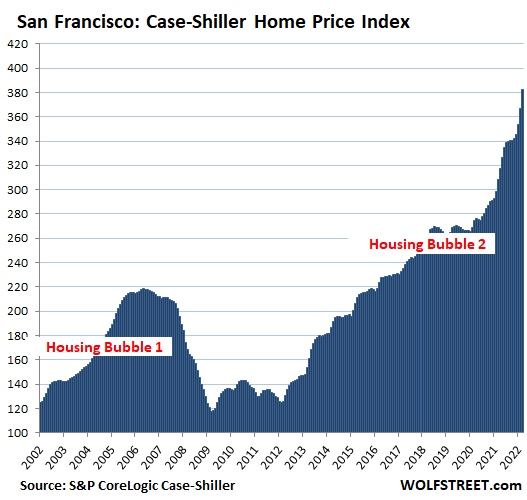
San Francisco Bay Area (five-counties including San Francisco, part of Silicon Valley, part of the East Bay, and part of the North Bay): House prices spiked 4.3% for the month, and by 24.1% year-over-year:
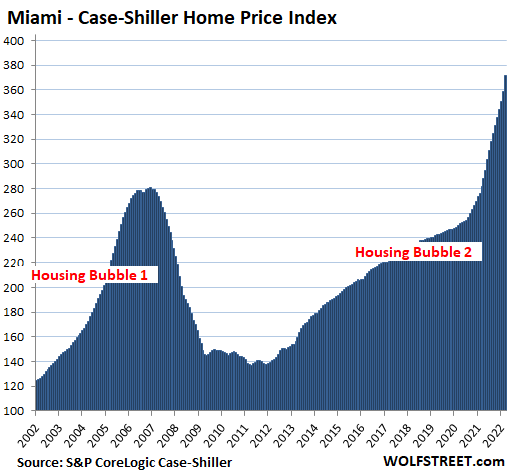
Miami metro: The index spiked 3.6% for the month, and 32.0% year-over-year, the fastest since November 2005, near the apex of the Housing Bubble 1, before the epic Housing Bust:
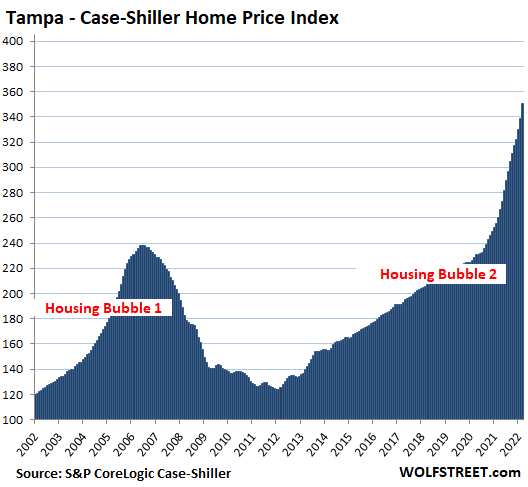
Tampa metro: House prices spiked by 3.7% for the month, and by 34.8% year-over-year, a record spike in the Tampa metro, out-spiking with ease the crazy spikes just before the Tampa’s epic housing bust:
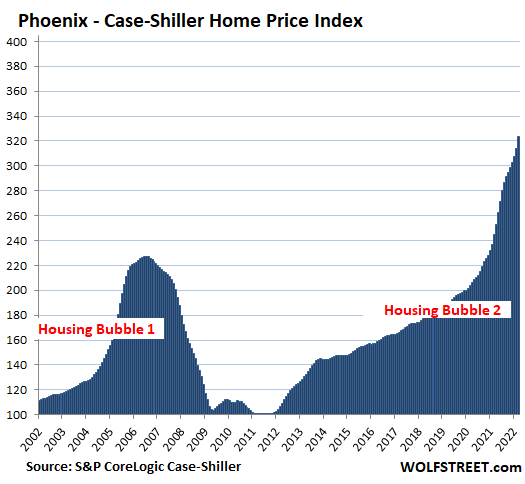
Phoenix metro: House prices spiked 3.0% for the month, and by 32.4% year-over-year, just a tad below the record year-over-year spike in the prior month, and the ninth month in a row of over-30% year-over-year spikes:
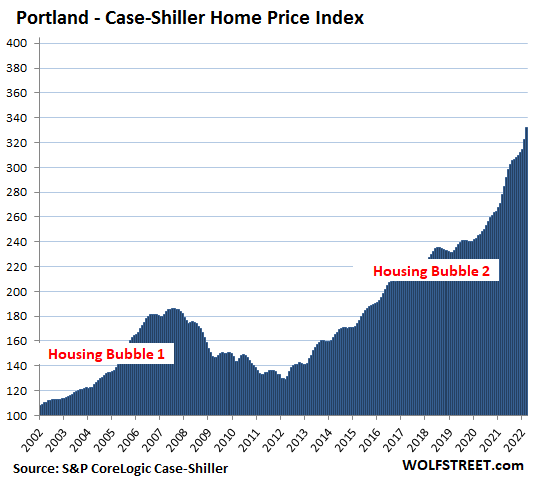
Portland metro: +2.9% for the month, and +19.3% year-over-year:
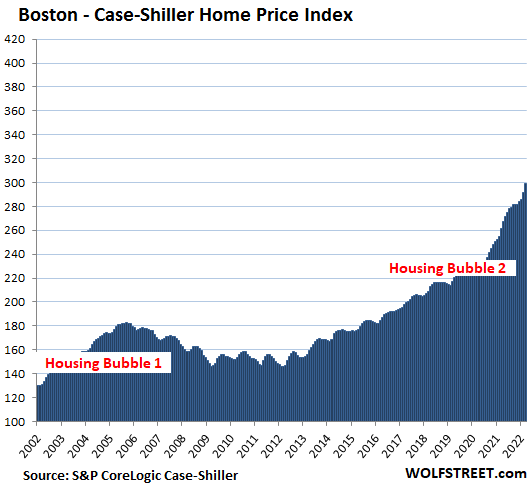
Boston metro: +2.6% for the month, and +14.5% year-over-year:
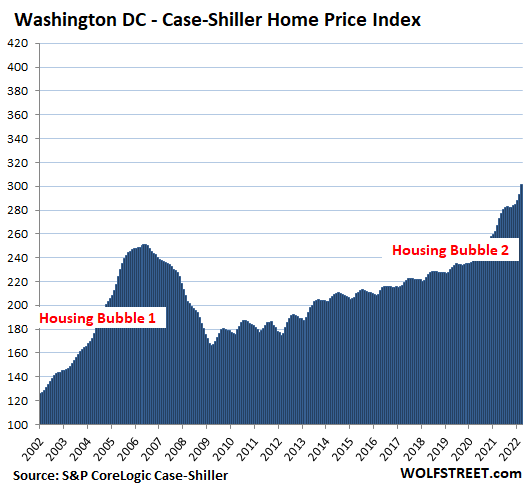
Washington D.C. metro: +2.9% for the month, and +12.9% year-over-year:
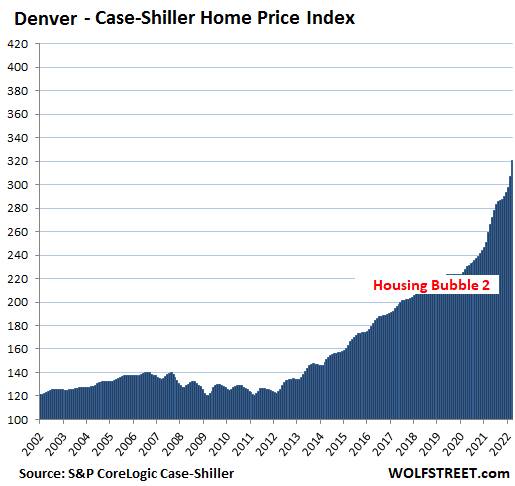
Denver metro: +4.5% for the month, and +23.7% year-over-year:
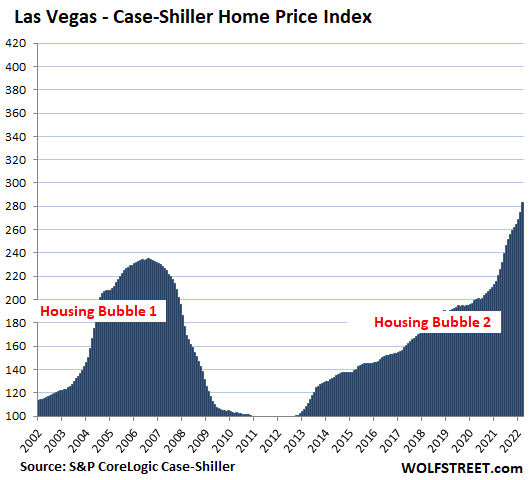
Las Vegas metro: +3.1% for the month, and +28.5% year-over-year:
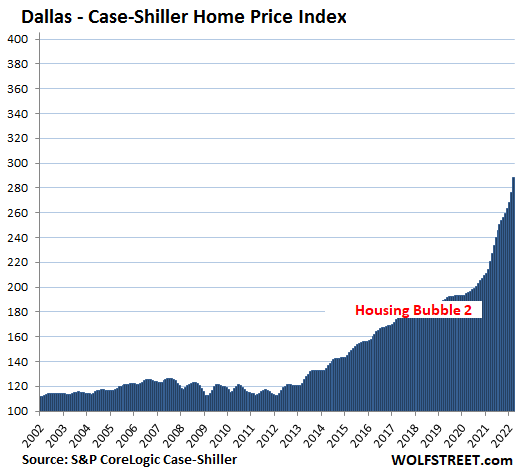
Dallas metro: +4.3% for the month, and a record +30.7% year-over-year:
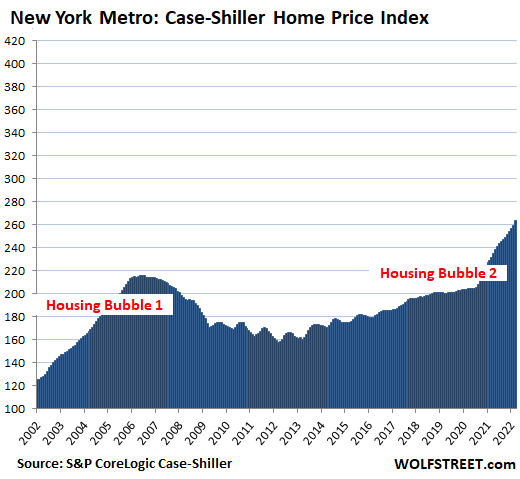
New York metro (a vast market within commuting distance to New York City that Case-Shiller calls “New York Commuter”): +1.6% for the month, and +13.7% year-over-year. At an index value of 263, the metro has experienced 163% house price inflation since January 2000, 2.3 times the rate of CPI inflation.
The remaining metros in the 20-metro Case-Shiller Index – Atlanta, Charlotte, Chicago, Cleveland, Detroit, and Minneapolis – all have experienced substantial house price inflation since 2000, but it doesn’t quite measure up to these most splendid housing bubbles here, and so they didn’t qualify for this illustrious list.
STAY INFORMED! Receive our Weekly Recap of thought provoking articles, podcasts, and radio delivered to your inbox for FREE! Sign up here for the HoweStreet.com Weekly Recap.
Wolf Richter May 31st, 2022
Posted In: Wolf Street
Next: Appraisers are Skittish »