ALWAYS CONSULT YOUR INVESTMENT PROFESSIONAL BEFORE MAKING ANY INVESTMENT DECISION

March 29, 2022 | The Most Splendid Housing Bubbles in America, March Update: Just Before the Great Spike in Mortgage Rates

Wolf Richter


So now we have a new snapshot of the incredibly spiking home prices, topping out at over 30% year-over-year in Phoenix and Tampa, according to the S&P CoreLogic Case-Shiller Home Price Index today. But these prices predate the Great American Mortgage Rate Spike.
What time span are we talking about?
The “January” home price data released today are a three-month moving average of closed sales that were entered into public records in November, December, and January, reflecting deals and mortgages that were agreed to roughly in October through December, when the average 30-year fixed mortgage rate was around 3.2%. Now, the average 30-year fixed mortgage rate is flirting with 5%, according to Mortgage News Daily, and today’s home price data is still untouched by that spike in mortgage rates:
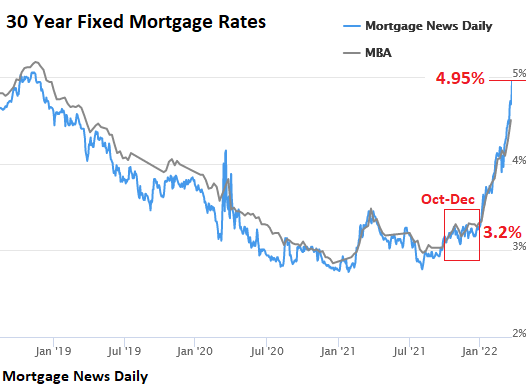
There was a mad scramble to get the deals done late last year and earlier this year before mortgage rates would rise, and this mad scramble is reflected here.
The overall National Case-Shiller Home Price Index for “January” jumped 1.1% from December and 19.2% year-over-year. The Case-Shiller Home Price Indices were set at 100 for January 2000. This means that the overall index, with an index value of 282 for “January,” shot up by 182% since January 2000, more than four times the rate of CPI inflation.
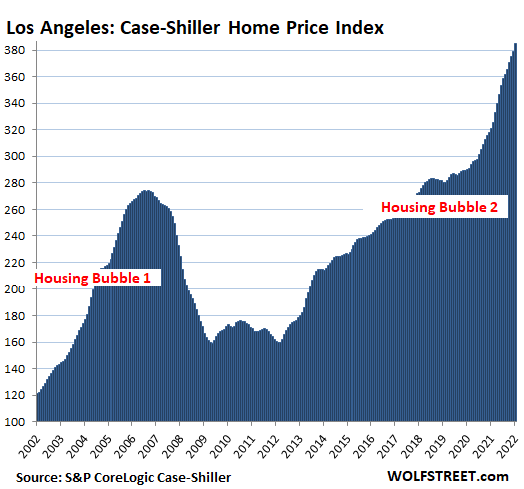
Los Angeles metro: Prices of single-family houses jumped 1.6% in January from December and 19.9% year-over-year. The index value of 385 means that home prices shot by 285% since January 2000, which crowns the Los Angeles metro as the Number 1 most splendid housing bubble on this list.
San Diego metro: Prices of single family houses spiked 2.5% for the month, and 27.1% year-over-year. Since 2000, house prices have ballooned by 284%:
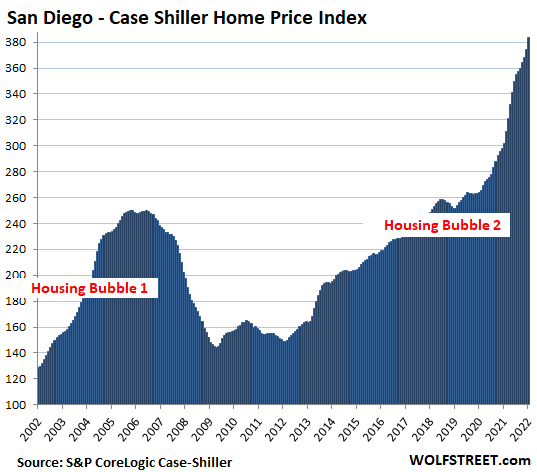
This is house price inflation.
The Case-Shiller Index is based on the “sales pairs” method, comparing the sales price of a house when it sells in the current period to the price of the same house when it sold previously. The index includes adjustments for home improvements and the passage of time between sales. By tracking how many dollars it takes to buy the same house over time, the index measures house price inflation.
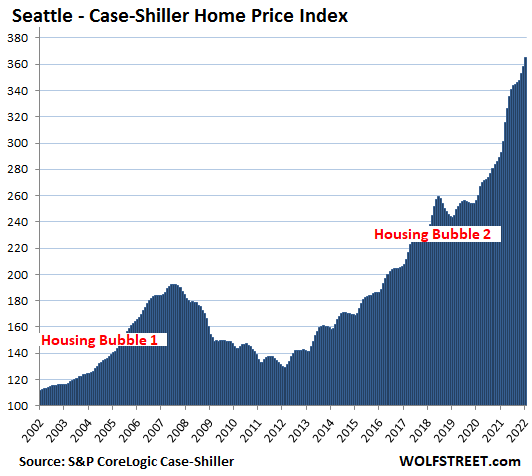
Seattle metro: The Case-Shiller Index spiked 2.0% for the month, and 24.7% year-over-year. Since January 2000, house price inflation in the Seattle metro has ballooned to 265%:
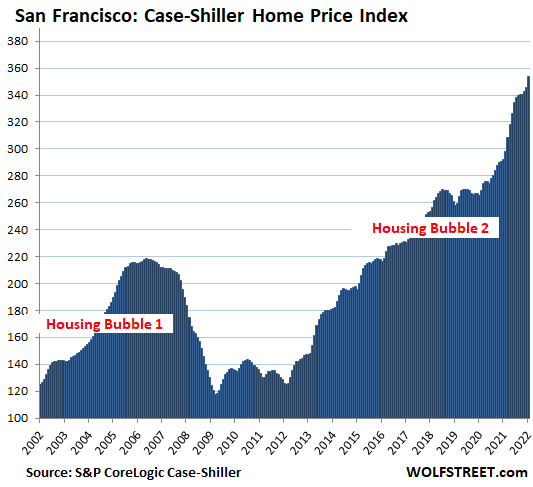
San Francisco Bay Area: House prices spiked 2.4% for the month, and by 20.9% year-over-year:
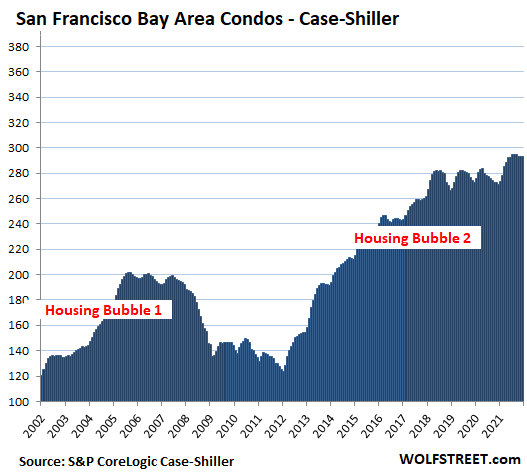
San Francisco Bay Area: Condo prices edged up 0.1% for the month, after having ticked down four months in a row. Since July last year, prices have remained roughly flat. Year-over-year, the index rose 8.3%. Since June 2018, condo prices have risen just 4.0%:
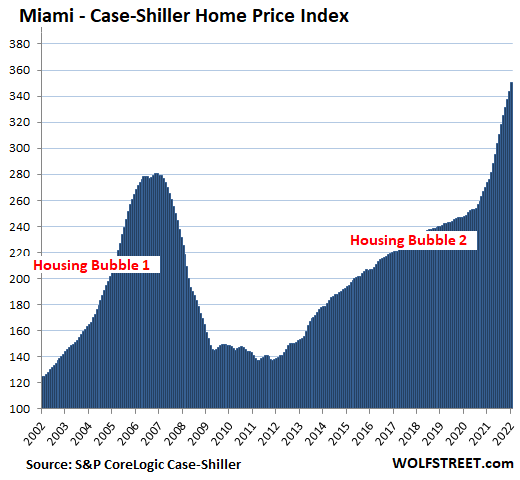
Miami metro: House prices spiked 1.8% for the month, and 28.1% year-over-year, the fastest since February 2006, on the eve of its epic Housing Bust:
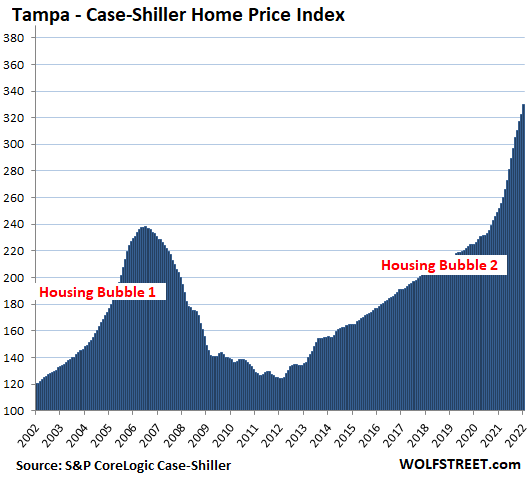
Tampa metro: House prices spiked by 2.3% for the month, and by 30.8% year-over-year, a record spike for the Tampa metro, out-spiking even the crazy spikes on the eve of the housing bust:
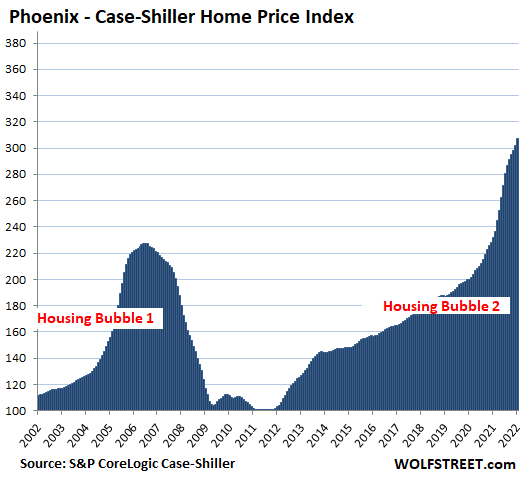
Phoenix metro: House prices spiked by 1.7% for the month, and by a record 32.6% year-over-year, out-spiking the craziness just before the housing bust. The year-over-year price spikes have been over 30% starting last July:
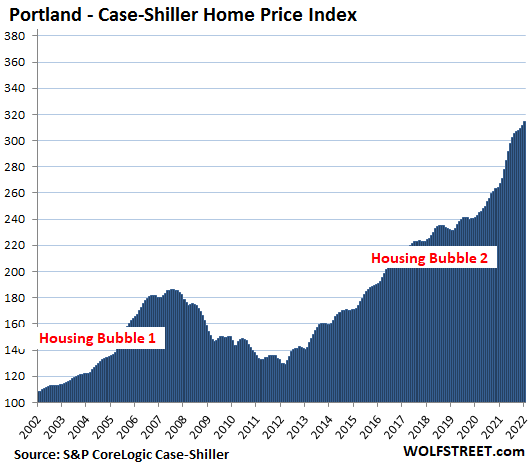
Portland metro: The Case-Shiller Index rose by 0.9% for the month, and 17.7% year-over-year:
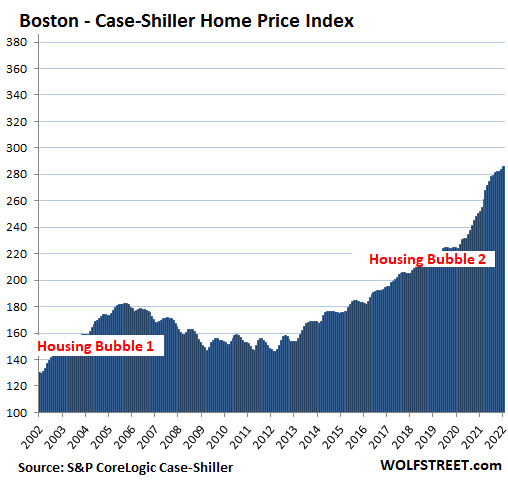
Boston metro: +0.7% for the month, and +13.3% year-over-year:
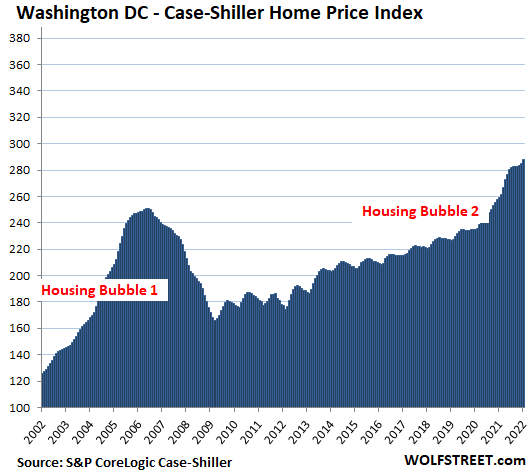
Washington D.C. metro: +1.1% for the month, and +11.2% year-over-year:
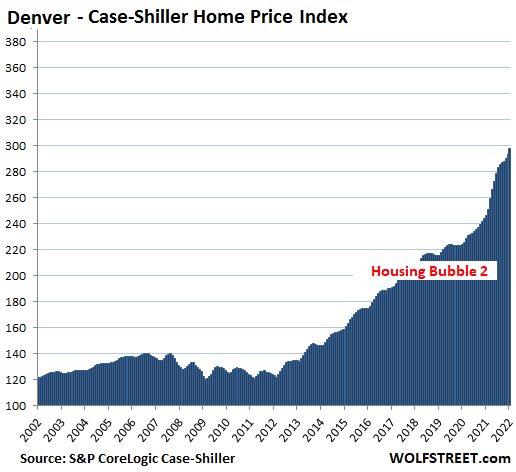
Denver metro: +1.6% for the month, and +20.8% year-over-year:
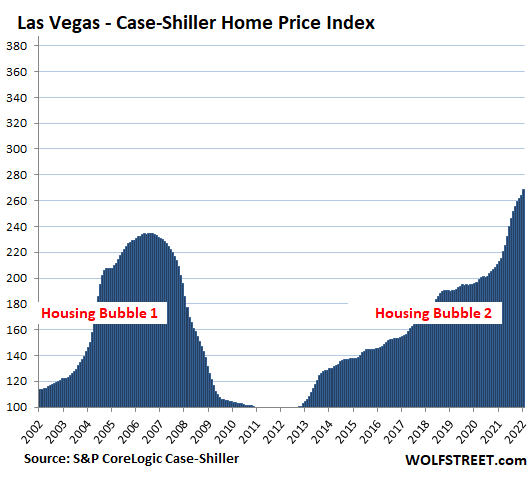
Las Vegas metro: +1.7% for the month, and +26.2% year-over-year:
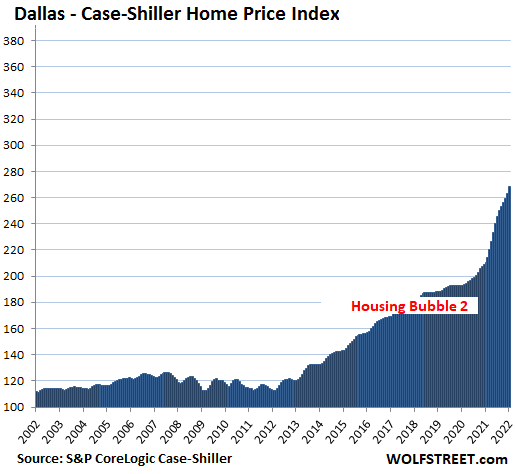
Dallas metro: +1.9% for the month, and a record +27.3% year-over-year:
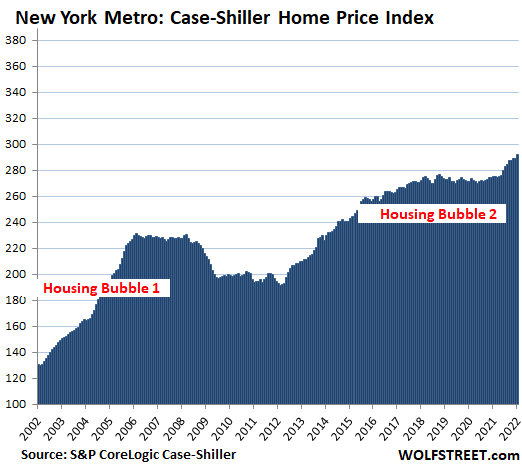
New York metro: +0.9% for the month, and +13.5% year-over-year. At an index value of 258, the metro has experienced 158% house price inflation since 2000.
The remaining metros in the 20-metro Case-Shiller Index – Atlanta, Charlotte, Chicago, Cleveland, Detroit, and Minneapolis – have house price inflation since 2000 of less than 150%, and while some of their price increases are still huge, they don’t qualify for this illustrious list of the most splendid housing bubbles.
STAY INFORMED! Receive our Weekly Recap of thought provoking articles, podcasts, and radio delivered to your inbox for FREE! Sign up here for the HoweStreet.com Weekly Recap.
Wolf Richter March 29th, 2022
Posted In: Wolf Street