ALWAYS CONSULT YOUR INVESTMENT PROFESSIONAL BEFORE MAKING ANY INVESTMENT DECISION

November 17, 2021 | The Most Splendid Housing Bubbles in Canada “Pause” after Bank of Canada Ends QE, Starts Unwinding its Balance Sheet

Wolf Richter


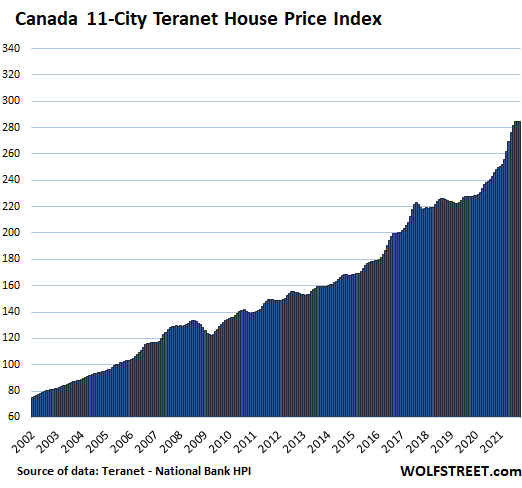
So this is something that hasn’t happened in the Canadian housing market since 2019: The Teranet-National Bank House Price Index for October, released today, failed to rise from the prior month.
The index for Vancouver, a red-hot housing market, fell for the second month in a row, something the market hasn’t seen since September 2019. The indices for Ottawa and Montreal also fell. The index for Toronto was flat for the month, as were the indices for some of the other cities.
What has changed that caused this “pause,” as it is now being called, in one of the biggest housing bubbles in the world?
The Bank of Canada got hawkish.
For a year now, the BoC has repeatedly cited the craziness in the Canadian housing market – a historic spike in home prices – the result of the BoC’s crazy asset purchases and interest rate repression.
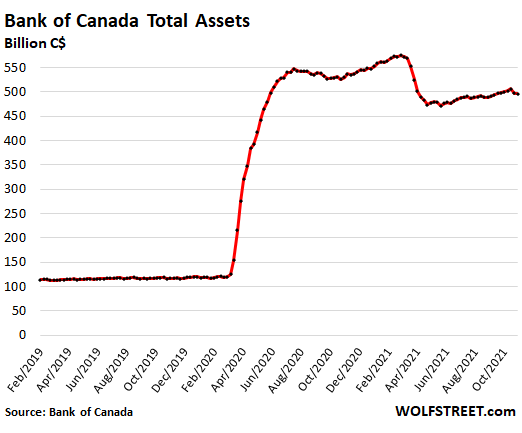
The BoC started tapering its purchases of securities a year ago by ending its MBS purchases and tapering its purchases of Government of Canada bonds. It then shed nearly all its repos and short-term Canada Treasury bills, ended other smaller programs, and tapered its GoC bond purchases multiple times. Then in October, a suddenly hawkish Bank of Canada ended QE entirely and surprised markets by moving the next rate hikes forward. Meanwhile, inflation in Canada hit an 18-year high.
Total assets on the BoC’s balance sheet, as of last week, fell to C$496 billion, down 14% from the peak in March.
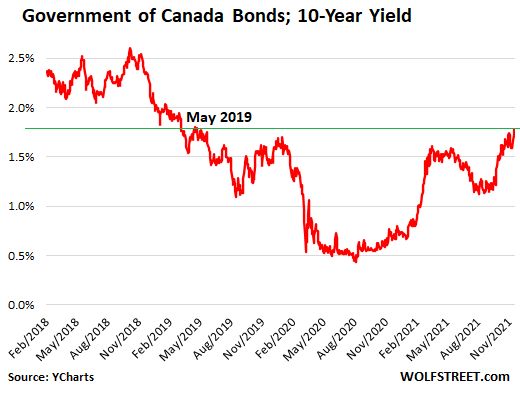
Yields of Government of Canada (GoC) bonds have risen. And banks have raised their mortgage rates in parallel. The 10-year yield of GoC bonds has tripled in the span of 12 months and hit 1.78% at the close on Monday, the highest since May 2019:
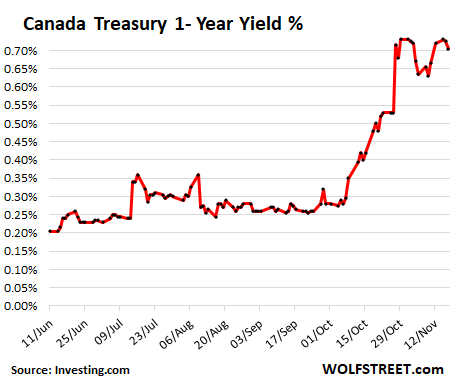
The one-year yield nearly tripled within two months, jumping from 0.26% in late September to 0.71% now:
There is a substantial lag between changes in monetary policies and changes in the housing market. But now the changes in the housing market are starting to show up.
One of the world’s biggest housing bubble starts to, well, “pause.”
In October, the overall Teranet-National Bank House Price Index, covering the 11 largest metros, edged down a tad, the first decline since October 2019, after having edged up by nearly nothing in September. The year-over-year increase got whittled down from a record 18.4% two months ago, to 15.7% in October. You can see the first flat-spot on top since 2019:
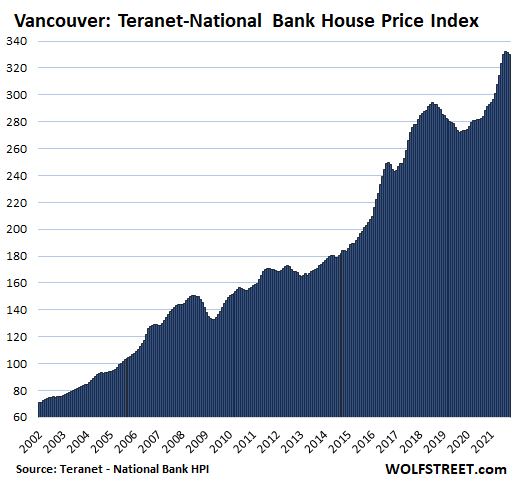
In Greater Vancouver, house prices fell by 0.4% in October from September, after having falling by 0.3% in the prior month. The BoC’s radical monetary policies starting in March 2020 turned Vancouver’s budding housing downturn that had started in August 2018 into another spike. But now the top of the spike is getting rounded off:
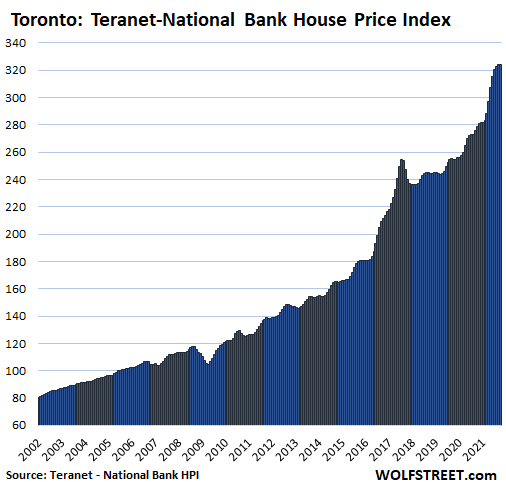
In the Greater Toronto Area, home prices were essentially flat in October compared to September, after four months in a row of ever smaller month-to-month increases. The year-over-year increase was whittled down from 18% in August to 16.3%:
The Teranet-National Bank House Price Index, by using the “sales pairs” method similar to the Case-Shiller Home Price Index in the US, compares the price of a house that sold in the current month to the price of the same house when it sold previously, tracking how many more Canadian dollars it takes to buy the same house over time, and is thereby a measure of house price inflation, which is precisely what the BoC’s radical policies have fueled. But now the BoC has made a U-Turn.
In Hamilton, Ontario, house prices rose 0.9% for the month, after having eked out a 0.3% gain in September, after the majestic spikes from February through July, topping out with a 3.8% gain in June, from May. The year-over-year gain was whittled down from over 30% in July and August to a still nutty 26% in October.
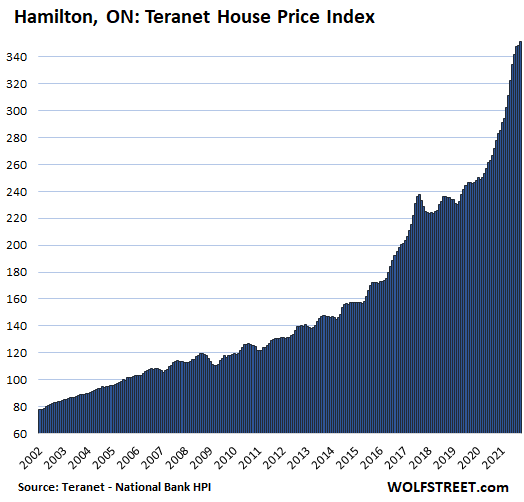
The charts here are on the same scale as Hamilton. As we go down the list, the remaining markets have smaller two-decade house price increases, resulting in larger white spaces above the curve.
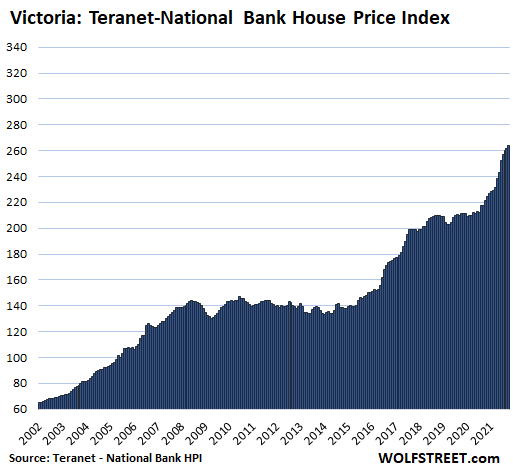
In Victoria, house prices rose 0.7% for the month, down from a 3.6% increase in June. The year-over-year increase was whittled down to a still mind-boggling 18.9%. Note how the housing market had flattened from 2018 through June 2020, when the effects of the BoC’s money-printing took effect.
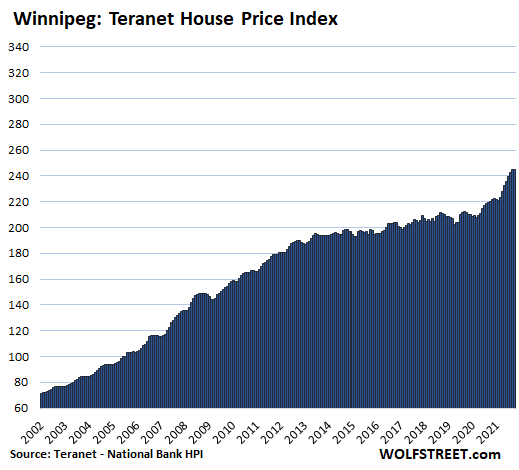
In Winnipeg, house prices remained flat in October, and were up 10.8% year-over-year, after having gone essentially nowhere following the housing boom through 2013:
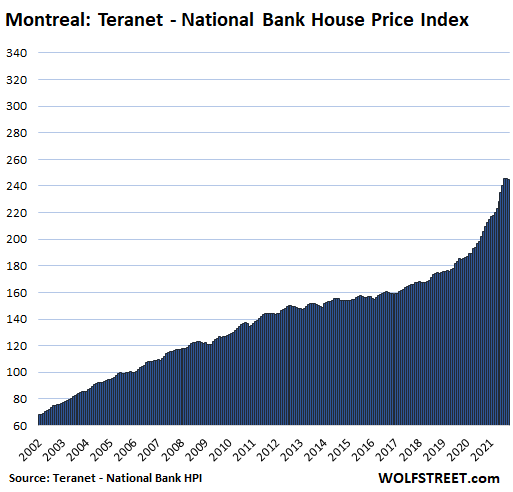
In Montreal, house prices fell by 0.2% for the month after having been flat in September. This whittled down the year-over-year gain from 21.6% in August to 17.1% in October:
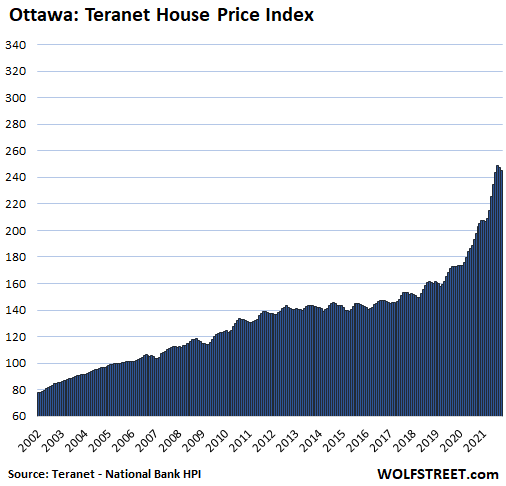
In Ottawa, house prices fell by 1.0%, the second month in a row of declines. This whittled down the year-over-year gain from 28.9% in July to a still mind-boggling 20.9% in October:
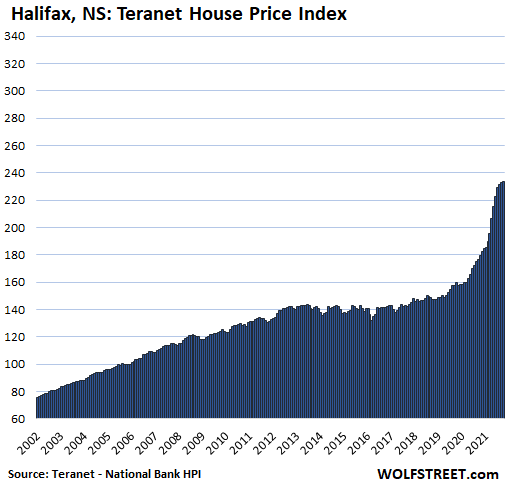
In Halifax, house prices rose 0.5% for the month, down from the crazy gain of 5.4% in April. The month-over-month gains have now declined six months in a row. This whittled down the mind-boggling 33.4% in July to a still mind-boggling 30.3% in October:
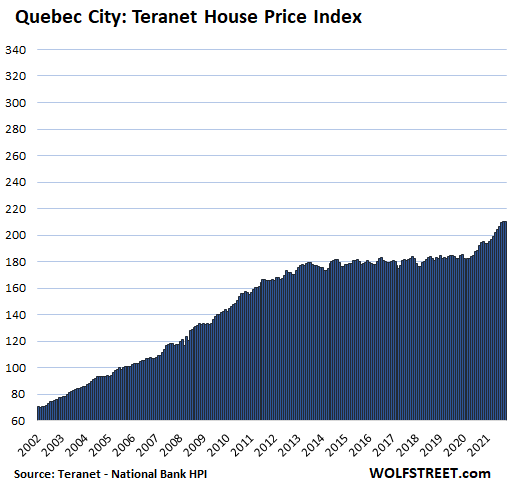
In Quebec City, house prices inched up 0.2% for the month, and were up 8.4% year-over-year.
In the oil-bust towns Calgary and Edmonton, the last two cities in the Teranet index, house prices had their bubbles during Canada’s oil boom. But since 2007, not much has happened until the BoC started its money-printing mania in March 2020, and some of it ended up in those cities.
In Calgary, house prices inched up 0.2% in October and were up 8.5% year-over-year. In Edmonton, prices inched up 0.3% for the month and were up 5.5% year-over-year. But with house prices barely above the oil-bubble peak in 2007 in Calgary and below it in Edmonton, the cities don’t qualify for inclusion in this crazy list of the most splendid housing bubbles in Canada.
STAY INFORMED! Receive our Weekly Recap of thought provoking articles, podcasts, and radio delivered to your inbox for FREE! Sign up here for the HoweStreet.com Weekly Recap.
Wolf Richter November 17th, 2021
Posted In: Wolf Street
Good article Wolf. Let’s not forget the BoC’s policies have been made much worse by the Government’s fiscal recklessness ($350 Billion deficit in 2020) and unjustifiably excessive immigration policies (record levels of immigration at a time when both the domestic unemployment rate and housing prices are extremely high). You can’t make this stuff up. Not surprisingly, the future is extremely bleak for the Bottom 95% of Canadians…