ALWAYS CONSULT YOUR INVESTMENT PROFESSIONAL BEFORE MAKING ANY INVESTMENT DECISION

November 30, 2021 | The Most Splendid Housing Bubbles in America, November Update: Another Holy-Cow Moment

Wolf Richter


“After 14 consecutive months of acceleration, the S&P CoreLogic Case-Shiller index finally took a turn,” said CoreLogic Deputy Chief Economist Selma Hepp today. But wait… Instead of spiking at a rate of 2% or more from month to month, the national index spiked by only 1.0% in the latest month, whittling down the year-over-year spike from a record 19.8% in the prior month to, well, 19.5% in today’s report.
Amid this slight overall “deceleration” of the raging mania, house prices spiked at an all-time record pace in some markets: Tampa’s 27.7% year-over-year spike and Phoenix’s 33.1% spike out-spiked even the craziest moments in those two markets at the apex of Housing Bubble 1 before it fell apart. But in some other markets, on a month-to-month basis, prices flattened for the first time in two years as the heat was being dialed down.
S&P CoreLogic ascribes this situation – this sense of slowing price spikes – in part to a typical seasonal slowdown, after there not being a seasonal slowdown a year ago, and in part to “a slow albeit welcomed return to more sustainable balance between buyers and sellers.”
The charts below depict the mind-boggling price spikes in the bubbliest metropolitan areas – the most splendid housing bubbles in America – based on the Case-Shiller Home Price Indices, released today, for “September.” The “September” data are a three-month moving average of closed sales that were entered into public records in July, August, and September. That’s the time frame of today’s data.
House price inflation. The Case-Shiller Index is based on the “sales pairs method,” which compares the sales price of a house to the price of the same house when it sold previously. It includes adjustments for home improvements. By tracking the price of the same house over time, it is a measure of house price inflation.
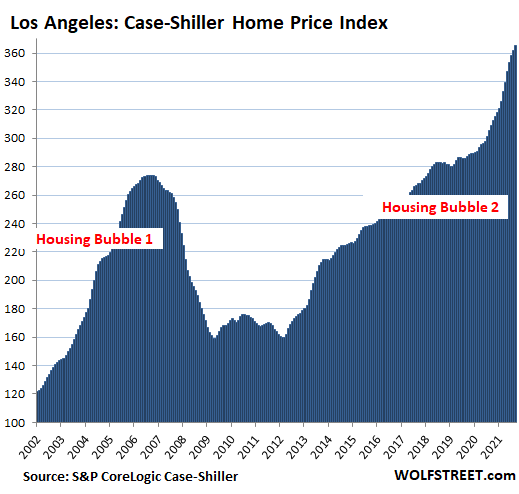
Los Angeles metro: The Case-Shiller Index for single-family houses jumped 1.1% in September from August, and by 18.3% year-over-year.
The Case-Shiller Indices are set at 100 for January 2000. The Los Angeles index value of 366 means that house prices have soared by 266% since January 2000, despite the Housing Bust in between. Over the same period, the Consumer Price Index (CPI) rose by 64%.
This 266% increase since January 2000 makes Los Angeles the most splendid housing bubble on this list. The charts below are on the same scale as Los Angeles to show the relative splendidness of house price inflation in each market since 2000.
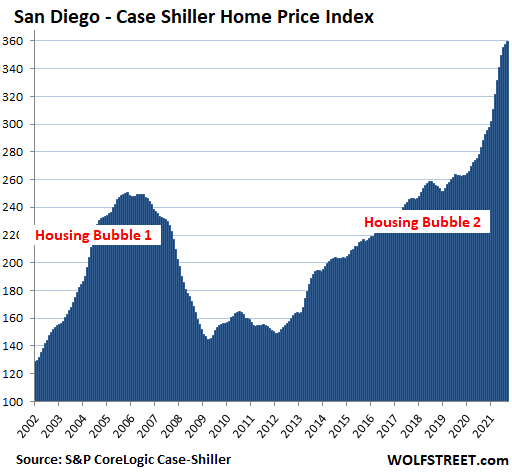
San Diego metro: House prices rose 0.7% for the month – a slowdown from the 2% to 3.4% month-to-month spikes earlier this year – which whittled down the year-over-year increase to a sizzling 25%, from an even more sizzling 27.8% at peak-heat in July. Since 2000, prices have ballooned by 260%:
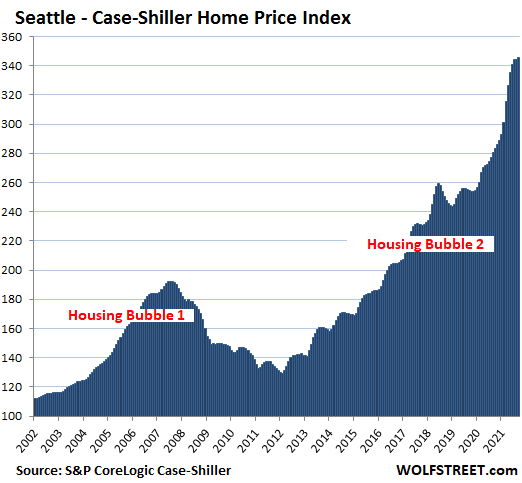
Seattle metro: House prices rose by 0.4% for the month. The past two month-to-month increases were slowest since June 2020 and whittled down the year-over-year spike to 23.3%, from 25.5% at peak-heat in July. Since January 2000, house prices have soared 246%:
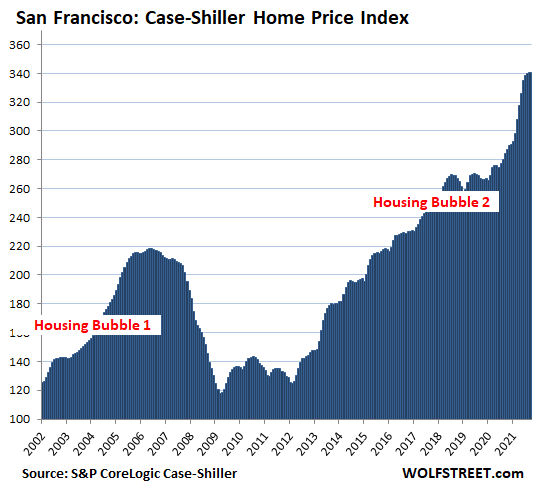
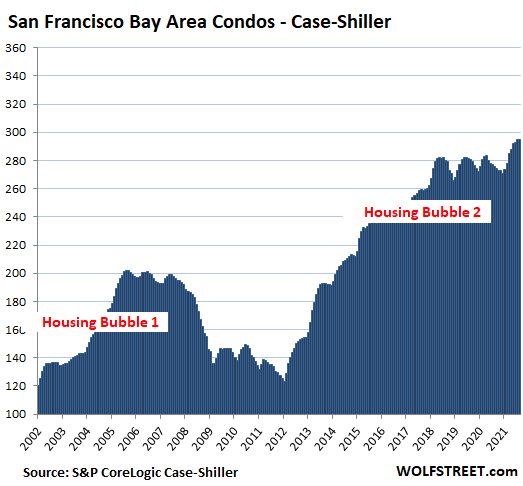
San Francisco Bay Area (five counties of San Francisco, San Mateo, Alameda, Contra Costa, and Marin): Prices of single-family houses inched up 0.1% the smallest month-to-month increase since June 2020. This whittled down the year-over-year spike to 19.8% from peak heat of 21.9% in June and July:
Condo prices in the San Francisco Bay Area, after wobbling in the same range since 2018 but then picking up over the summer, remained essentially flat in September and were up 7.1% year-over-year:
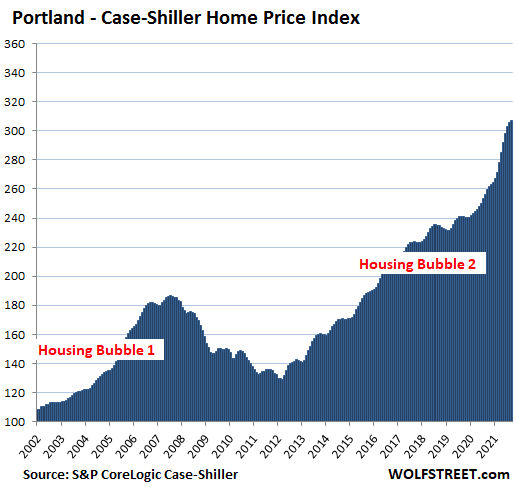
Portland metro: House prices rose 0.4%, the slowest month-to-month increase since January 2020, which whittled the year-over-year spike down to 18.2% from peak-heat 19.5% in July:
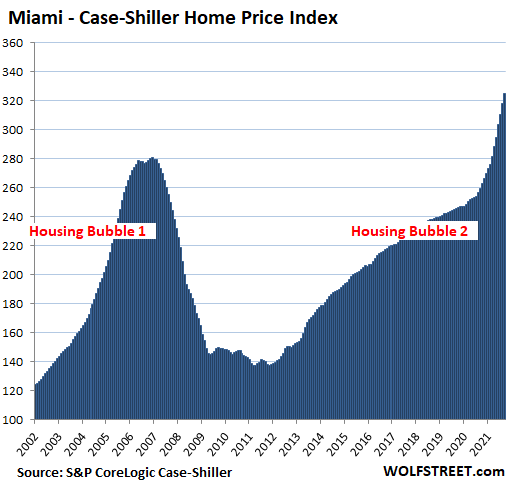
Miami metro: Prices continue to spike relentlessly, +2.2% for the month, +25.2% year-over-year, the fastest since March 2006 at the apex of Housing Bubble 1:
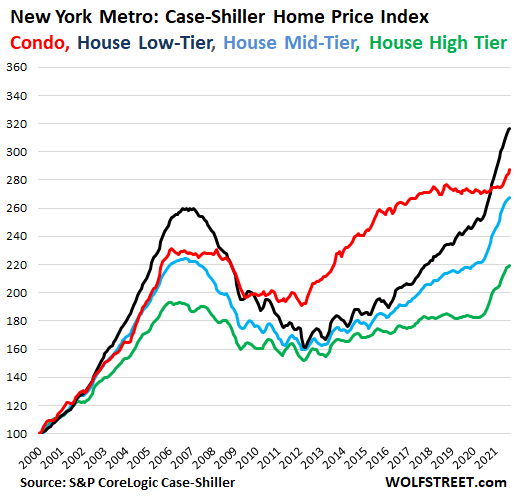
New York metro (New York City plus counties in the states of New York, New Jersey, and Connecticut): House prices overall rose 0.5% for the months and 15.8% year-over-year. But by price tiers, there were differences.
Low-tier prices have soared the most since 2011 (black line), and for the past 12 months shot up 19.0%. But they too slowed down, and month-to-month rose only 0.2%, the slowest increase since May 2020.
High-tier prices (green line) rose 0.4% for the month and 20.2% year-over-year. It took till the end of last year for high-tier prices to shoot past Housing Bubble 1.
Condo prices (red line) spent years going nowhere but in recent month heated up. In September, they rose 1.0% for the month and 5.7% year-over-year:
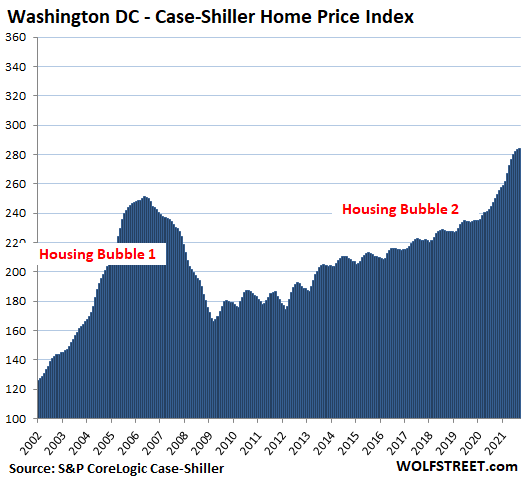
Washington D.C. metro: +0.2% for the month, the smallest increase since January 2020; +13.7% year-over-year, down from peak-heat 15.4% in June.
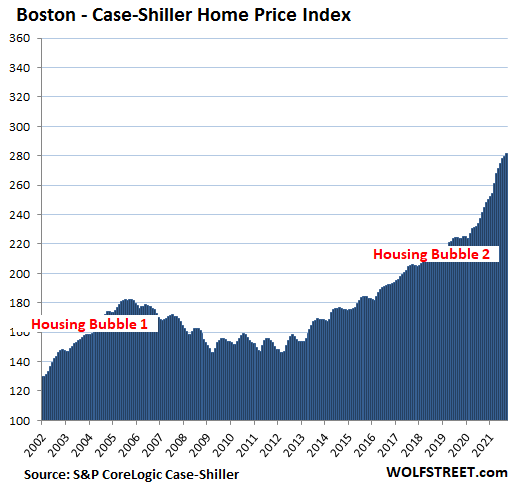
Boston metro: +0.8% for the month, +16.8% year-over-year:
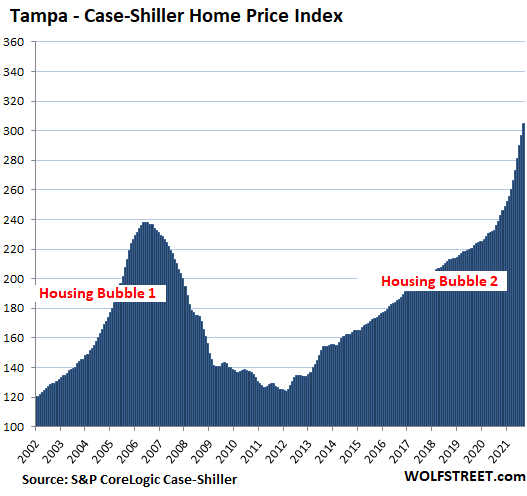
Tampa metro: +2.7% for the month, a huge spike; +27.7% year-over-year, a record spike, out-spiking even the crazy record spikes at the apex of Housing Bubble 1:
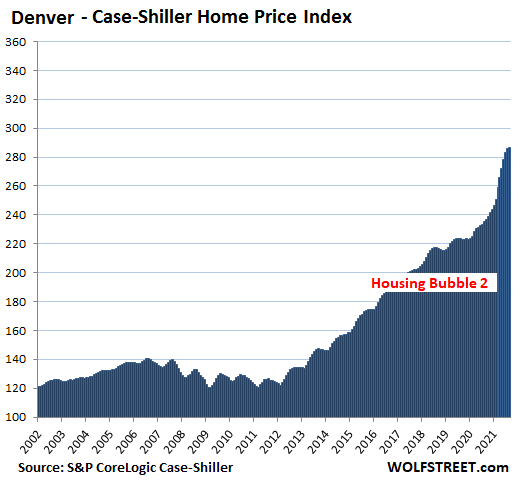
Denver metro: +0.4% for the month, +21.3% year-over-year:
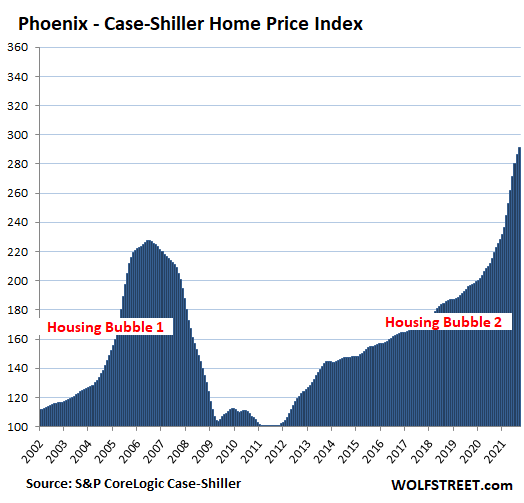
Phoenix metro: +1.7% for the month, +33.1% year-over-year, the red-hottest annual house price inflation among the most splendid housing bubbles here, and out-spiking even the craziest spikes at the apex of Housing Bubble 1. But this time, it’s different or something:
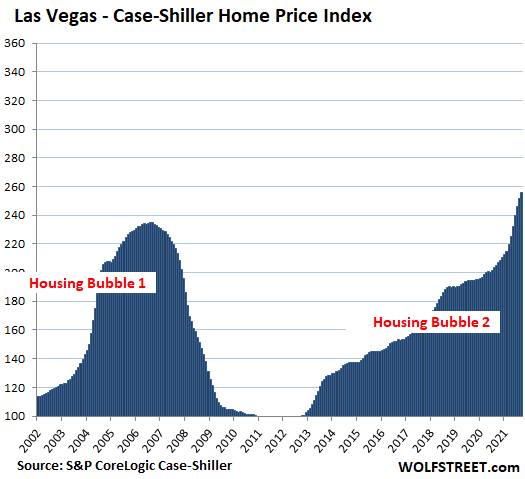
Las Vegas metro: +1.5% for the month, +24.7% year-over-year:
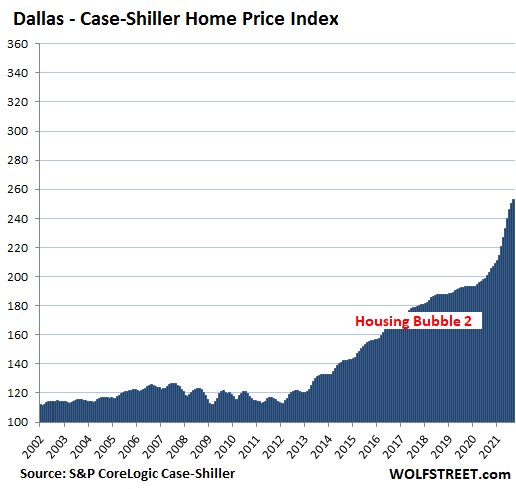
Dallas metro: +1.2% for the month, +25.0% year-over-year. The index is up 153% since 2000.
The remaining metros in the 20-metro Case-Shiller Index have house price inflation since 2000 of less than 150% and thereby don’t yet qualify for this list of the most splendid housing bubbles.
STAY INFORMED! Receive our Weekly Recap of thought provoking articles, podcasts, and radio delivered to your inbox for FREE! Sign up here for the HoweStreet.com Weekly Recap.
Wolf Richter November 30th, 2021
Posted In: Wolf Street
Next: Was 2021 the Peak for Davos »