ALWAYS CONSULT YOUR INVESTMENT PROFESSIONAL BEFORE MAKING ANY INVESTMENT DECISION

July 27, 2021 | The Most Splendid Housing Bubbles in America: July Update, Holy Moly

Wolf Richter


House prices spiked 16.6% from a year ago, the biggest increase in the data going back to 1987, according to the National Case-Shiller Home Price Index today, which was for the three-month moving average of deals entered into public records in March, April, and May. But in some cities, the raging housing mania produced far wilder results. The metros here are in order of the biggest house price inflation since the year 2000:
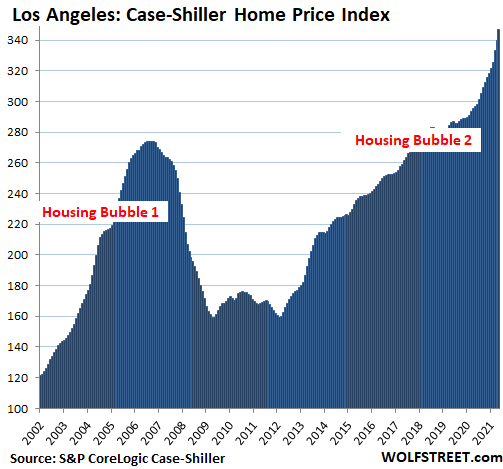
Los Angeles metro: Prices of single-family houses jumped 2.1% in May from April and 17.0% year-over-year. The Case-Shiller Indices were set at 100 for January 2000. With the index value for Los Angeles at 347 in May, house prices have soared by 247% since January 2000, despite the Housing Bust in the middle, which makes Los Angeles the most splendid housing bubble on this list.
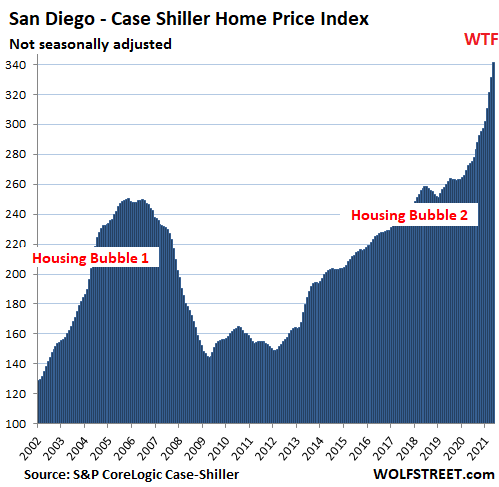
San Diego metro: The Case-Shiller index spiked 2.9% for the month and 24.7% year-over-year, the impersonation of the raging mania in the housing market. The year-over-year spike is the second hottest on this list, behind Phoenix. Prices in San Diego have skyrocketed 241% since 2000:
Sizzling “House-Price Inflation.” The Case-Shiller Index uses the “sales pairs method,” comparing the current sales price of a house to its price when it sold previously, and it includes provisions for home improvements. By tracking the amount of dollars required to buy the same house over time, the index measures the purchasing power of the dollar with regards to houses; it’s a measure of house price inflation.
All charts here are on the same scale as Los Angeles to show the relative heat of house price inflation in each market since 2000.
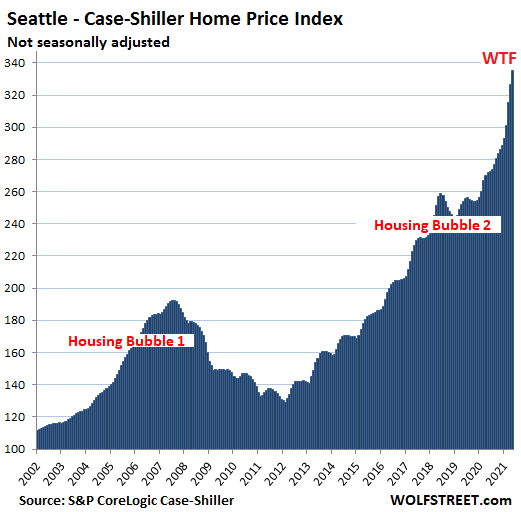
Seattle metro: House prices jumped 2.8% in May, and 23.4% year-over-year year, the third-hottest raging-mania annual house price inflation on this list. Since January 2000, house prices have soared 235%:
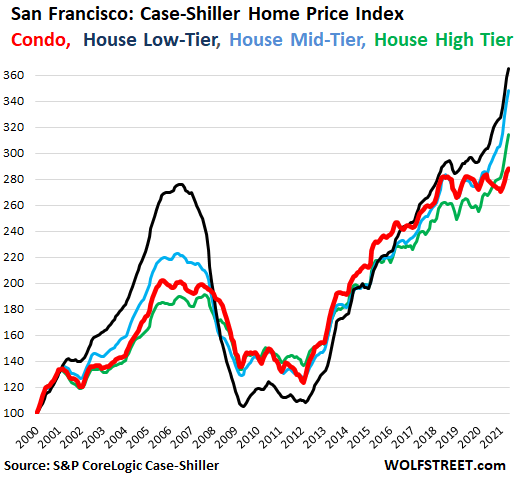
San Francisco Bay Area Houses and Condos: The Case-Shiller Index for “San Francisco” covers the five counties of San Francisco, San Mateo, Alameda, Contra Costa, and Marin.
Overall house prices spiked by 2.6% for the month, 18.2% year-over-year, and 218% since 2000. But by price tiers, prices in the “low tier” spiked by 20.2% year-over-year and are up 265% from January 2000 (black line). Prices in the mid-tier jumped by 22.1% year-over-year (light blue line); both far surpassed the increase in the high tier, up 17.1% year-over-year (green line).
Condo prices, however, have been waffling along since April 2018, not going anywhere. Here’s my detailed look at this split in the San Francisco market. Condos are denoted by the red line.
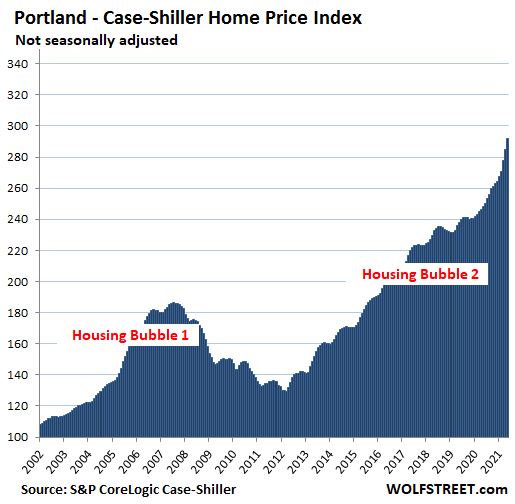
Portland metro: House prices spiked 2.4% for the month and 17.5% year-over-year, and are up 192% since 2000:
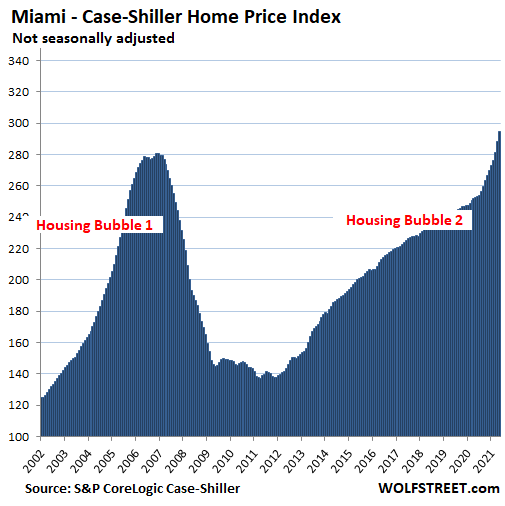
Miami metro: House prices spiked 2.4% for the month and 16.6% year-over-year. Prices are up 187% since 2000:
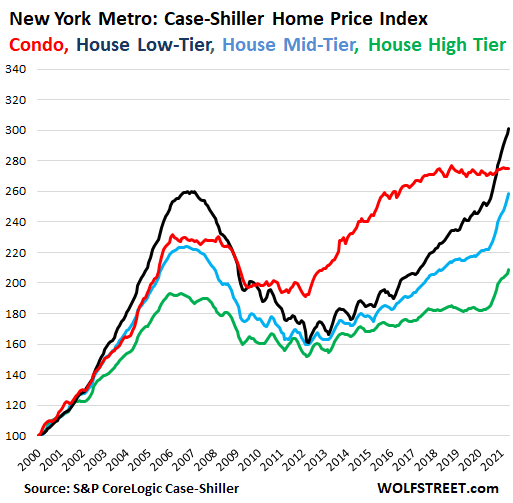
New York City metro, Condos and Houses by price tiers: This vast metro, which includes New York City and counties in the states of New York, New Jersey, and Connecticut, has some of the most expensive housing pockets in the US, such as Manhattan but also much less expensive areas.
Prices of condos – heavily concentrated in New York City, particularly Manhattan – were flat for the month and have been at about the same level since February 2018. The high was in October 2018 (red line).
Low-tier house prices have spiked since last summer, and are up 20.0% year-over-year.
High-tier house prices also spiked recently and are up 14% year-over-year, after stalling for three years (green line):
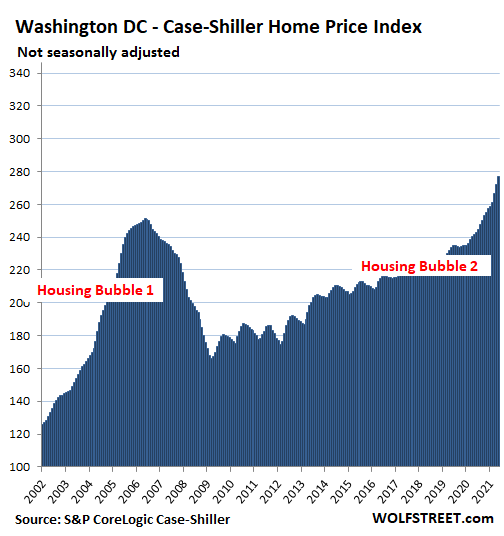
Washington D.C. metro: House prices jumped 1.7% in May and 14.8% year-over-year:
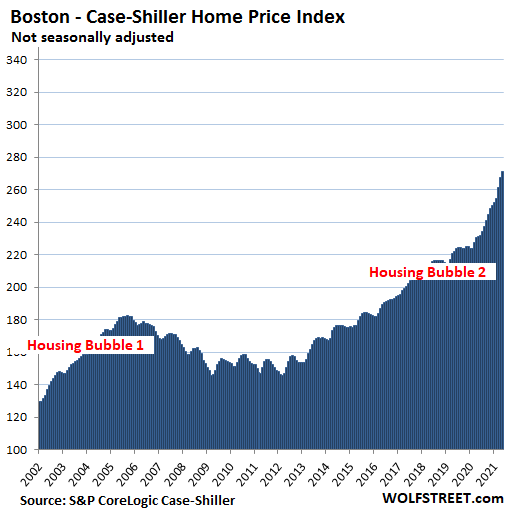
Boston metro: House prices jumped 1.4% for the month and 18.0% year-over-year.
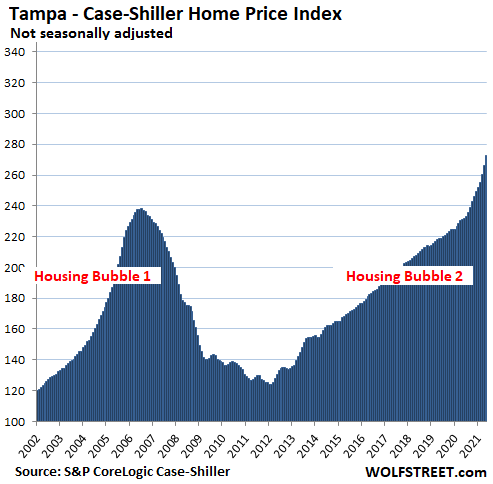
Tampa metro: House prices jumped 2.5% for the month and 18.0% year-over-year:
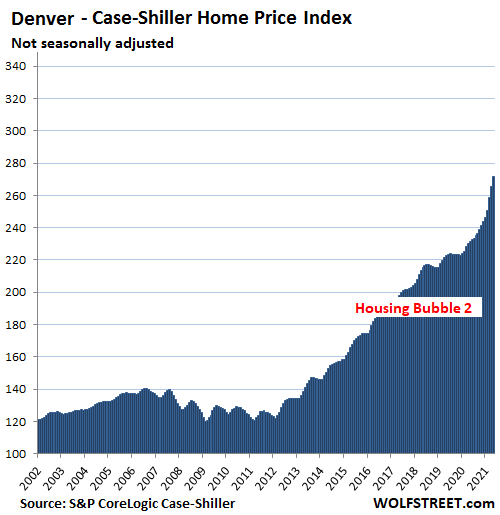
Denver metro: House prices jumped 2.2% in May and 17.4% year-over-year:
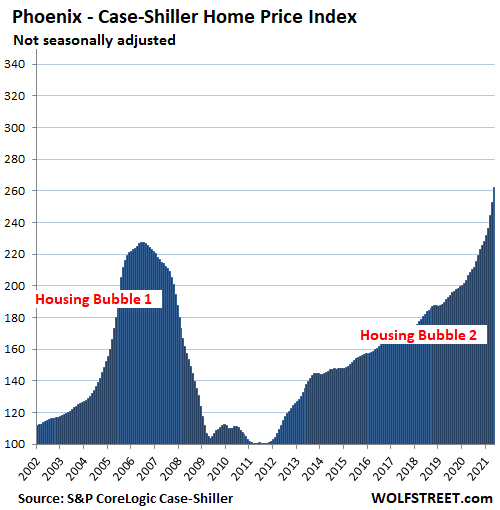
Phoenix metro, raging mania exemplified: House prices spiked 3.7% in May and 25.9% year-over-year, and the hottest annual house price inflation among the Most Splendid Housing Bubbles here:
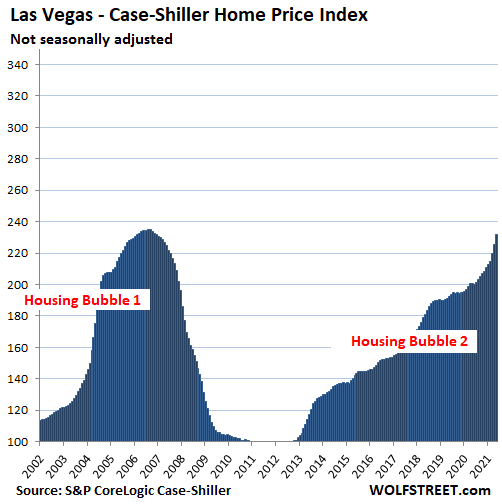
Las Vegas metro: House prices jumped 2.9% for the month and 15.5% year-over-year:
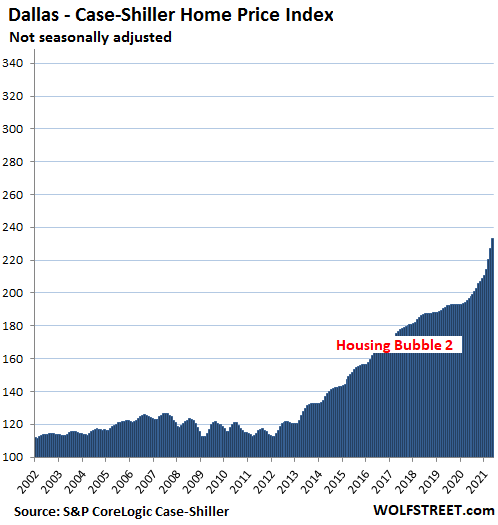
Dallas metro: House prices spiked 2.9% for the month and 18.5% year-over-year. The index is up 133% since 2000. In the remaining cities in the 20-city Case-Shiller Index, the two-decade house price inflation has been less hot. While house prices in Los Angeles jumped by 247% since January 2000, and in Dallas by 133%, over the same period, the Consumer Price Index, one-third of which pretends to cover housing, rose by 61%.
STAY INFORMED! Receive our Weekly Recap of thought provoking articles, podcasts, and radio delivered to your inbox for FREE! Sign up here for the HoweStreet.com Weekly Recap.
Wolf Richter July 27th, 2021
Posted In: Wolf Street
Next: Get over it »