ALWAYS CONSULT YOUR INVESTMENT PROFESSIONAL BEFORE MAKING ANY INVESTMENT DECISION

June 17, 2021 | The Most Important Chart in Gold Right Now
Sean Brodrick


We saw a lot of hullaballoo in precious metals yesterday.
Shiny gold and silver babies got thrown out with the bathwater as a majority of Fed governors said they might/kinda/sorta start thinking about hiking benchmark interest rates by the end of 2023 rather than waiting until 2024, as had been the plan.
That’s short-term noise. What you should be watching is this chart — a chart of the price of gold versus real interest rates.
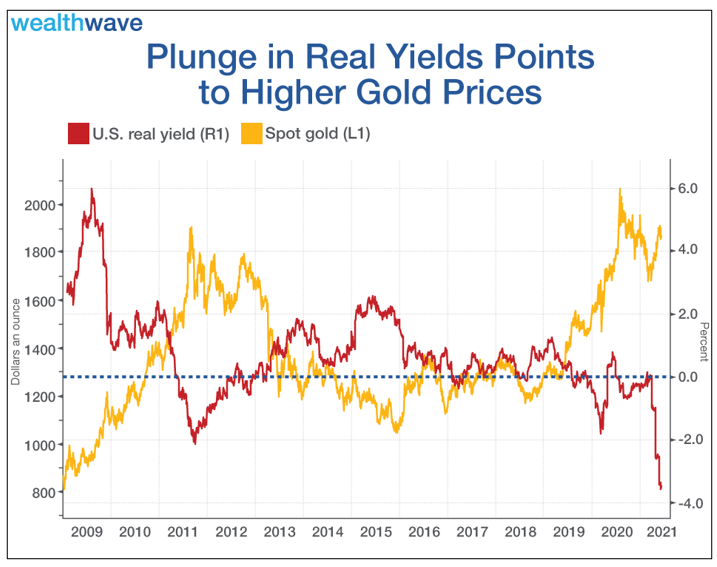 |
The real interest rate yield is calculated using the 10-year U.S. Treasury yield, adjusted for inflation. As you probably know, inflation is running red hot. It printed at 5% in May, up from 4.2% in April.
10-year Treasury yields are currently at 1.56%. This means that the real yield is nearly NEGATIVE 3.5%, as you can see on the chart.
Why is this important? We’ve seen lower 10-year yields — most notably last year, during the pandemic crisis. But we’ve never seen such low yields when inflation is so hot.
One of the complaints that bears make against gold is that it doesn’t pay interest. Well, with negative real yields, the advantages of Treasurys have plunged off a cliff. In such circumstances, gold tends to shine.
In fact, history shows us that when real yields go down, gold goes up, and when real yields go up, gold goes down. You can see it on the chart above.
However, real yields have recently plunged. And that hasn’t been reflected in the price of gold … YET!
I believe a big adjustment is coming in the gold price, and sooner than later.
That’s one factor. Another long-term factor is a looming supply/demand squeeze as low prices have suppressed gold exploration for years.
Another factor is newer and forced pent-up consumer demand in Asia. People in India and China have a cultural affinity for gold. They spent much of last year stuck at home, unable to buy. When those consumers get back to the gold market, it could be explosive.
Still, the most important force is probably that chart. Keep your eye on it. Gold may zig and zag and get buffeted by short-term market noise. But major forces are lining up to push gold to $2,000 an ounce or higher this year.
Get ready. It’s going to be a wild ride.
All the best,
Sean
STAY INFORMED! Receive our Weekly Recap of thought provoking articles, podcasts, and radio delivered to your inbox for FREE! Sign up here for the HoweStreet.com Weekly Recap.
Sean Brodrick June 17th, 2021
Posted In: Wealth Wave