ALWAYS CONSULT YOUR INVESTMENT PROFESSIONAL BEFORE MAKING ANY INVESTMENT DECISION

February 10, 2021 | Dollar’s Purchasing Power Drops to Record Low, Despite Aggressive “Hedonic Quality Adjustments”

Wolf Richter


The “Purchasing Power of the Consumer Dollar” – part of the Bureau of Labor Statistics’ Consumer Price Index data released today – is the politically incorrect mirror image of inflation in consumer prices, as measured by the Consumer Price Index (CPI). By wanting to increase consumer price inflation, the Fed in effect wants to decrease the purchasing power of the consumer dollar, to where consumers have to pay more for the same thing. Thereby it wants to decrease the purchasing power of labor paid in those dollars.
And that purchasing power of the dollar in January dropped by 1.5% year-over-year to another record low:
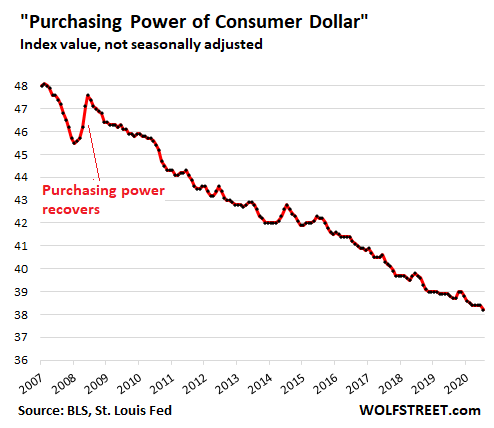
Note how the purchasing power of the dollar recovered for a few months during the Financial Crisis, when consumers could actually buy a little more with the fruits of their labor. The Fed considered this condition a horror show.
Inflation in durable goods, non-durable goods, and services.
The overall CPI for urban consumers, the politically correct way of expressing the decline in the purchasing power of the dollar, rose 1.4% in January, compared to a year earlier.
Each product that is in the basket of consumer goods tracked by the CPI has its own specific CPI. And all these products fall into three categories: durable goods (black line), nondurable goods (green line), and services (red line), with services accounting for 60% of the overall CPI. Here they are, with discussions below:
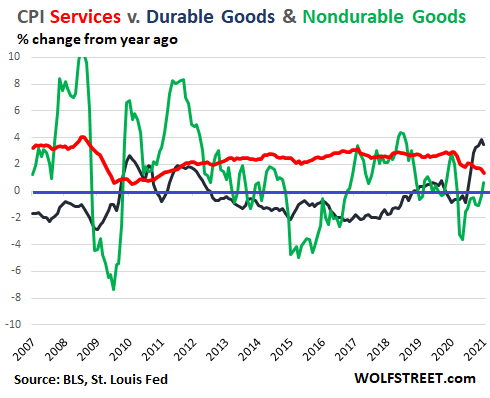
The CPI for services (red line) – everything from rent to airfares – increased mostly between 2% and 3% year-over-year for the last decade, but dropped during the Pandemic as demand for services such as hotels, flights, and cruises collapsed. For example, in January, year-over-year, the CPI for:
- Airline tickets: -21.3%
- Hotels: -13.3%
- Admission to sporting events: -21.4%.
The CPI for nondurable goods (green line) is driven by the volatile categories of food and energy. Energy prices, such as gasoline, plunged in earlier in 2020 as demand collapsed, but started to rise months ago. Food prices too are rising. In January, the CPI for nondurable goods was up 0.7% from a year ago, after having been down 3.6% year-over-year in May.
The CPI for durable goods (black line) has spiked in recent months on a year-over-year basis amid a surge in demand for some durable goods. In January, it was up by 3.5% from a year ago The past three months have been the steepest year-over-year increases since 1995.
The ironic element here is that CPI for durable goods declined for much of the past 20 years though new cars and used cars and smartphones and a million other things have gotten more expensive. The decline was in part due to aggressive “hedonic quality adjustments” – we’ll get to those in a moment – which remove the costs of quality improvements from the CPI.
New and used vehicles and “hedonic quality adjustments.”
New and used vehicles account for 16% of the CPI for durable goods.
Prices of new vehicles have soared over the years. The industry measure of “average transaction price” indicates how much money consumers spent on average per new vehicle, a function of price increases and a greater percentage of high-dollar vehicles in the mix. In January, per J.D. Power, the average transaction price soared by 11% from a year ago (to $37,165).
But the CPI for new vehicles in January ticked up by just 1.3% from a year ago.
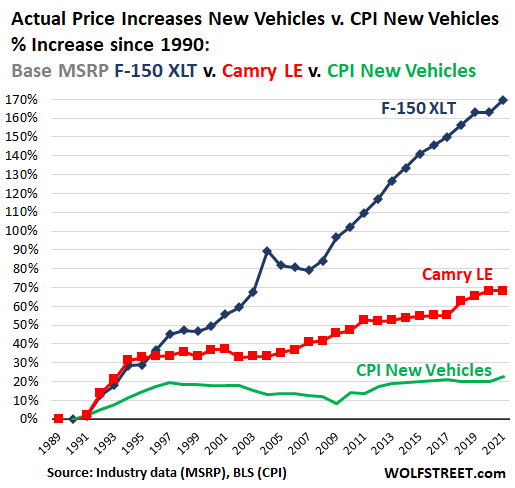
To demonstrate how silly the CPI for new vehicles is compared to what consumers actually pay for new vehicles, I constructed the WOLF STREET “Pickup Truck & Car Price Index,” which takes the Manufacturer’s Suggested Retail Price (MSRP) by model year of the best-selling truck and of the best-selling car over the decades and compares them to the CPI for new vehicles. The discounts and incentives are there every year and so cancel out when comparing year-over-year price increases.
Since 1990, the CPI for new vehicles has risen by 22.5% (green line). Over the same period, the base MSRP of the Toyota Camry LE has soared 68% (red line); and the base MSRP of the Ford F-150 XLT has skyrocketed 170% (blue line):
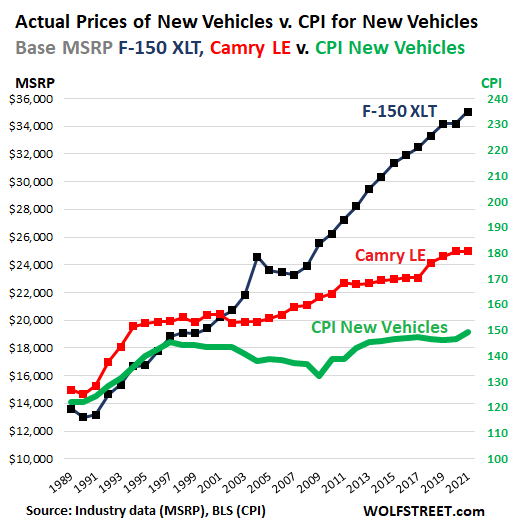
In dollars terms, since 1990: The Camry LE base MSRP rose from $14,658 to $24,970; the F-150 XLT base MSRP rose from $12,986 to $35,050; and the CPI for new vehicles rose from an index value of 121.9 to a value of 149.4, and stunningly is today just a tad above where it had been 23 year ago in January 1997:
A big part of the difference between actual price increases and the CPI for new vehicles are the “hedonic quality adjustments” that started to be applied with increasing aggressiveness in the late 1990s through today. The logic is that vehicles have gotten a lot more sophisticated over those years, for example, going from three-speed automatic transmissions to 10-speed computer-controlled transmissions. The hedonic quality adjustments remove the costs of these quality improvements from the CPI.
Even if this is calculated properly, without a political agenda to distort CPI downward, it puts the consumer in a bind because at the lower 60% of the income scale, wages have barely kept up with the overall CPI, but have not nearly kept up with the price increases deemed to be due to quality improvements.
Consumers have responded to these price increases by buying fewer new vehicles, switching from new to used vehicles, driving vehicles for longer, from 8.9 years on average in 2000 to 11.9 years in 2020, and financing them for longer, with seven-year auto loans now being all the rage.
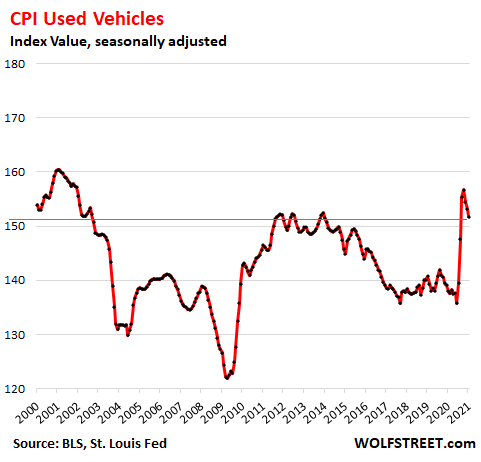
The CPI for used vehicles is also subject to these hedonic quality adjustments. So the same scenario is playing out here. But, but, but… among the distortions of the Pandemic was a sudden and historic spike in used vehicle prices over the summer that couldn’t be removed with hedonic quality adjustments. In January, the CPI for used vehicles was still up 10% from a year ago. Despite the huge spike in the CPI, the index level is still below where it had been 20 years ago in 2000-2002:
These aggressive hedonic quality adjustments make sure that CPI, and particularly the durable goods CPI, do not reflect actual price changes that consumers face. Consumers understand that they’re getting a better product that costs more to manufacture. But that doesn’t mean that they have the money to buy a new truck, when years earlier consumers with an equivalent income did have the money to buy a new truck.
STAY INFORMED! Receive our Weekly Recap of thought provoking articles, podcasts, and radio delivered to your inbox for FREE! Sign up here for the HoweStreet.com Weekly Recap.
Wolf Richter February 10th, 2021
Posted In: Wolf Street
Next: Unemployment & Velocity »