ALWAYS CONSULT YOUR INVESTMENT PROFESSIONAL BEFORE MAKING ANY INVESTMENT DECISION

December 28, 2020 | The Most Splendid Housing Bubbles in America: December Update on House Price Inflation Gone Wild

Wolf Richter


Prices of single-family houses jumped 8.4% in the US, the biggest year-over-year jump since March 2014, according to the Case-Shiller Home Price Index for October, released today. The index is based on the “sales pairs” method, comparing the price of a house that sold in the current month to the price of the same house when it sold previously, going back decades. By comparison, the National Association of Realtors’ house price index, which is based on “median prices,” has skyrocketed 15%. In this terrible economy with 9 million to 20 million people out of work, house prices have been fired up by record low interest rates, the $3 trillion the Fed has handed the markets, the shift of working from home and not wanting to live in an apartment or condo tower, and by a dose of panic-buying.
Los Angeles – the most splendid housing bubble of them all:
House prices in the Los Angeles metro rose by 1.1% in October from September and by 8.4% year-over-year, which put them 14.1% above the peak of the insane Housing Bubble 1. The Case-Shiller index was set at 100 for January 2000 across all 20 cities it covers. Today’s index value for Los Angeles of 312 means that house prices in the metro have more than tripled since January 2000 (+212%), making it the most splendid housing bubble on this list.
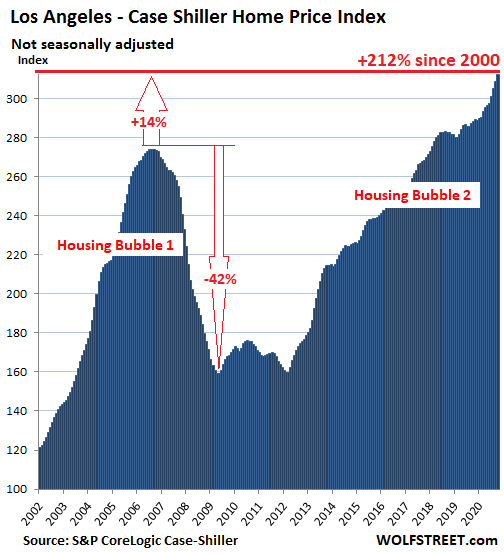
Today’s release of the Case-Shiller Home Price Index, named “October,” is a rolling three-month average of closings that were entered into public records in August, September, and October.
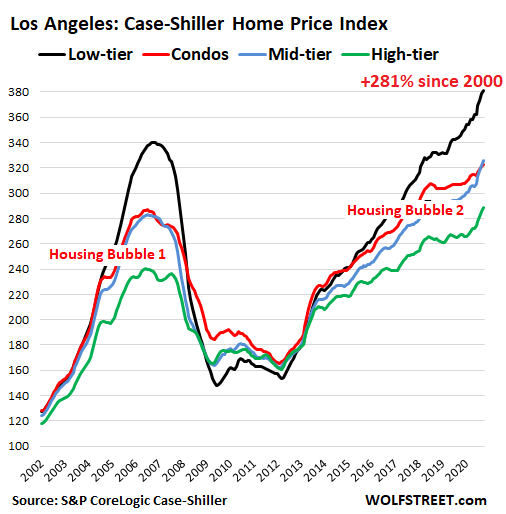
The Case-Shiller Index provides sub-indices for some cities. For Los Angeles, in addition to overall house prices, it provides data on condos, and for high-, mid-, and low-tier house prices.
Prices in the low-tier segment (black line) jumped 10.4% year-over-year and have nearly quadrupled since January 2000 (+281%). During Housing Bubble 1, this segment surged the most, and during the Housing Bust, it collapsed the most (-56%). High-tier prices (green line) jumped 8.0% year-over-year and are up 188% from January 2000. Condo prices (red line) have been increasing at the slowest rate of the four categories (0.5% month-over-month and 5.0% year-over-year):
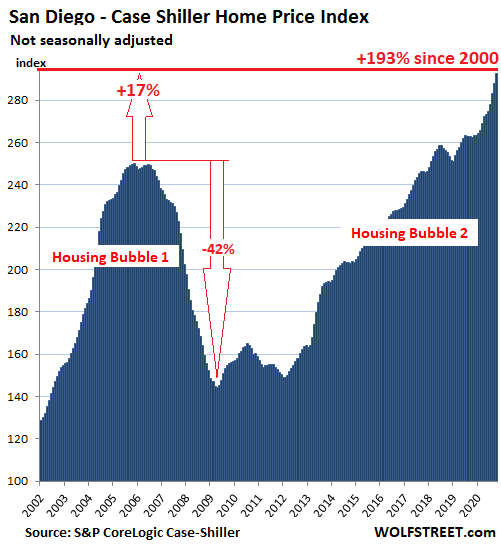
San Diego:
House prices in the San Diego metro jumped 1.7% in October from September and by 11.6% from a year ago, having nearly tripled (+193%) since 2000:
This is “House-Price Inflation”: The Dollar lost purchasing power faster.
The Case-Shiller Index – by comparing the sales price of a house in the current month to the price of the same house when it sold previously – tracks the amount of dollars it takes to buy the same house over time, thereby measuring the purchasing power of the dollar with regards to houses. This makes the Case-Shiller Index a measure of “house-price inflation.” And what we’re looking at is the phenomenon that the dollar has lost purchasing power with regards to houses at the fastest rate in years.
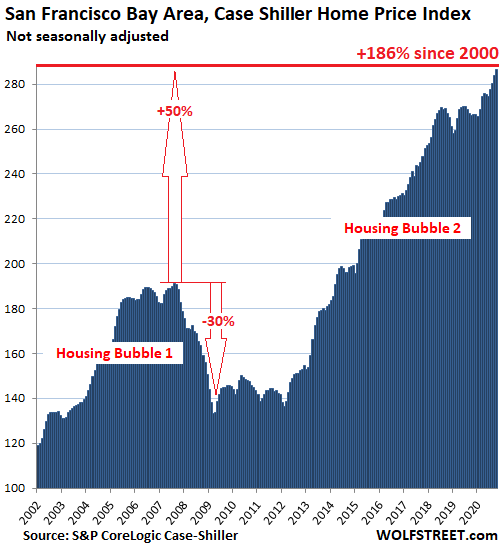
San Francisco Bay Area:
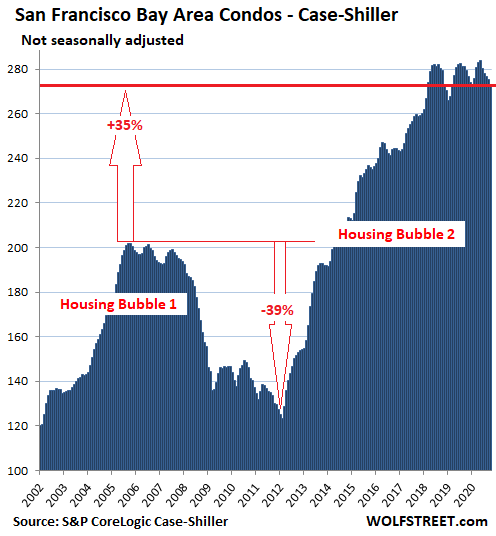
The Case-Shiller Index for “San Francisco” – the Bay Area counties of San Francisco, San Mateo (northern part of Silicon Valley), Alameda and Contra Costa (East Bay), and Marin (North Bay) – rose 0.9% in October from September and was up 7.7% from a year ago. The index is up 50% from the crazy peak of Housing Bubble 1 and has nearly tripled since 2000:
San Francisco Condo Malaise:
But condo prices in the five-county Bay Area fell for the fifth month in a row and are down 2.3% from a year ago, and below where they’d first been in March 2018, amid a historic all-time record condo glut in San Francisco itself:
Seattle:
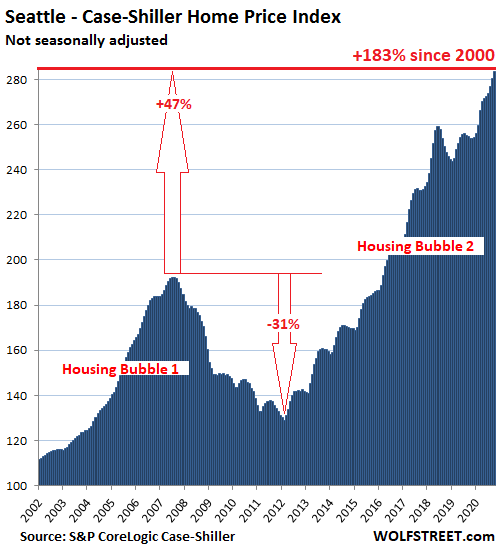
In the Seattle metro, house prices jumped 1.1% in October from September and 11.7% year-over-year, having surged 47% since the peak of Housing Bubble 1:
New York metro condos:
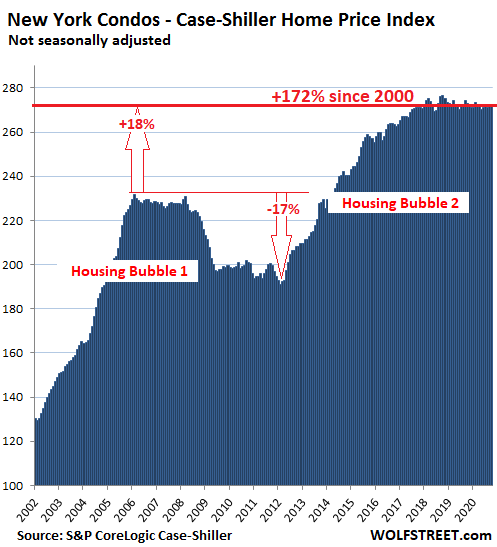
Not to be confused with Manhattan condos that are now undergoing a reckoning, Case-Shiller’s index for New York City condos includes all of New York City plus numerous counties in the states of New York, New Jersey, and Connecticut “with significant populations that commonly commute to New York City for employment purposes.” In these vast and diverse markets, the index for condos has essentially been flat since late 2017 and is down a smidgen year-over-year and from the peak in October 2018:
Miami:
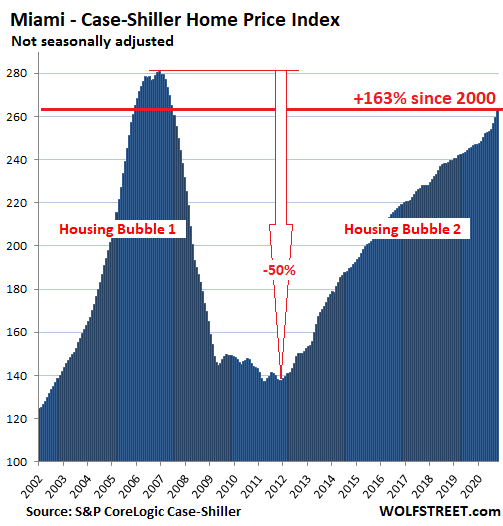
The Case-Shiller index for the Miami metro jumped by 1.5% in October from September and by 6.8% year-over-year, pulling within 6.1% of its totally crazy peak of Housing Bubble 1:
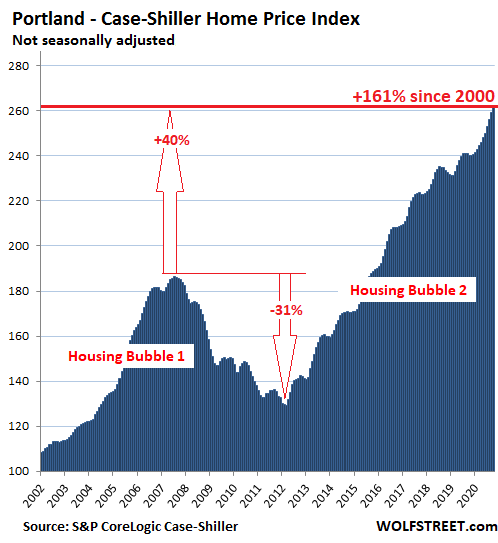
Portland:
House prices in the Portland metro rose 0.7% in October from September and 8.9% from a year earlier:
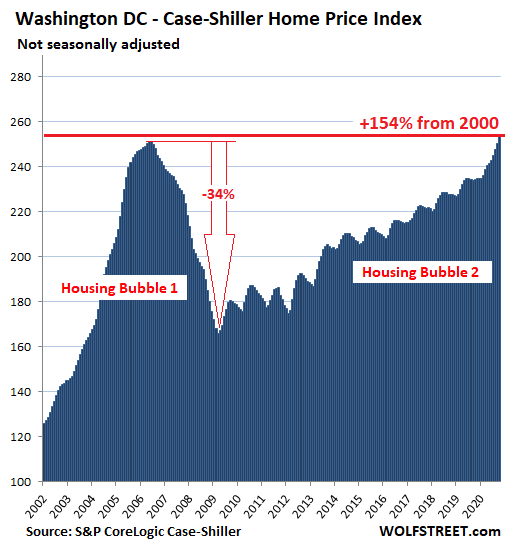
Washington D.C.:
The Case-Shiller Index for the Washington D.C. metro rose 1.3% in October from September and was up 8.2% year-over-year and thereby finally surpassed the crazy peak of Housing Bubble 1, hallelujah:
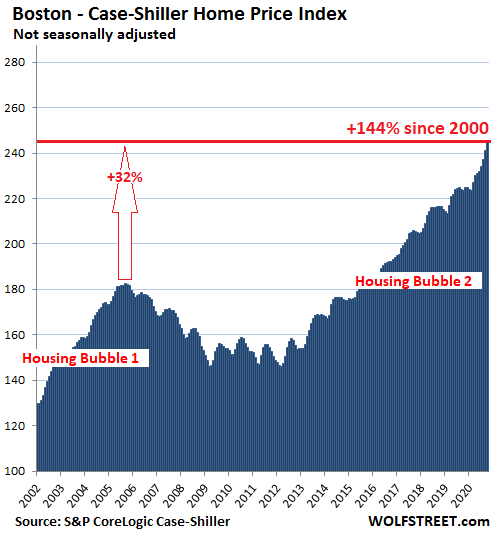
Boston:
The index for the Boston metro rose 1.5% in October from September and 9.4% year-over-year:
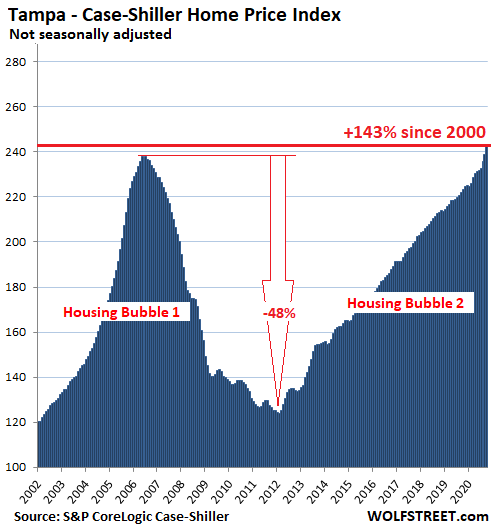
Tampa:
House prices in the Tampa metro rose 1.6% in October from September and 8.6% from a year earlier, and are now 1.6% above the crazy peak of Housing Bubble 1:
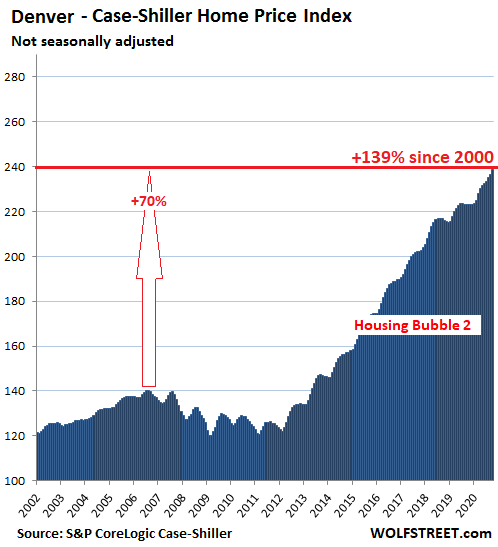
Denver:
The index for the Denver metro rose 0.9% in October from September and 7.0% year-over-year:
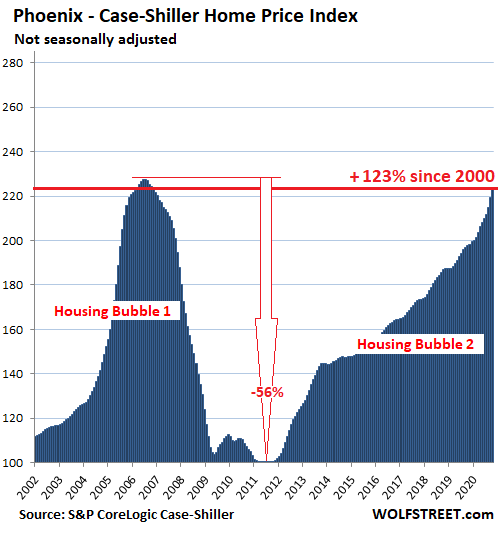
Phoenix:
For the Phoenix metro, the index rose 1.7% in October from September and 12.7% year-over-year, making it the market with the currently hottest house price inflation on this list of Splendid Housing Bubbles, ahead of San Diego (11.6%) and Seattle (11.7%). And prices almost caught up with the crazy peak of Housing Bubble 1:
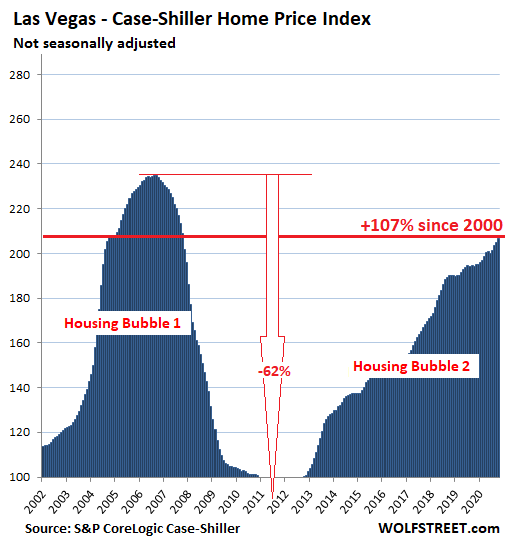
Las Vegas:
The index for the Las Vegas metro rose 0.8% in October from September and 6.4% year-over-year, but remains 12% below the crazy peak of Housing Bubble 1:
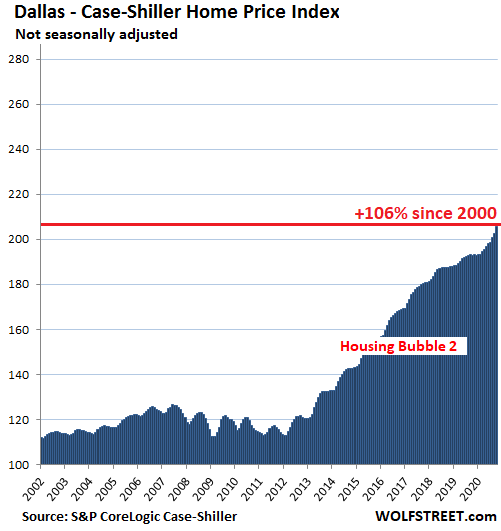
Dallas:
House prices in the Dallas metro – counties of Collin, Dallas, Delta, Denton, Ellis, Hunt, Johnson, Kaufman, Parker, Rockwall, Tarrant, and Wise – jumped 1.4% in October from September and 6.5% year-over-year, having more than doubled since 2000.
This makes the Dallas metro the tail light of the Most Splendid Housing Bubbles in America, with the remaining markets of the 20-City Case-Shiller Index not having reached that point yet where it takes over twice as many dollars to buy the very same house than it took 20 years ago.
STAY INFORMED! Receive our Weekly Recap of thought provoking articles, podcasts, and radio delivered to your inbox for FREE! Sign up here for the HoweStreet.com Weekly Recap.
Wolf Richter December 28th, 2020
Posted In: Wolf Street