ALWAYS CONSULT YOUR INVESTMENT PROFESSIONAL BEFORE MAKING ANY INVESTMENT DECISION

August 2, 2020 | Wealth Wave 3 More Charts for Gold Bulls

Sean Brodrick


Happy weekend!
It’s been another wild week for gold. What’s the next move for smart investors? I have a few ideas.
First, we should look at some charts.
Chart No. 1: The New Bull Market
Wall Street is finally, FINALLY waking up to the fact that gold is in a new bull market. Still, the white shoe crowd on Wall Street is far too tepid on gold’s boiling potential.
You really only understand that by knowing that gold is cyclical. Here’s a chart showing the cyclical nature of gold …
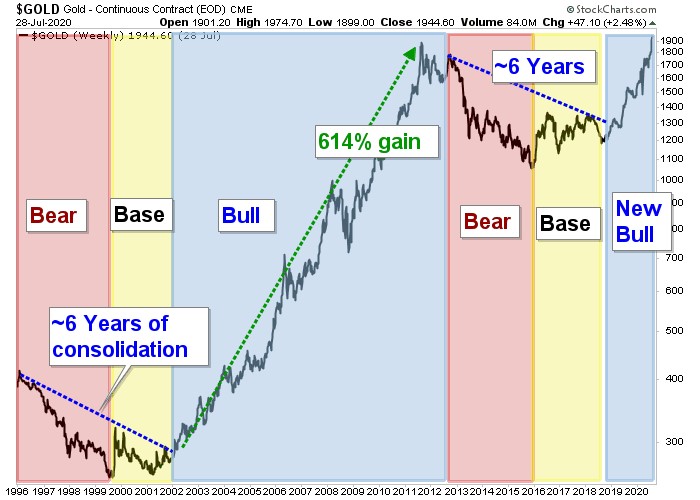 |
Gold follows regular patterns of bear and bull markets, with basing patterns between. Bull markets in gold tend to be longer and go further than bear markets. The last big bull market lasted a decade — and sent the metal higher by 614%.
Fast forward to today. The new bull market started in 2018. So far, we’ve seen the yellow metal gain a little over 60%.
So, can gold go higher?
Bank on it!
In fact, I have another chart showing that gold is cheap.
Chart No. 2: Inflation-Adjusted Gold
On Thursday, I showed you how the smart money is piling into gold. Some might say they’re buying near the top. And they are … in nominal terms.
But when adjusted for inflation …
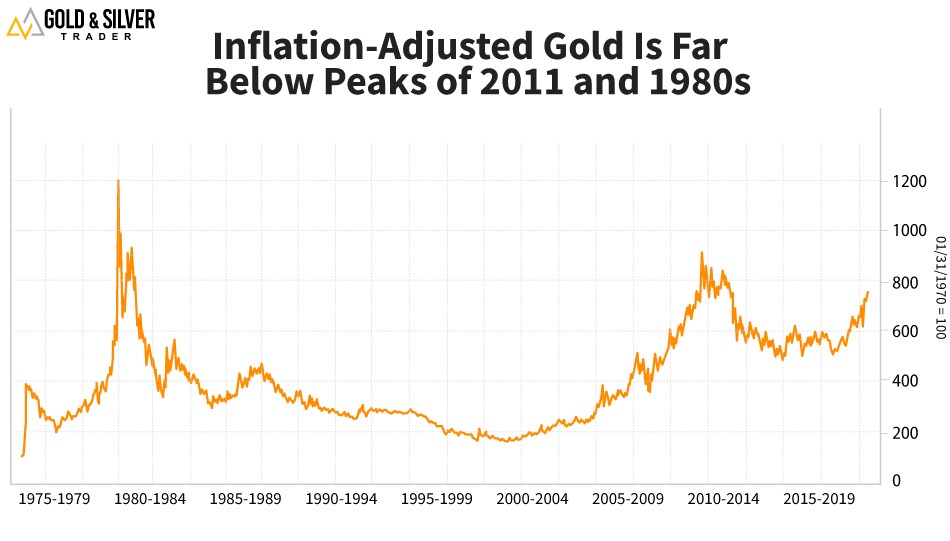 |
… you can see that gold isn’t back to the peak it made back in 2011 … and it’s not even close to the peaks it made back in the 1980s.
In other words, plenty of investors still think they’re getting a bargain. And they’re right!
So, what’s the best way to invest in gold?
Well, let’s look at one more chart first.
Chart No. 3: Miners Outperform Gold
This is a performance chart. It shows the percentage gains since the bottom in March.
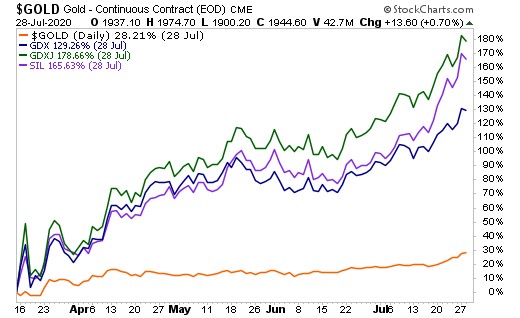 |
Gold is up 28.2%. Good!
The VanEck Vectors Gold Miners ETF (NYSE: GDX, Rated B-), a basket of leading gold producers, is up 129.26%. Nice!
But compare that to the Global X Silver Miners ETF (NYSE: SIL, Rated C), which is up 165.63%. Wow!
And it’s still not the top performer on this chart. That title belongs to the VanEck Vectors Junior Gold Miners ETF (NYSE: GDXJ, Rated B-). It’s up an astounding 178.66%!
This chart is showing us that miners far outperform the metal. That’s because miners are leveraged to the underlying metal. Their cost of pulling an ounce of gold out of the ground changes much more slowly than the price they receive for that gold. As gold moves higher, miners’ profit margins widen and widen.
And this leverage allows you to aim for bigger and bigger gains, even with a small increase in gold price. ANY of the ETFs I just mentioned is a good bet in this gold bull market.
And if there’s a LARGE increase in the gold price? Well, the sky’s the limit.
Take that with you for the weekend. Make your plans for next week. I think, if your smart, those plans will include gold, silver and miners.
All the best,
Sean
STAY INFORMED! Receive our Weekly Recap of thought provoking articles, podcasts, and radio delivered to your inbox for FREE! Sign up here for the HoweStreet.com Weekly Recap.
Sean Brodrick August 2nd, 2020
Posted In: Wealth Wave