ALWAYS CONSULT YOUR INVESTMENT PROFESSIONAL BEFORE MAKING ANY INVESTMENT DECISION

June 4, 2020 | Week 11 of the U.S. Labor Market Collapse: Signs of Having Hit Bottom, Finally

Wolf Richter


To determine if the collapse of the US labor market hit bottom, the combined number of people still receiving unemployment benefits under state programs and under federal programs – such as gig workers receiving benefits under the Pandemic Unemployment Assistance program – need to stop growing. And for the first time since this fiasco started, this appears to be happening, according to data released today by the Department of Labor.
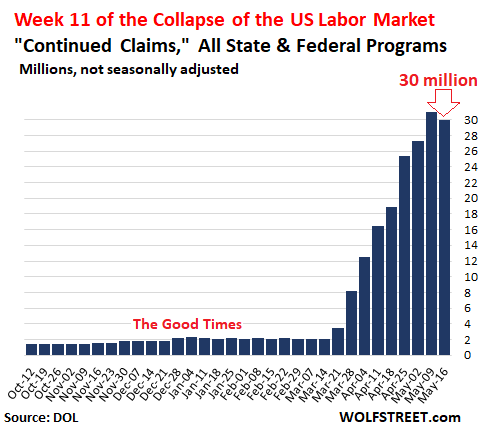
The total number of people who are still receiving unemployment benefits and who have not yet found jobs or gotten their old jobs back – the “insured unemployed” – under all state and federal programs fell by nearly 1 million to a still gut-wrenching 29.97 million (not seasonally adjusted):
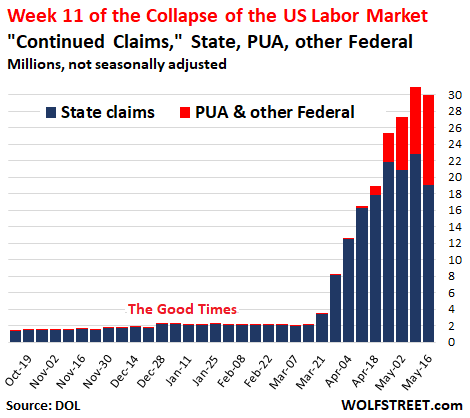
This decline in the total number of “insured unemployed” was a result of a drop in the state programs over the past few weeks and a surge in federal programs, especially under the federal Pandemic Unemployment Assistance (PUA) program for gig workers.
States are catching up processing claims by gig workers.
In the week ended May 30, an additional 623,073 gig workers filed initial claims under the federal PUA program (not seasonally adjusted).
The total number of gig workers still receiving unemployment benefits under PUA, and who’d filed during or before the week ended May 16, surged to 10.7 million. In other words, gig workers are now over one-third of the 30 million total insured unemployed.
The stacked chart below shows this continued surge of the number of insured unemployed under federal programs (red) and the declining number of insured employed under state programs. In total, nearly 30 million people are now on unemployment insurance rolls – but that’s down a by nearly 1 million from last week:
New claims under state programs surge at a gut-wrenching pace but some people are getting their jobs back
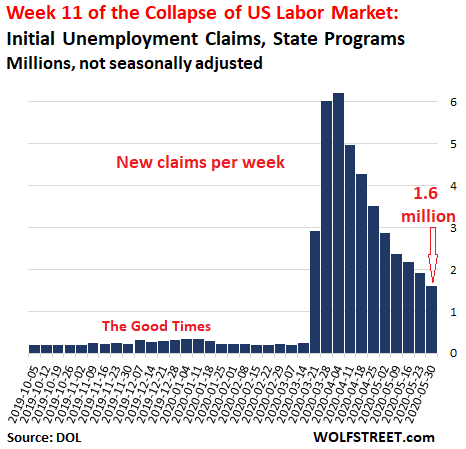
About 1.6 million workers filed initial unemployment claims under state programs (not seasonally adjusted) in the week ended May 30, a clear sign that layoffs continue at a gut-wrenching and previously unimaginable pace, nearly three times the magnitude of the weekly records during the unemployment crises in 1982 and 2009. But it was way down from the 6-million range of initial claims during the weeks in early April:
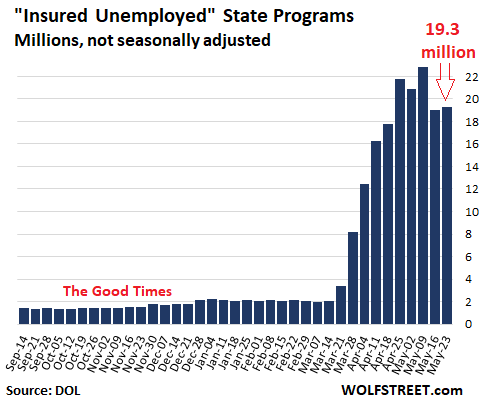
The number of people who applied for unemployment insurance under state programs during or before the week ended May 23 and still have not found a job ticked up by 244,000 to 19.3 million (not seasonally adjusted). Yet, this 19.3 million was down from 22.8 million three weeks ago – meaning that even as millions of additional people were laid off during those weeks, more people were hired back or found new jobs. This chart shows these continuing claims under state programs through the week ended May 23:
The 28 states with the most “initial claims.”
The table below lists the states with the largest number of initial claims filed in the week ended May 30 under state programs. They do not include claims under federal programs, such as PUA claims:
| Top 28 States, Initial Claims in the week ended May 30 | ||
| 1 | California | 230,461 |
| 2 | Florida | 206,494 |
| 3 | Georgia | 148,095 |
| 4 | Texas | 106,821 |
| 5 | New York | 82,981 |
| 6 | Pennsylvania | 50,462 |
| 7 | Illinois | 46,522 |
| 8 | Kentucky | 42,793 |
| 9 | Michigan | 41,035 |
| 10 | Oklahoma | 37,986 |
| 11 | North Carolina | 36,400 |
| 12 | Washington | 34,873 |
| 13 | Ohio | 34,638 |
| 14 | Virginia | 32,202 |
| 15 | Maryland | 31,343 |
| 16 | Massachusetts | 27,174 |
| 17 | New Jersey | 25,632 |
| 18 | Wisconsin | 25,026 |
| 19 | Mississippi | 23,945 |
| 20 | Indiana | 23,591 |
| 21 | Tennessee | 22,784 |
| 22 | Minnesota | 22,466 |
| 23 | Arizona | 22,067 |
| 24 | Alabama | 20,785 |
| 25 | Louisiana | 19,810 |
| 26 | Oregon | 19,506 |
| 27 | Missouri | 19,139 |
| 28 | South Carolina | 18,986 |
On this basis of people receiving unemployment insurance, the “insured unemployment rate” in the US for the week ended May 23 ticked up to 13.2% (not seasonally adjusted), from a revised 12.9% the week before.
For historical perspective, the record in the pre-pandemic era was 7.9% (not seasonally adjusted) in May 1975.
But the increase this week in the “insured unemployment rate” was small, and last week, the rate had dropped sharply from the peak two weeks ago. So in terms of this metric, it too looks like the collapse of the US labor market is no longer getting worse but has bottomed out, as layoffs continue at a gut-wrenching pace but other people are getting hired back.
Are the Work-from-Home-Folks Moving to Cheaper Pastures? Read… Rents in the Most Expensive Cities Drop. Oil Patch Gets Hit Too. But Massive Gains in Other Cities
STAY INFORMED! Receive our Weekly Recap of thought provoking articles, podcasts, and radio delivered to your inbox for FREE! Sign up here for the HoweStreet.com Weekly Recap.
Wolf Richter June 4th, 2020
Posted In: Wolf Street