ALWAYS CONSULT YOUR INVESTMENT PROFESSIONAL BEFORE MAKING ANY INVESTMENT DECISION

May 9, 2020 | The State of the American Debt Slaves, Q1 2020

Wolf Richter


Most of the first quarter was still the Good Times, but in later February and early March it hit the fan, as markets were crashing. In mid-March lockdowns started to roll across the country, and the layoffs by the tens of millions commenced. So how were consumers positioned going into this crisis? Many of them, up to their eyeballs in debt.
Consumer debt – student loans, auto loans, and revolving credit such as credit cards and personal loans but excluding housing-related debts such as mortgages and HELOCs – jumped by $153 billion at the end of the first quarter, compared to Q1 a year earlier, or by 3.8%, to $4.15 trillion (not seasonally adjusted), according to Federal Reserve data:
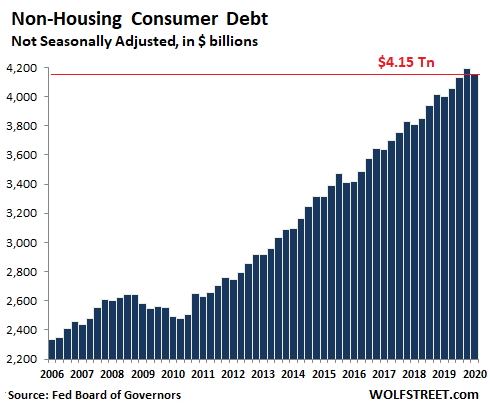
In March, the problems already became apparent. On a seasonally adjusted basis (the above is not seasonally adjusted), consumer credit fell 0.3% in March from February, and except for December 2015, when a large statistical adjustment was made, this was the first month-to-month decline since the Great Recession.
OK, we know consumer credit is going to plunge. Balances of auto loans and credit loans will come down not because consumers are suddenly more prudent, but because they have lost their jobs and will default on their credit cards and auto loans. Those defaults were already happening going into the crisis, and they’re now accelerating. When lenders write those loans off, the consumer credit balances come down. Nothing to do with prudence of consumers but with losses at lenders.
Then there are student loans. They’re the exception. They’re spiking. As we’ll see in a moment, an increasing number of student-loan borrowers have stopped making payments and are waiting for debt forgiveness, funded by the Dear Taxpayer, now that this is being bandied about by politicians to buy votes with taxpayer money. And as old loans are not being paid down, and new loans are added on top, the total loan balances soar.
So how are consumers positioned going into this crisis?
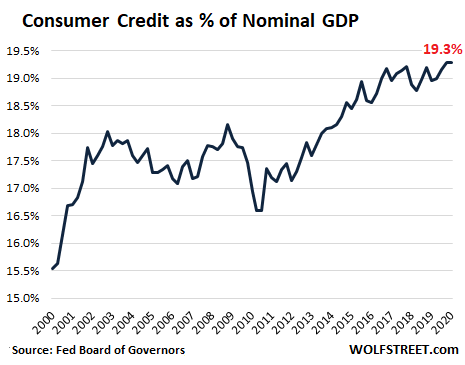
Proportionately, how heavy is the burden of this $4.15 trillion in consumer debt? When measured against the size of the US economy, it amounted to 19.3% of nominal GDP in Q1 and in Q4 last year, the highest ever in the data. Here are the last two decades:
But these are aggregate numbers. Credit problems arise at the margin.
Many Americans have no debt burden. Over one-third of homeowners own their homes without a mortgage. Many other homeowners have substantially paid down their mortgage and have a large portion of equity in their homes. Many Americans have no outstanding credit card balances because they pay them off monthly. They have no student loans and no auto loans, and they’re awash in savings and investments.
Then across much of the rest of the spectrum are Americans who have more or less debt. In this group are the people that have maxed-out credit cards that cost them 25% in interest a year, and they have subprime auto loans that cost them 19% in interest, and they have student loans from years ago, and no savings. In this group are also people with fairly high incomes that have taken on too much debt, including credit card debt, and they need every last penny of their high incomes to make ends meet.
But the national data puts all Americans into one bucket – the group that will be just fine no matter what the economy does, and the group that is strung out, plus everyone in between. Credit problems arise among those who’re strung out and who scramble to make ends meet.
Tens of millions of Americans lost their jobs. Many will receive unemployment compensation, but not all. For lower-paid workers in less expensive areas, the unemployment package with the weekly $600 from the federal government may turn out to be a big raise, but that weekly $600, even if it’s extended, will eventually run out.
And for people with higher incomes in more expensive areas, this math doesn’t work, and it won’t cover their bills. A highly indebted dentist at a dental practice that shut down needs a lot of income to pay for the home in an expensive city, the nice cars, and student loans out the wazoo. This dentist isn’t going to make it on the unemployment package.
Credit cards and other Revolving credit.
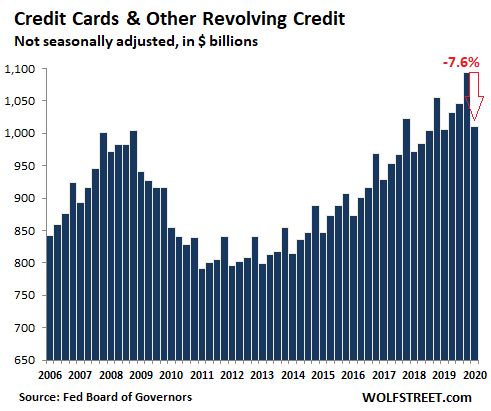
Balances on credit cards and other revolving credit, after dipping in March from February, were up only 0.5% compared to a year ago, at $1.01 trillion. In overall terms, it amounted to 4.7% of nominal GDP, down from peak-credit-card-craziness in Q4 2008 (6.9% of GDP).
But this is aggregate data and includes many people who don’t have credit card debt. Pressure on credit cards erupts among people who’ve maxed out their credit cards and throw in the towel when priorities change. Note the seasonality from the spike during holiday-shopping season in Q4 and hangover season in Q1. But this Q1 seasonal “dip” of 7.6% from Q4 was far deeper than in prior years when it ranged from 4.1% to 5.0%:
Auto loans & leases and defaults.
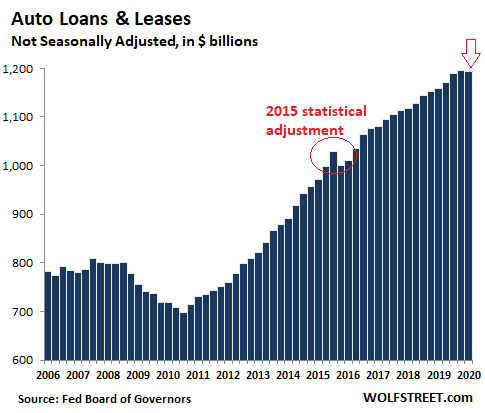
Auto loans and leases outstanding for new and used vehicles in Q1 rose 3.0% year-over-year, to $1.193 trillion. But this was the smallest year-over-year gain since 2010, pushed down by the first Q4-to-Q1 decline since 2010. Auto-loan data is released only quarterly, so we have no data for March. But subprime auto-loans were already exploding before March, and from what lenders are now telling us, it wasn’t pretty in March and has further deteriorated in April:
Student loans: stalling repayments & hoping for loan forgiveness.
There is a meme going around among student-loan borrowers, that only morons would still make payments on their student loans because they’ll soon be forgiven anyway. More and more borrowers are using the numerous options available to defer the loans, counting on debt forgiveness, funded by taxpayers.
And so in Q1, student loans rose 5.2% from a year ago, to $1.68 trillion and are up 70% since 2012, despite an 11% drop in student enrollment over the same period.
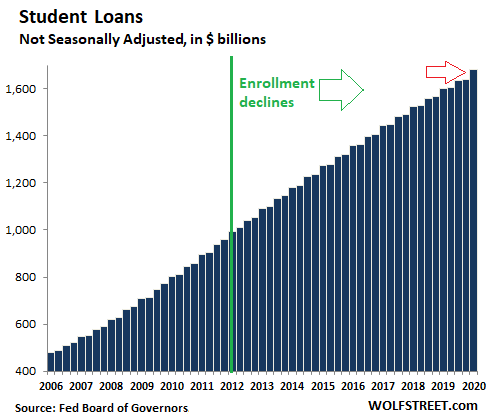
Slow repayments have been the driver behind these ballooning student loan balances. A study by Moody’s found that new loan originations had peaked in 2012 and have declined since then, given the decline in enrollment. This decline was driven by a 24% drop in new borrowing by undergraduates. In 2012, they took out $72 billion in new federal student loans. By 2019, they took out only $55 billion in new loans.
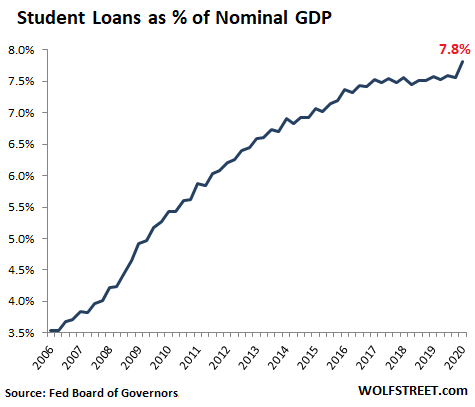
But compared to the overall economy, student loan balances in Q1 spiked to 7.8% of GDP, the highest ever, as student loan repayments have slowed to a trickle:
Many student borrowers don’t owe much: At the end of 2017, of the 45 million federal student-loan borrowers that have to make payments, about 22.5 million owed less than $17,500. This amount of debt is about what people borrow to buy a lower-end new car. In student-loan format, with payments spread out over many years, this debt is very manageable.
A disproportionate share of new student loan debt has been incurred by graduate students: 7% of federal student loan borrowers owe over $100,000 each. Combined, that 7% owes $500 billion, or nearly one-third of all loans.
According to Moody’s study, the repayment rate – the percentage of existing debt that is eliminated each year through repayments – averaged only 3% over the past 10 years. In 2019, it was down to just 2%, with only about $30 billion of outstanding student loans being repaid. Given the surge in balances in Q1, it appears repayments have slowed further – now that many borrowers are counting on debt forgiveness. And balances will likely balloon further going forward, no matter the decline in enrollment.
I’d never imagined I’d ever see this sort of spike, though in recent years I added an upward arrow with “Debt out the wazoo” to my charts, not realizing just how factually accurate this technical term would become. Read… US National Debt Spiked by $1.5 trillion in 6 Weeks, to $25 trillion. Fed Monetized 90%
STAY INFORMED! Receive our Weekly Recap of thought provoking articles, podcasts, and radio delivered to your inbox for FREE! Sign up here for the HoweStreet.com Weekly Recap.
Wolf Richter May 9th, 2020
Posted In: Wolf Street
Next: 3 Smokin’ Hot Gold Charts »